ggplot2 中級データ可視化
Rick Scavetta
Founder, Scavetta Academy
geom_count()
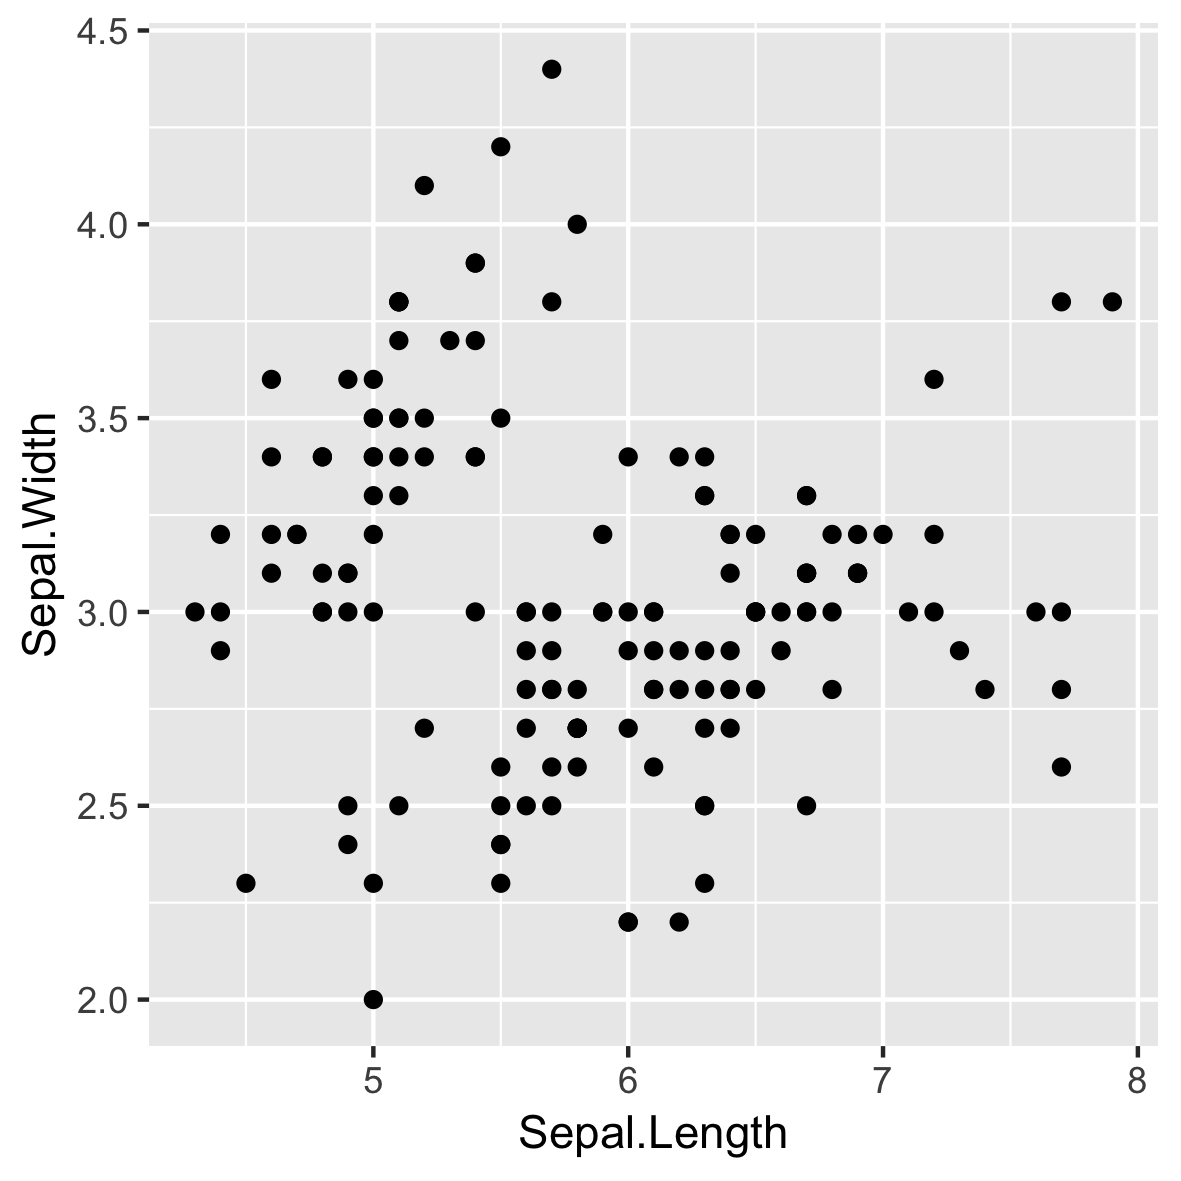
p <- ggplot(iris, aes(Sepal.Length,
                      Sepal.Width))

p + geom_point()
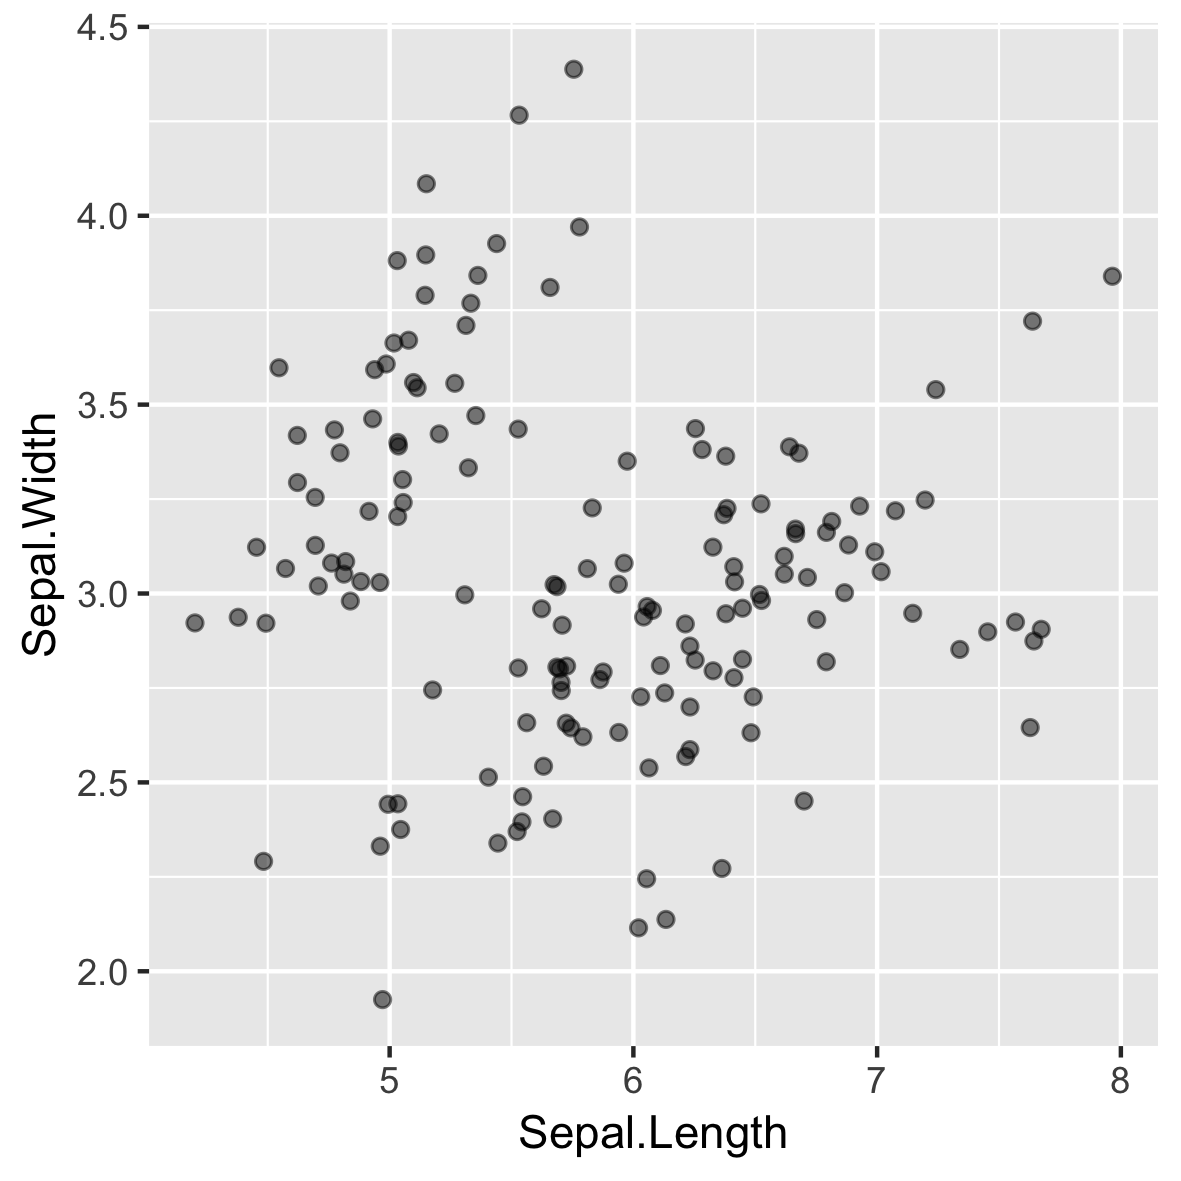
p + geom_jitter(alpha = 0.5,
                width = 0.1,
                height = 0.1)
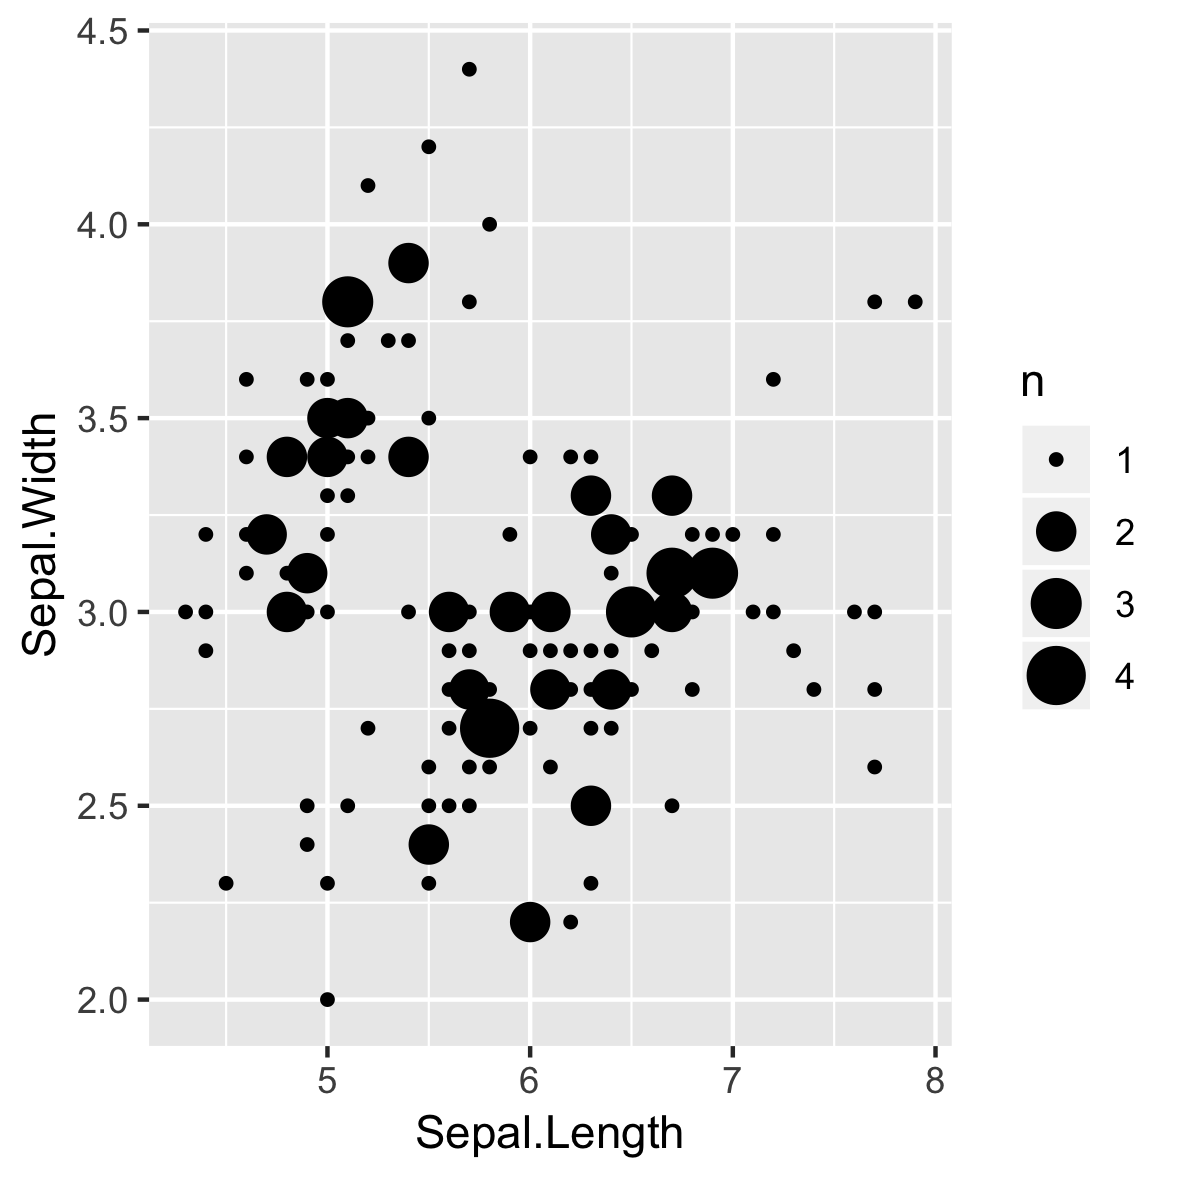
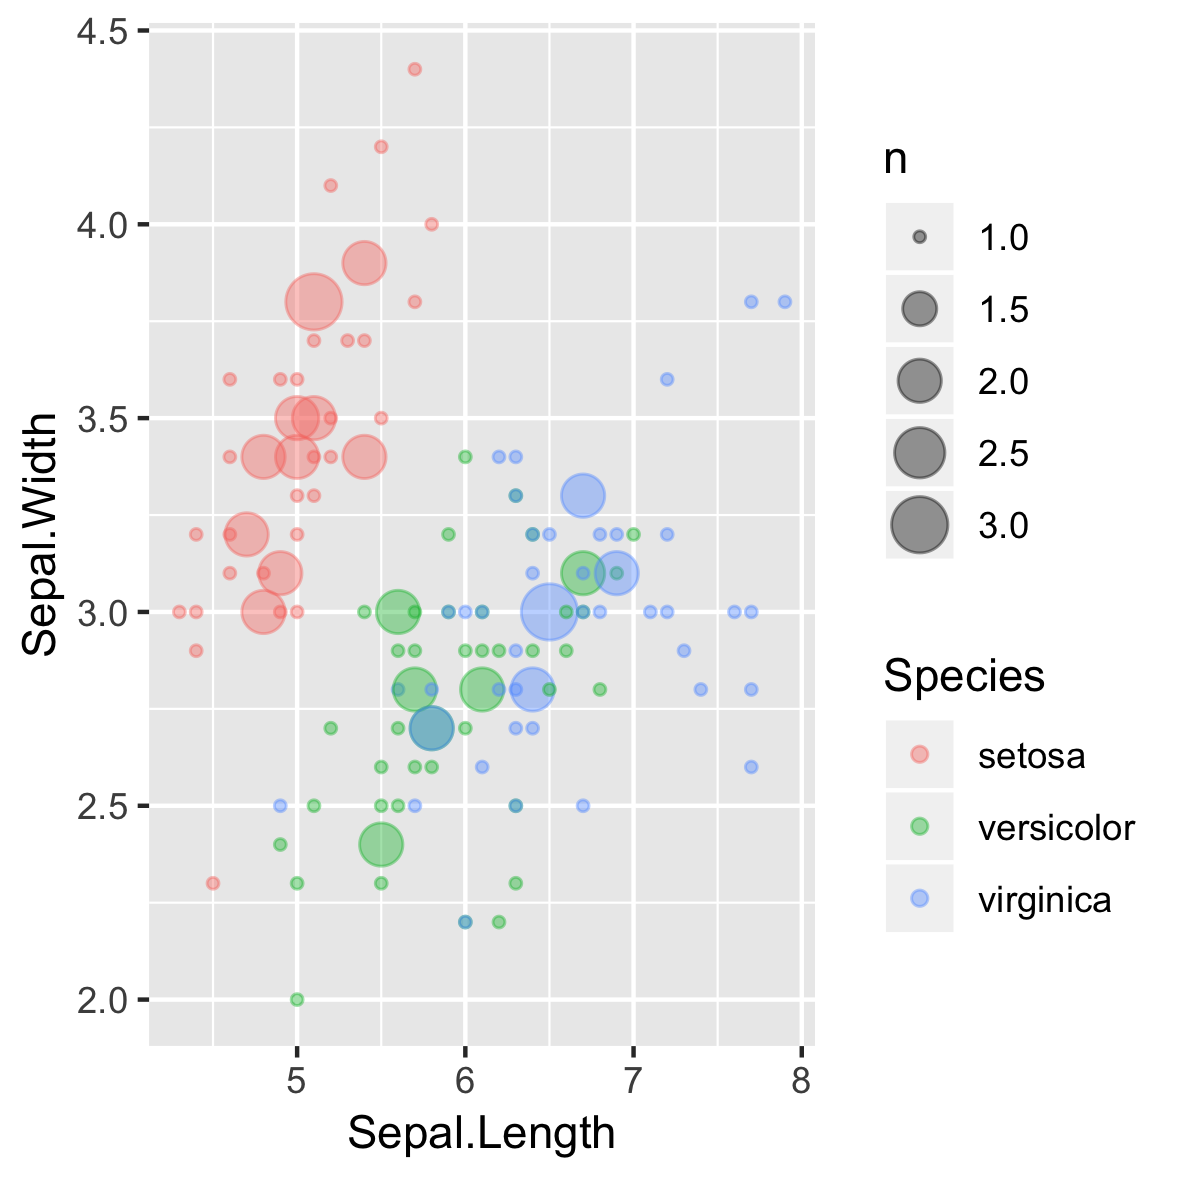
p +
  geom_count()
stat_sum()
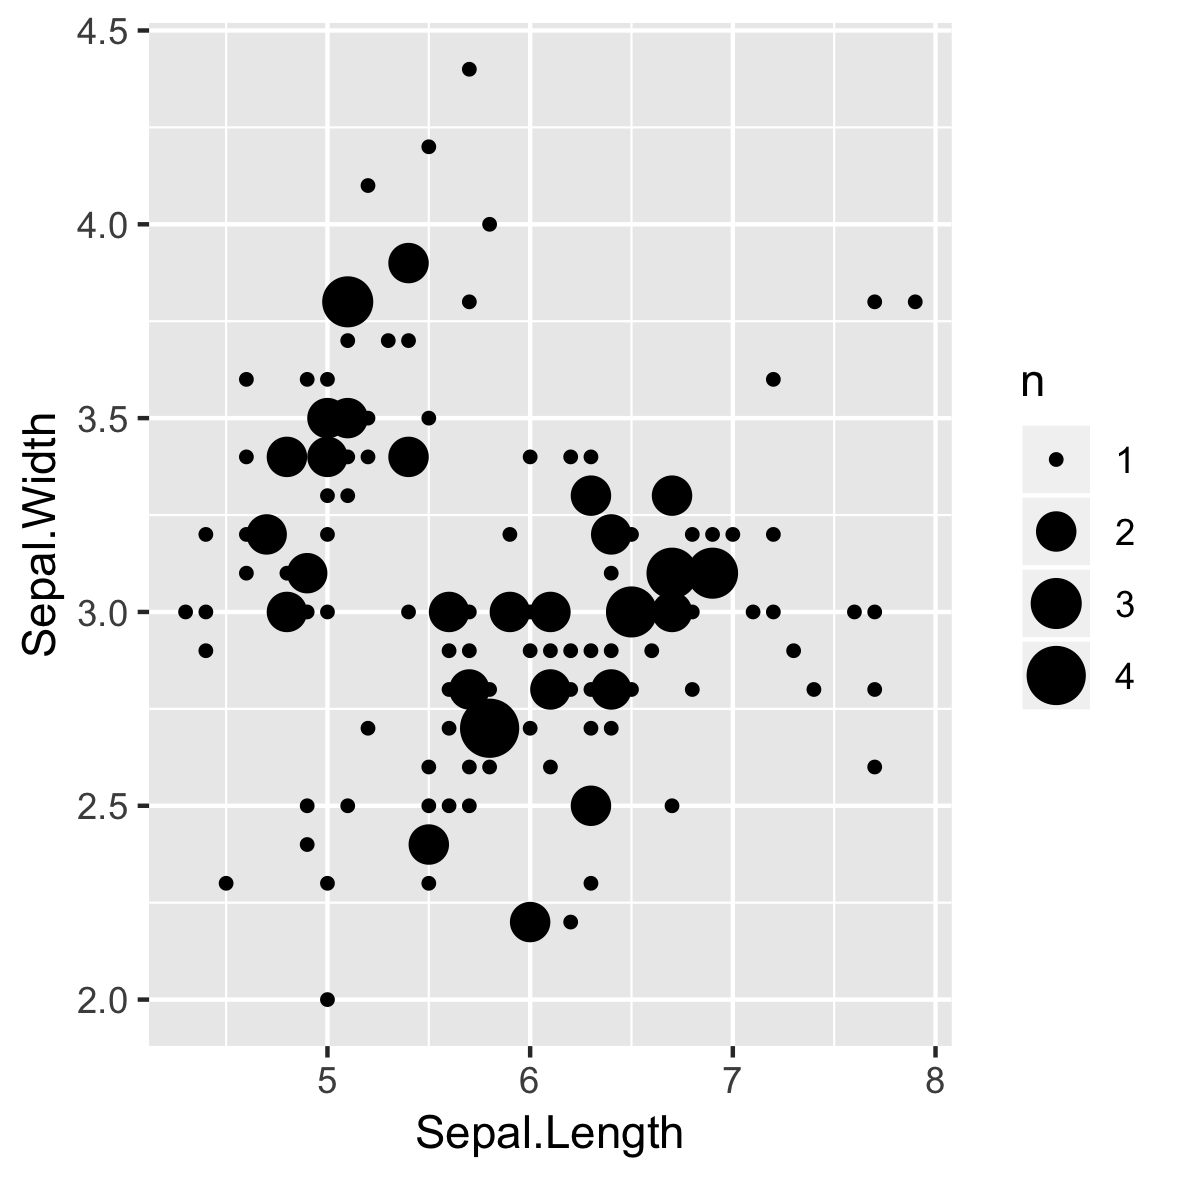
p +
  stat_sum()
ggplot(iris, aes(Sepal.Length,
                 Sepal.Width,
                 color = Species)) +
  geom_count(alpha = 0.4)
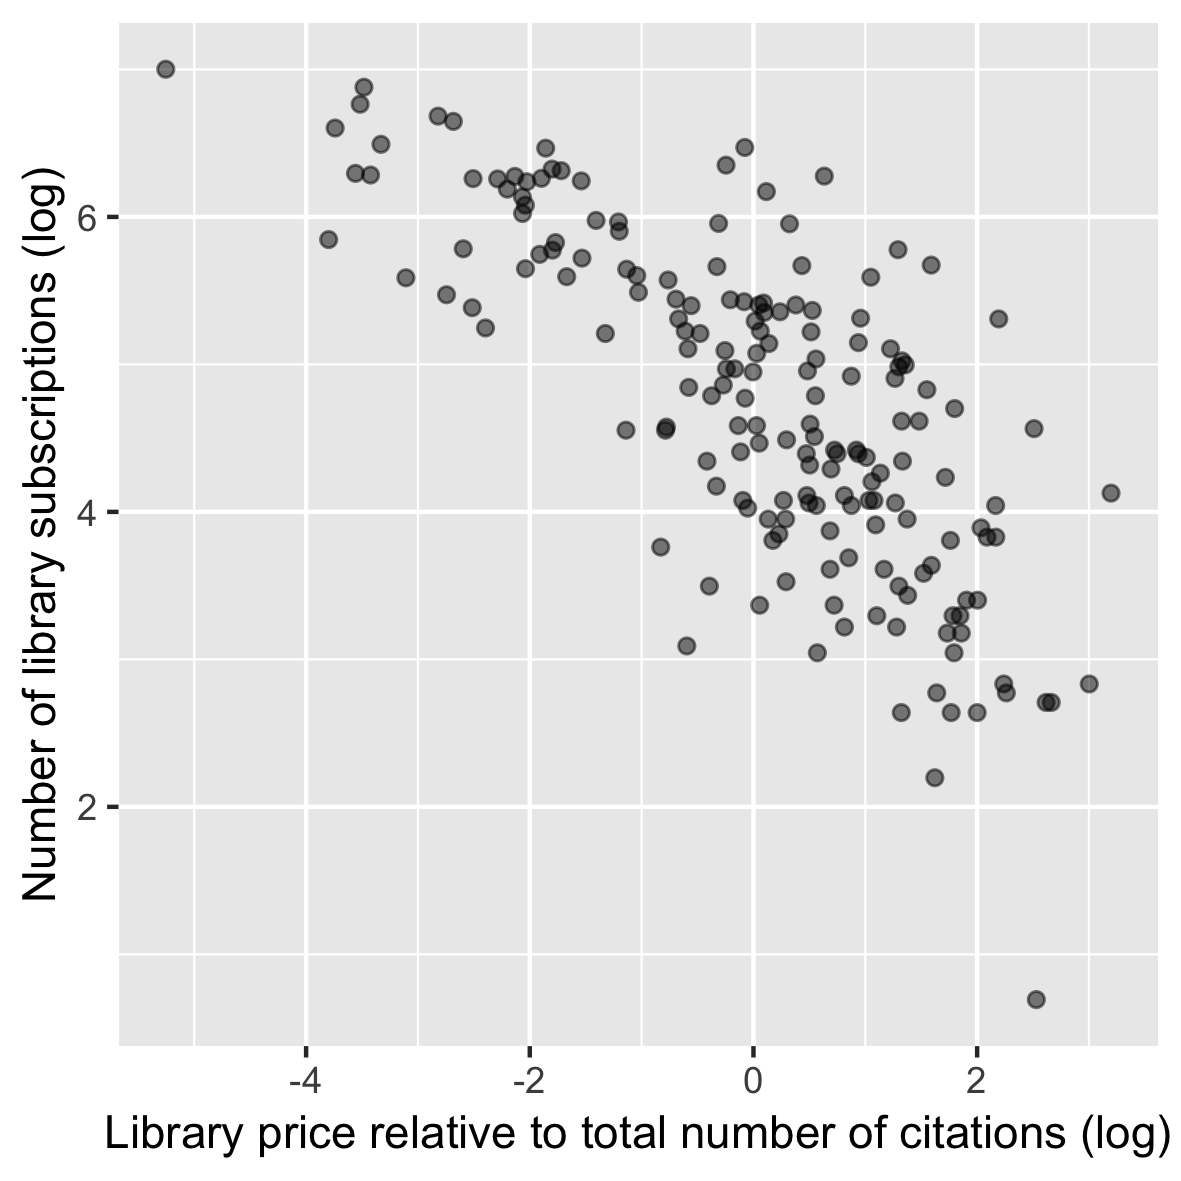
library(AER)
data(Journals)

p <- ggplot(Journals,
            aes(log(price/citations),
                log(subs))) +
  geom_point(alpha = 0.5) +
  labs(...)

p
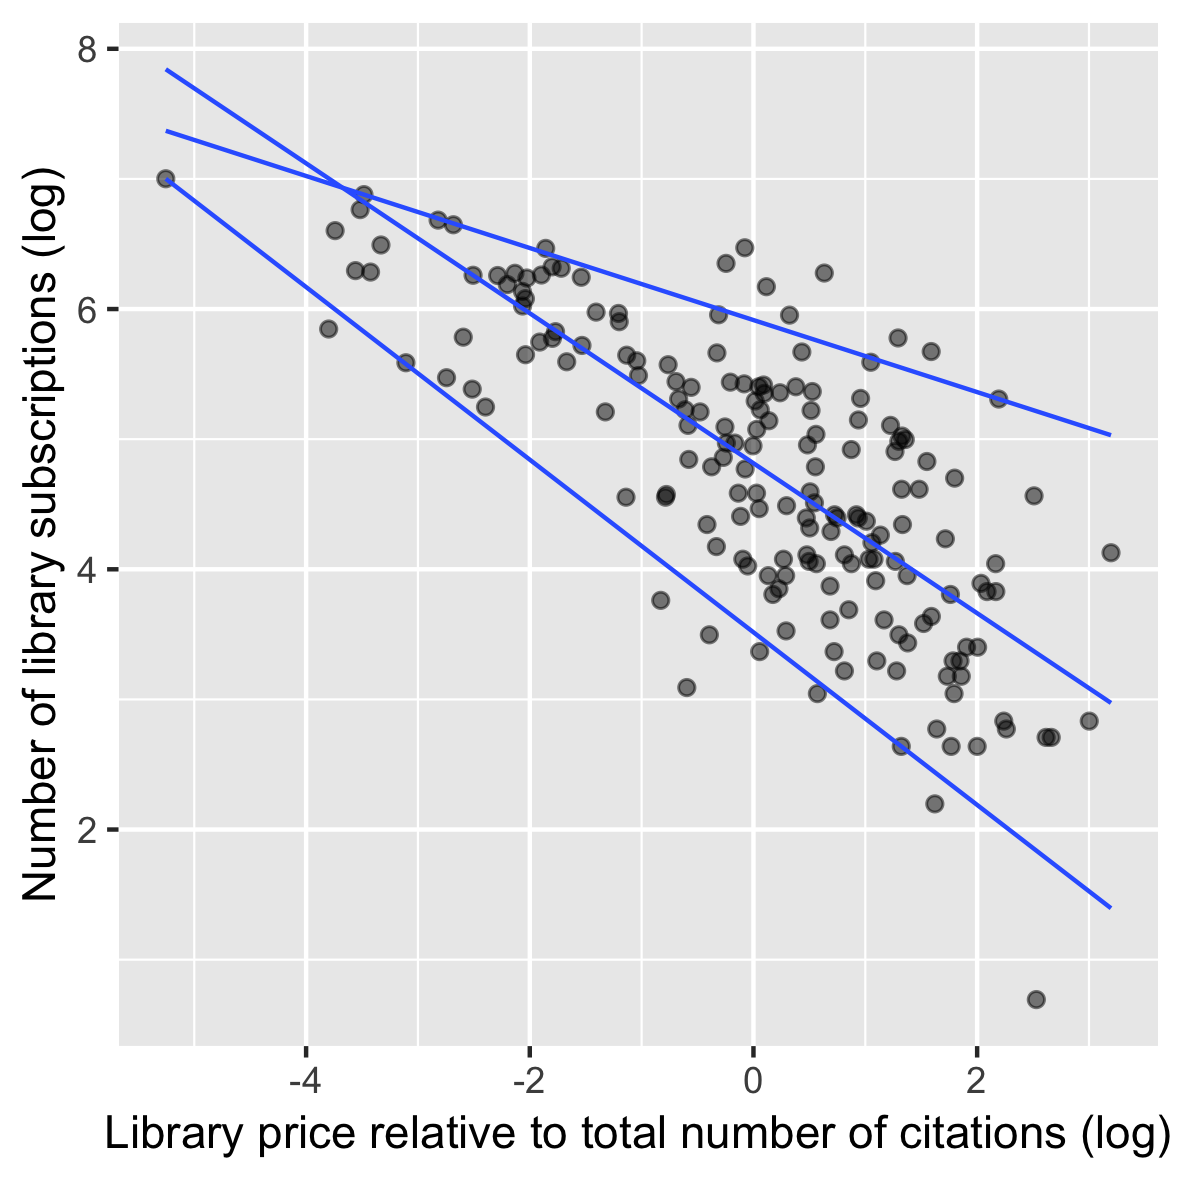
p +
  geom_quantile(quantiles =
                c(0.05, 0.50, 0.95))
geom_quantile()
stat_quantile()