座標とスケール
ggplot2 中級データ可視化

Rick Scavetta
Founder, Scavetta Academy
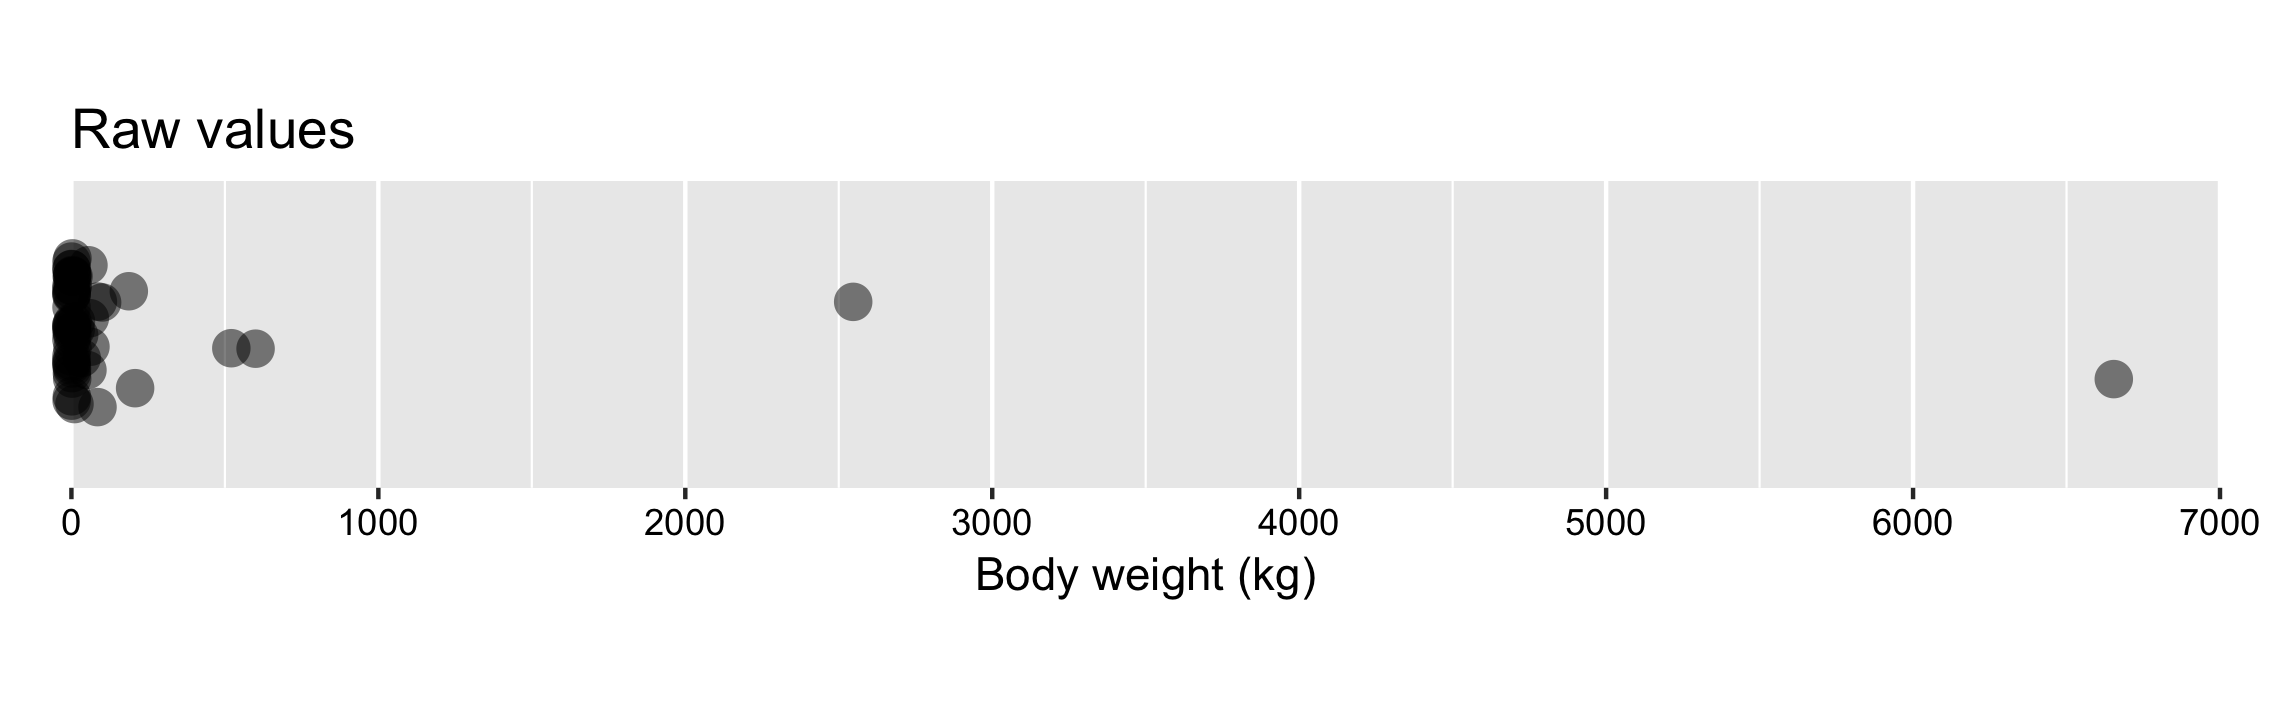
生データをプロット
ggplot(msleep, aes(bodywt, y = 1)) +
  geom_jitter() +
  scale_x_continuous(limits = c(0, 7000),
                     breaks = seq(0, 7000, 1000))
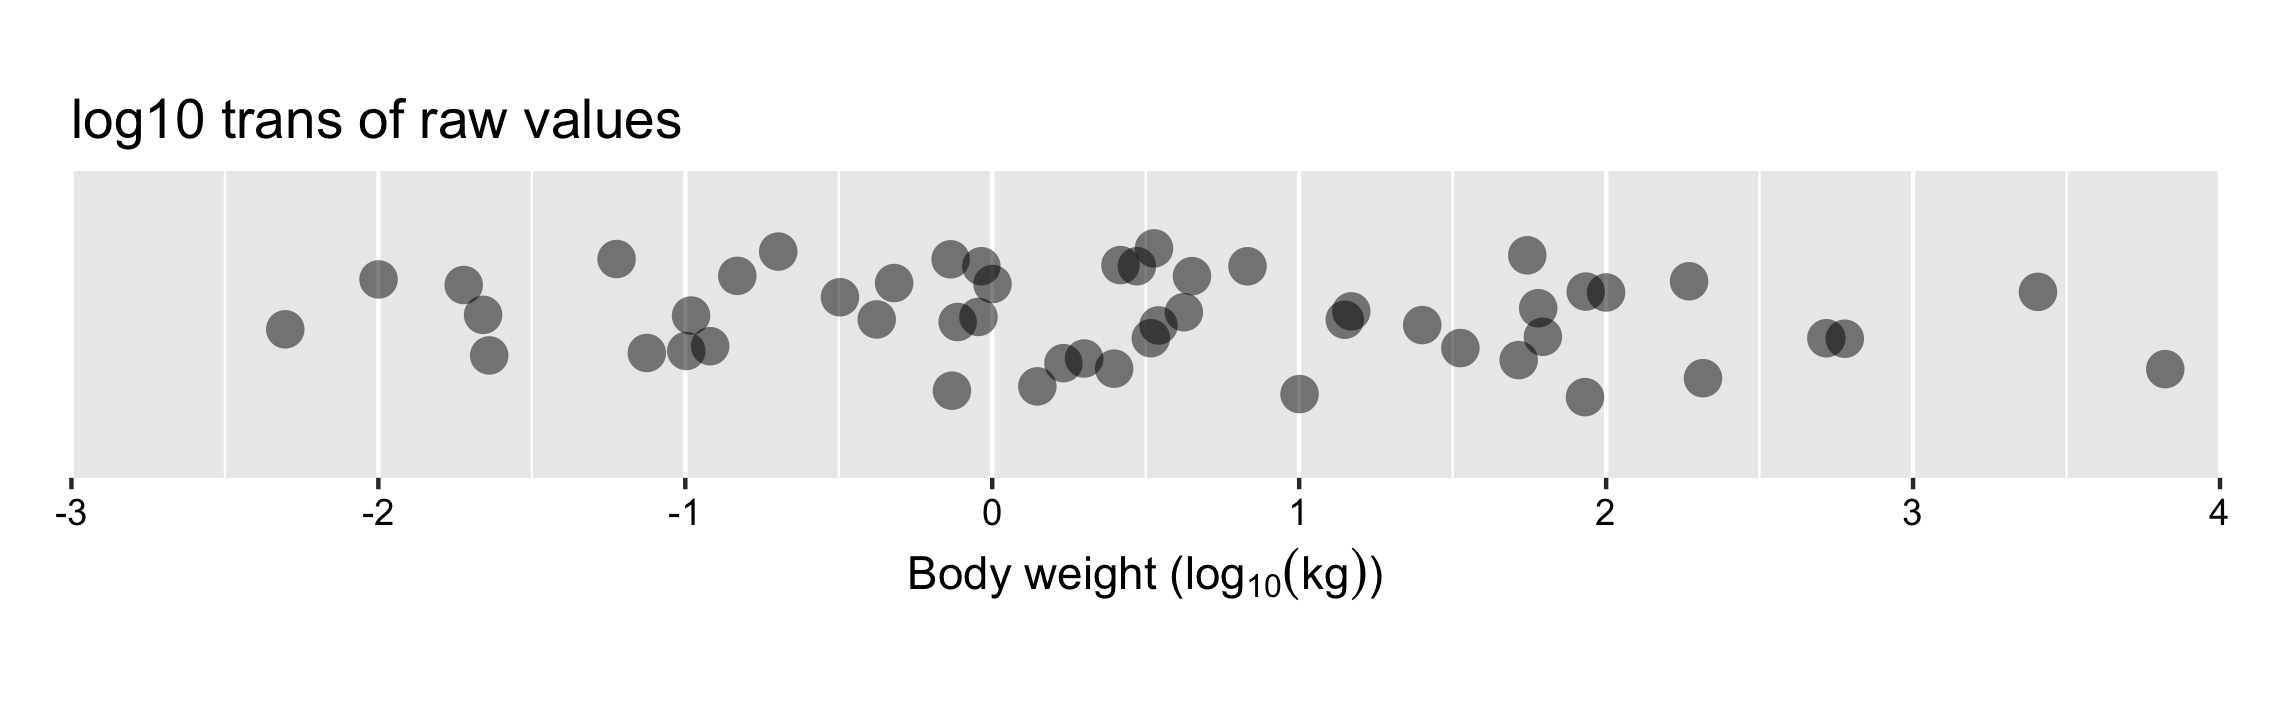
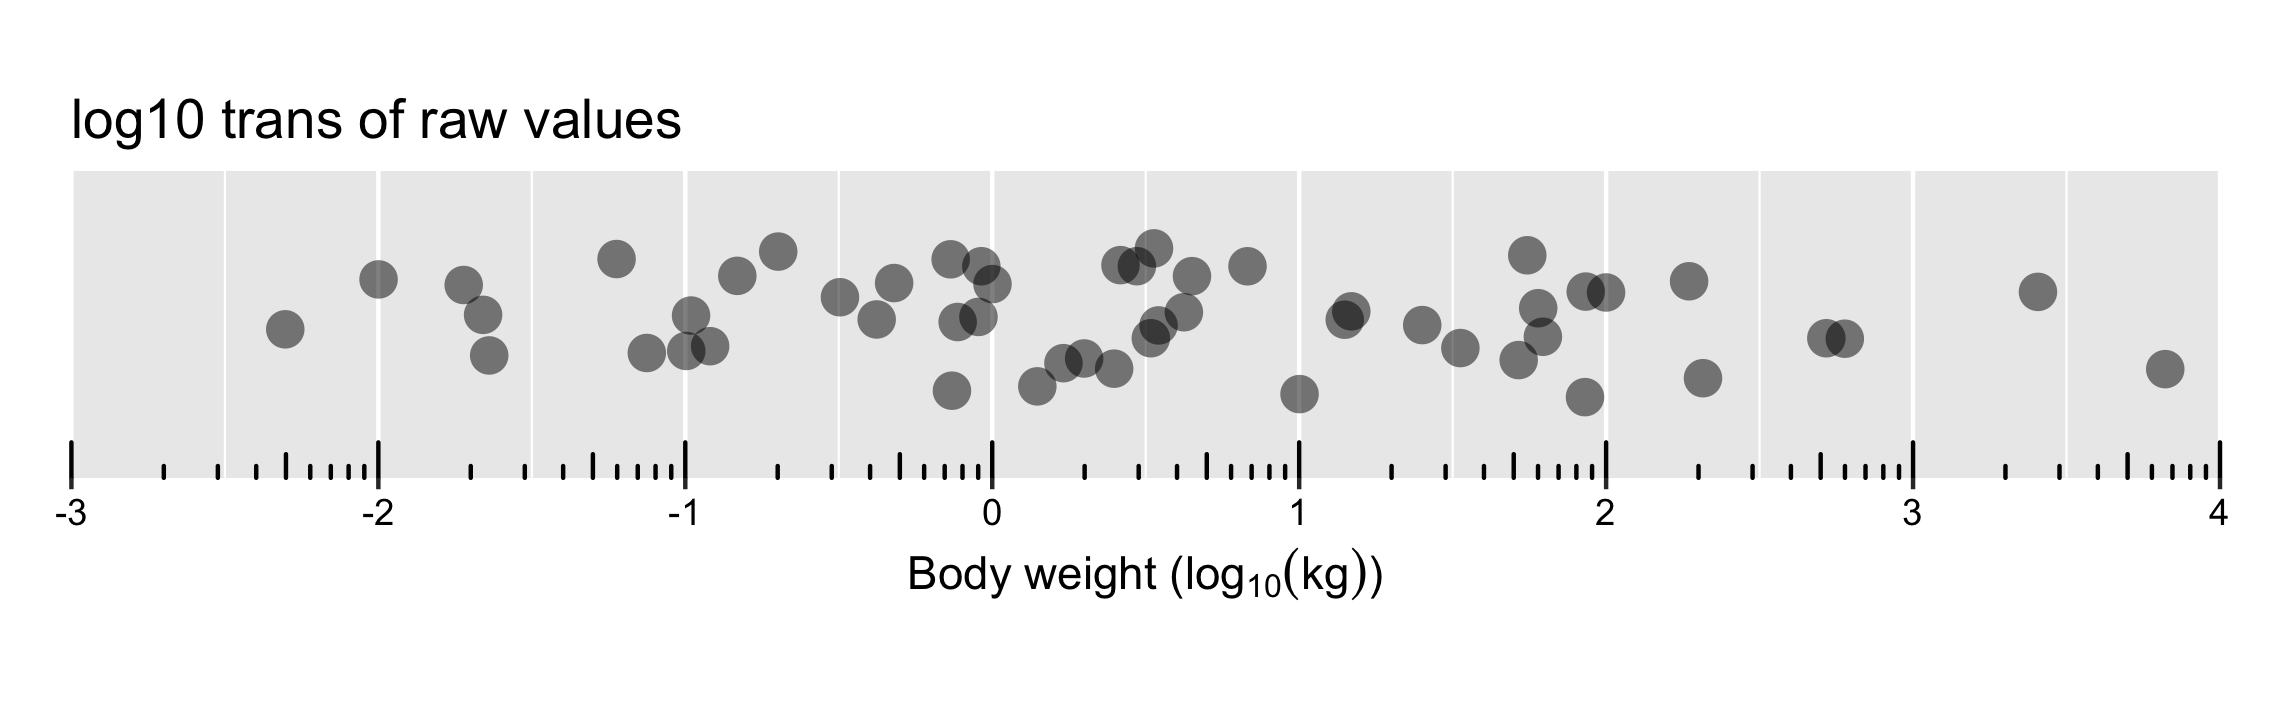
生データを変換
ggplot(msleep, aes(log10(bodywt), y = 1)) +
  geom_jitter() +
  scale_x_continuous(limits = c(-3, 4),
                     breaks = -3:4)
対数目盛りを注釈追加
ggplot(msleep, aes(log10(bodywt), y = 1)) +
  geom_jitter() +
  scale_x_continuous(limits = c(-3, 4),
                     breaks = -3:4) +
  annotation_logticks(sides = "b")
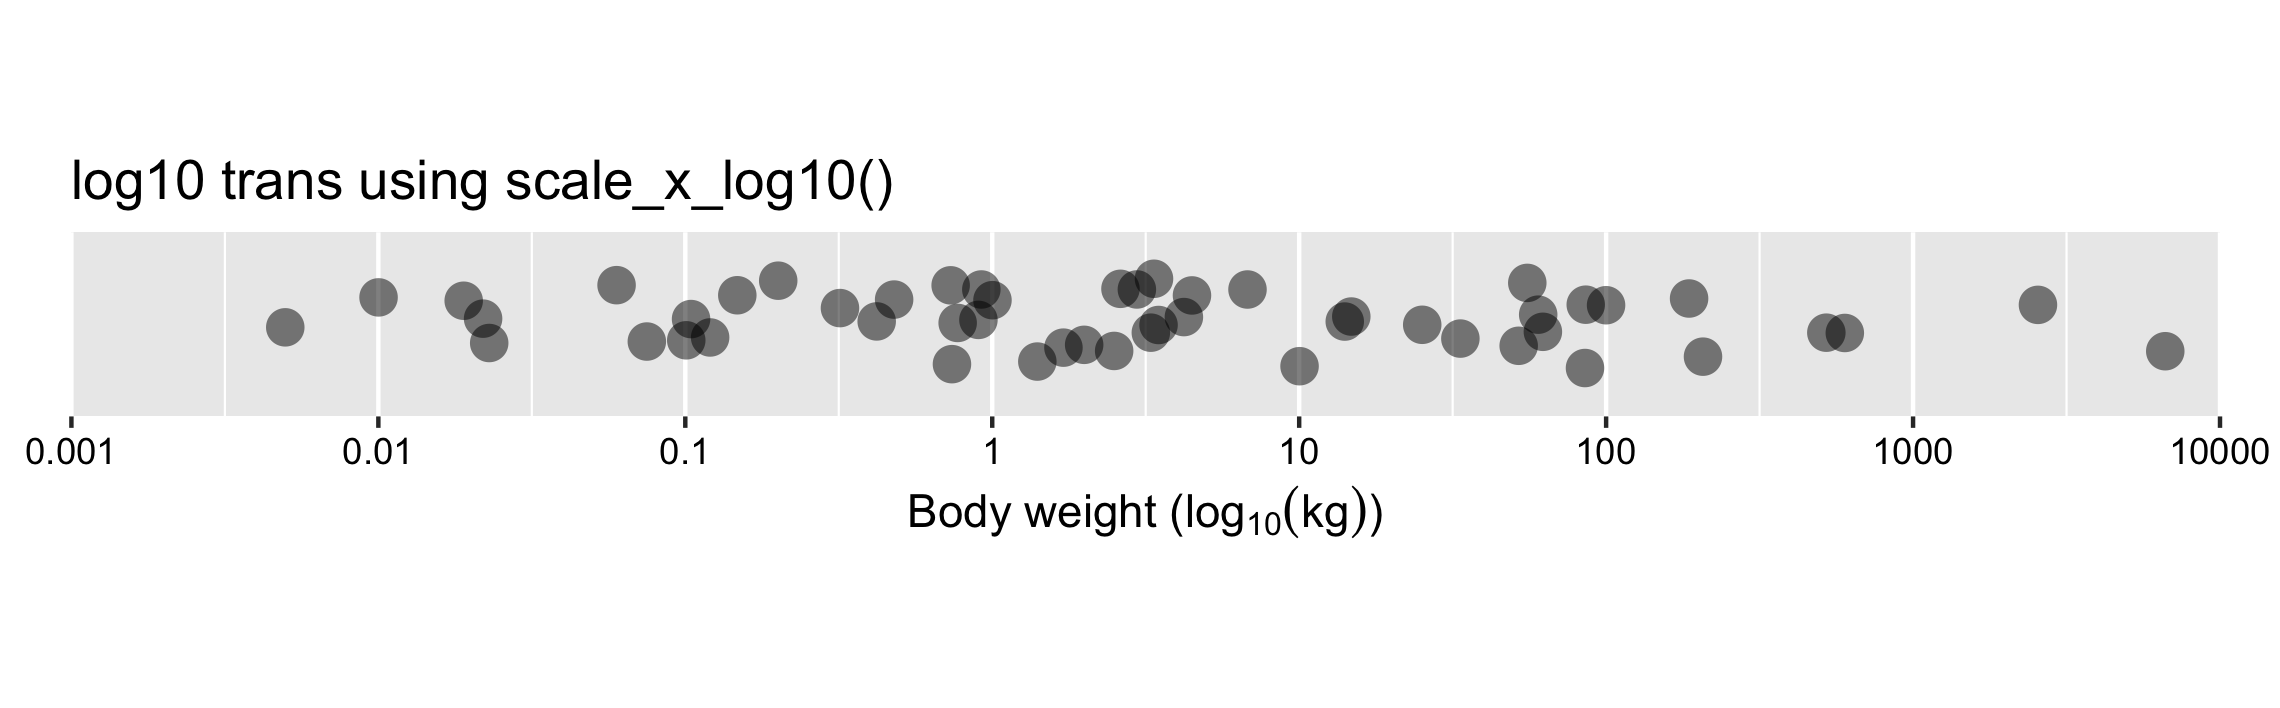
scale_*_log10() を使う
ggplot(msleep, aes(bodywt, y = 1)) +
  geom_jitter() +
  scale_x_log10(limits = c(1e-03, 1e+04))
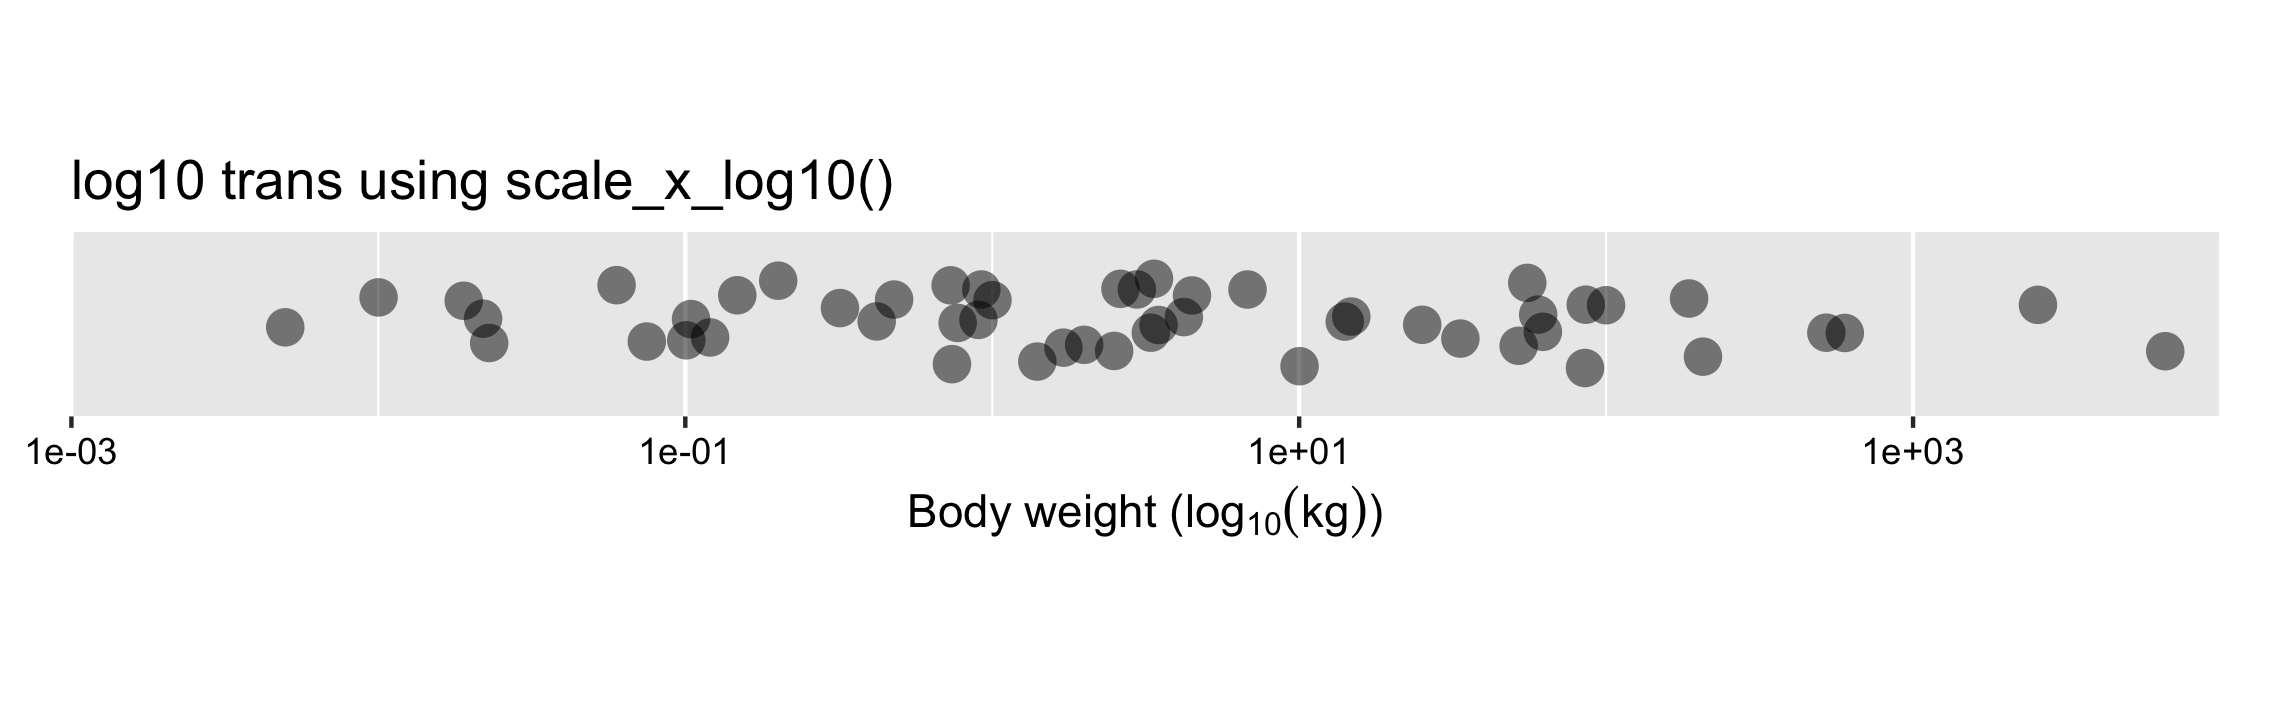
直接変換と scale_*_log10() の出力を比較
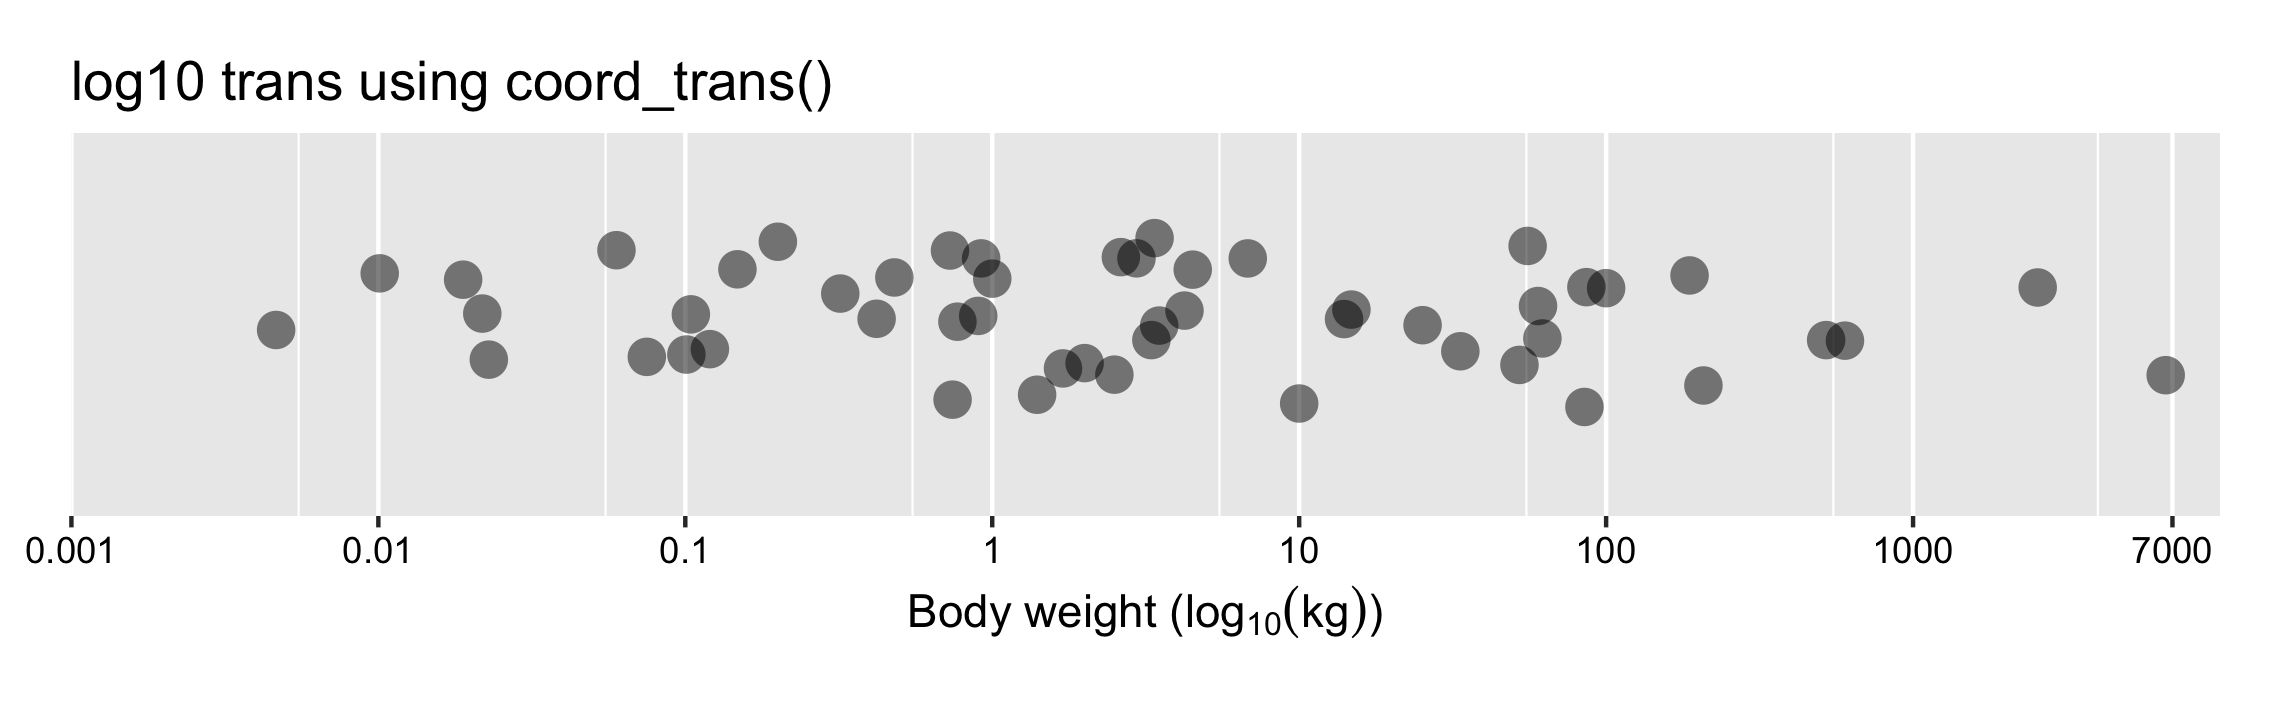
coord_trans() を使う
ggplot(msleep, aes(bodywt, y = 1)) +
  geom_jitter() +
  coord_trans(x = "log10")
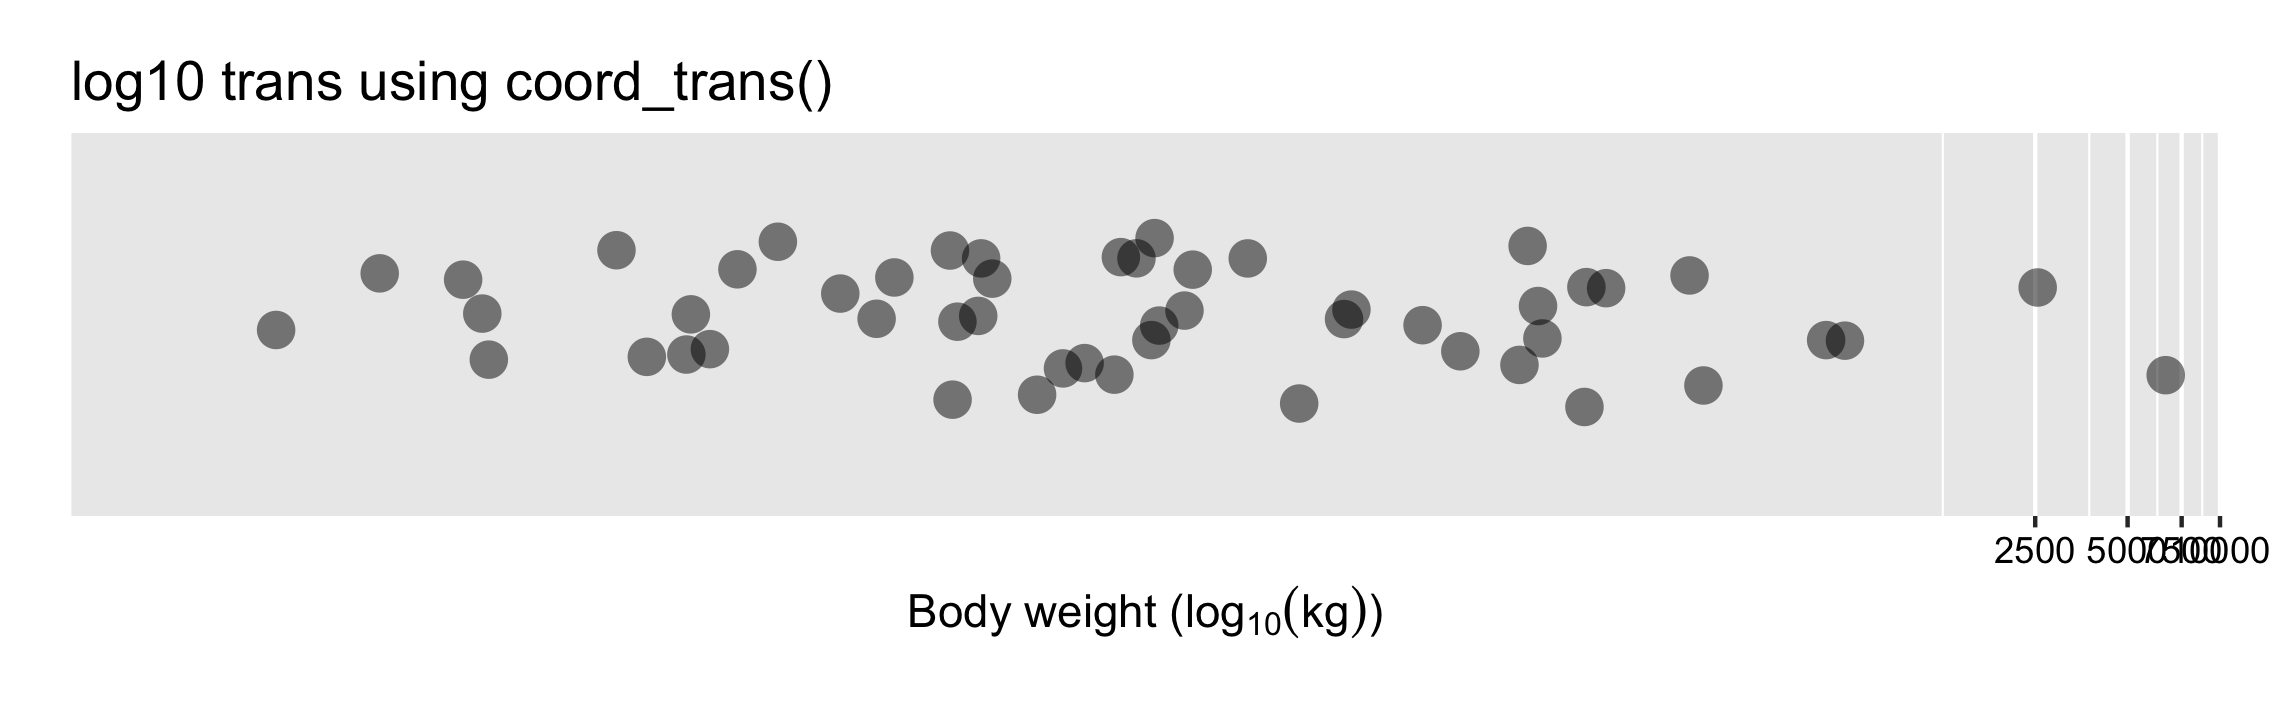
scale_*_log10() と coord_trans() の出力を比較
ラベルの調整