Pythonでの時系列データ操作
Stefan Jansen
Founder & Lead Data Scientist at Applied Artificial Intelligence
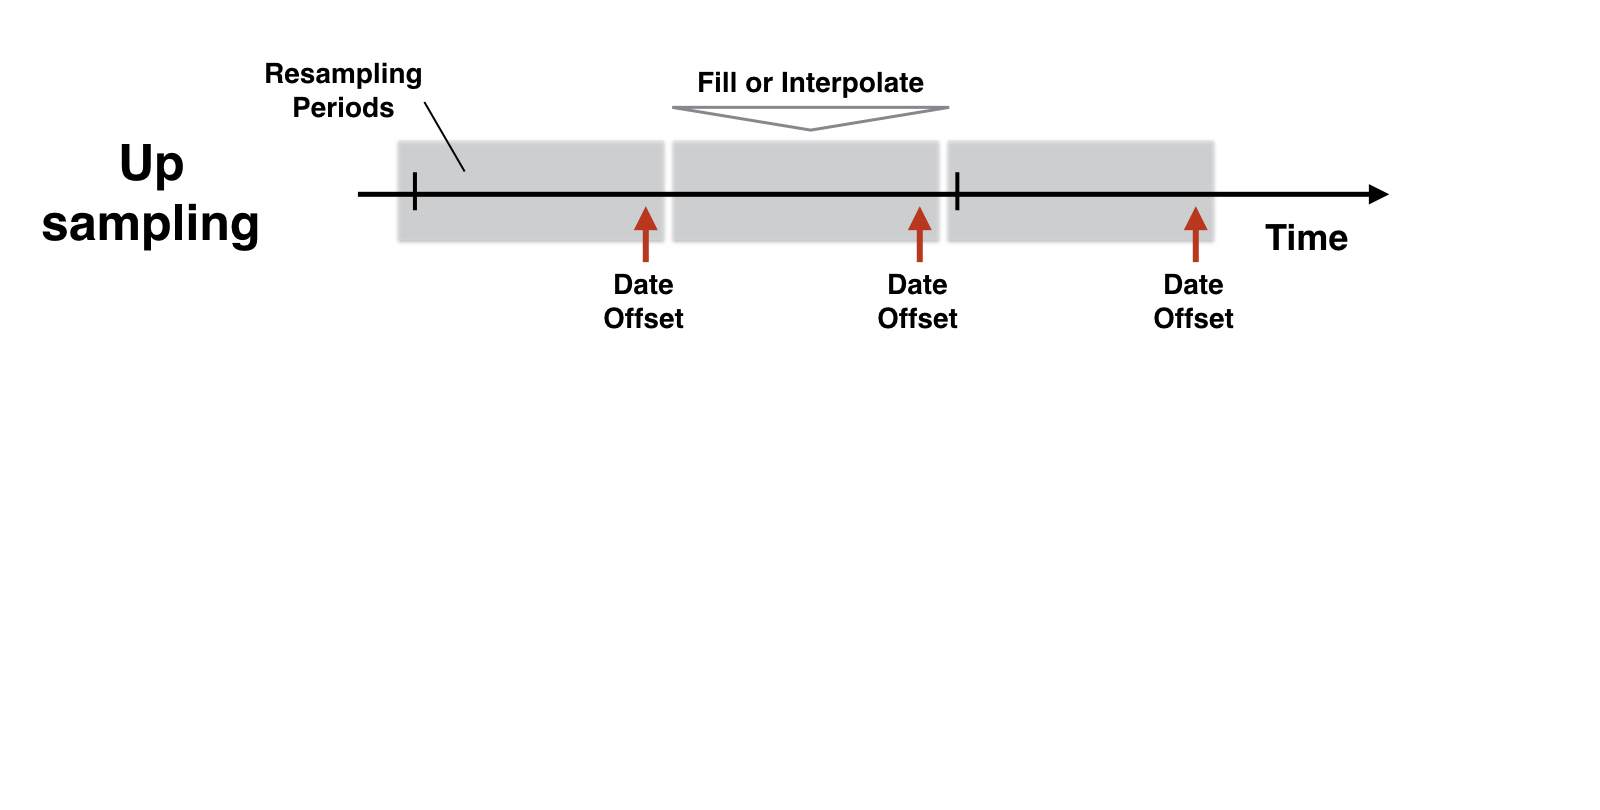
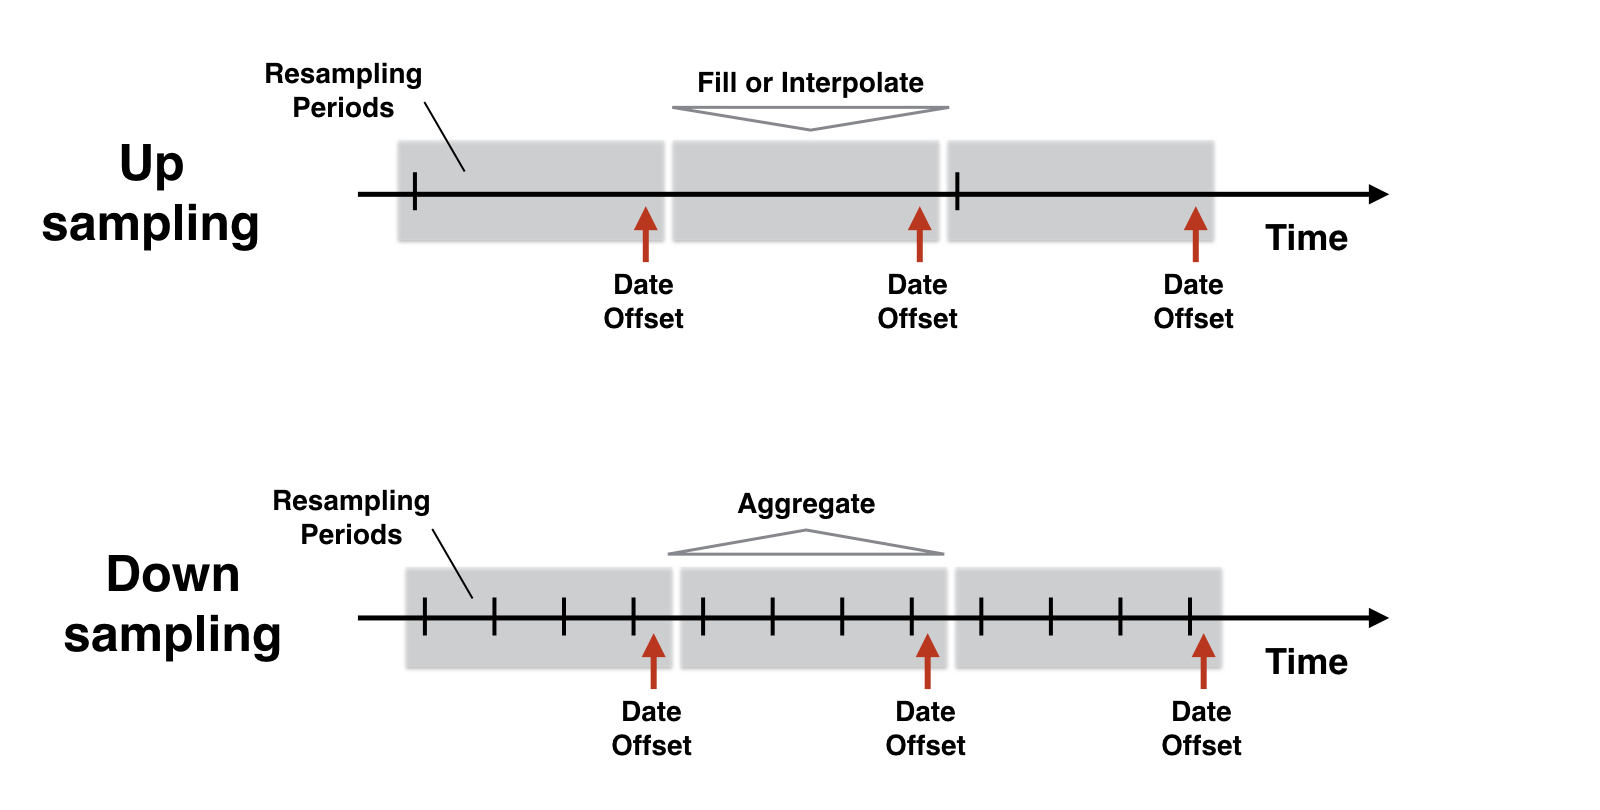
.resample()は.groupby()に類似
リサンプリング期間内でグループ化し、各グループにメソッドを適用
新しい日付はオフセットで決定(開始・終了など)
アップサンプリング: 既存値の充填または補間
ダウンサンプリング: 既存データを集約
unrate = pd.read_csv('unrate.csv', parse_dates['Date'], index_col='Date')unrate.info()
DatetimeIndex: 208 entries, 2000-01-01 to 2017-04-01
Data columns (total 1 columns):
UNRATE 208 non-null float64 # 頻度情報なし
dtypes: float64(1)
unrate.head()
UNRATE
DATE
2000-01-01 4.0
2000-02-01 4.1
2000-03-01 4.0
2000-04-01 3.8
2000-05-01 4.0
| Frequency | Alias | Sample Date |
|---|---|---|
| Calendar Month End | M | 2017-04-30 |
| Calendar Month Start | MS | 2017-04-01 |
| Business Month End | BM | 2017-04-28 |
| Business Month Start | BMS | 2017-04-03 |


unrate.asfreq('MS').info()
DatetimeIndex: 208 entries, 2000-01-01 to 2017-04-01
Freq: MS
Data columns (total 1 columns):
UNRATE 208 non-null float64
dtypes: float64(1)
unrate.resample('MS') # Resampler オブジェクトを作成
DatetimeIndexResampler [freq=<MonthBegin>, axis=0, closed=left,
label=left, convention=start, base=0]
unrate.asfreq('MS').equals(unrate.resample('MS').asfreq())
True
.resample(): ほかのメソッドを呼ぶときだけデータを返すgdp = pd.read_csv('gdp.csv')gdp.info()
DatetimeIndex: 69 entries, 2000-01-01 to 2017-01-01
Data columns (total 1 columns):
gpd 69 non-null float64 # 頻度情報なし
dtypes: float64(1)
gdp.head(2)
gpd
DATE
2000-01-01 1.2
2000-04-01 7.8
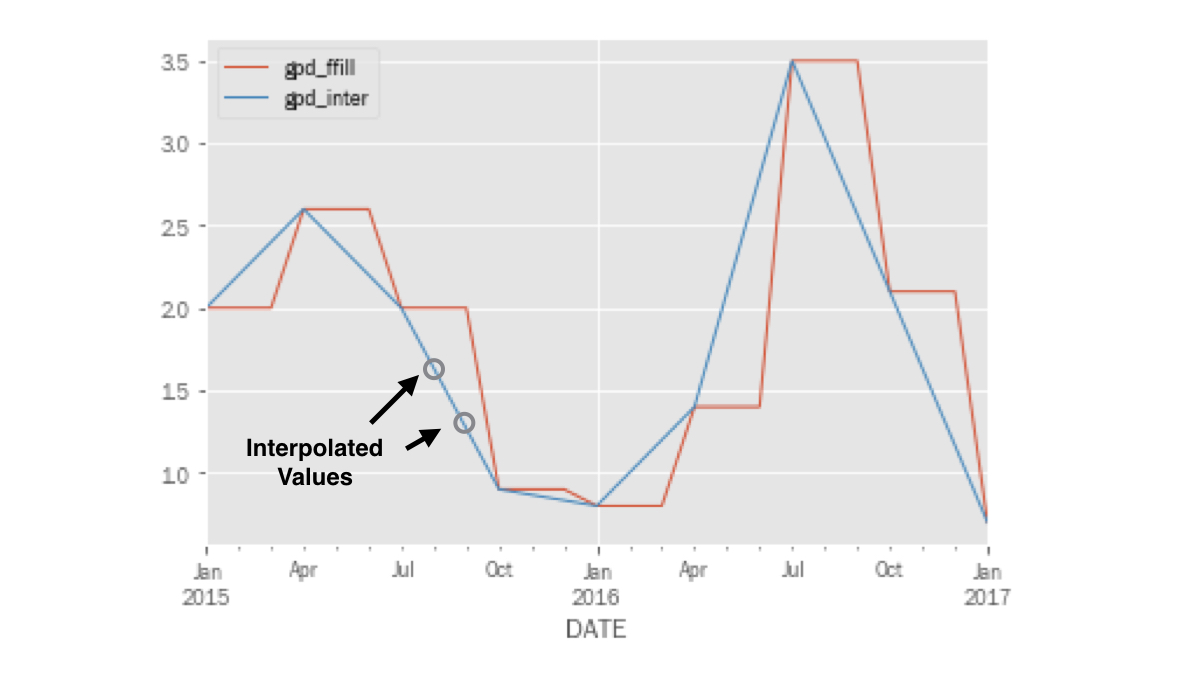
gdp_1 = gdp.resample('MS').ffill().add_suffix('_ffill')
gpd_ffill
DATE
2000-01-01 1.2
2000-02-01 1.2
2000-03-01 1.2
2000-04-01 7.8
gdp_2 = gdp.resample('MS').interpolate().add_suffix('_inter')
gpd_inter
DATE
2000-01-01 1.200000
2000-02-01 3.400000
2000-03-01 5.600000
2000-04-01 7.800000
.interpolate(): 既存点間を直線で補間df1 = pd.DataFrame([1, 2, 3], columns=['df1'])df2 = pd.DataFrame([4, 5, 6], columns=['df2'])pd.concat([df1, df2])
df1 df2
0 1.0 NaN
1 2.0 NaN
2 3.0 NaN
0 NaN 4.0
1 NaN 5.0
2 NaN 6.0
pd.concat([df1, df2], axis=1)
df1 df2
0 1 4
1 2 5
2 3 6
axis=1: 横方向に連結pd.concat([gdp_1, gdp_2], axis=1).loc['2015':].plot()
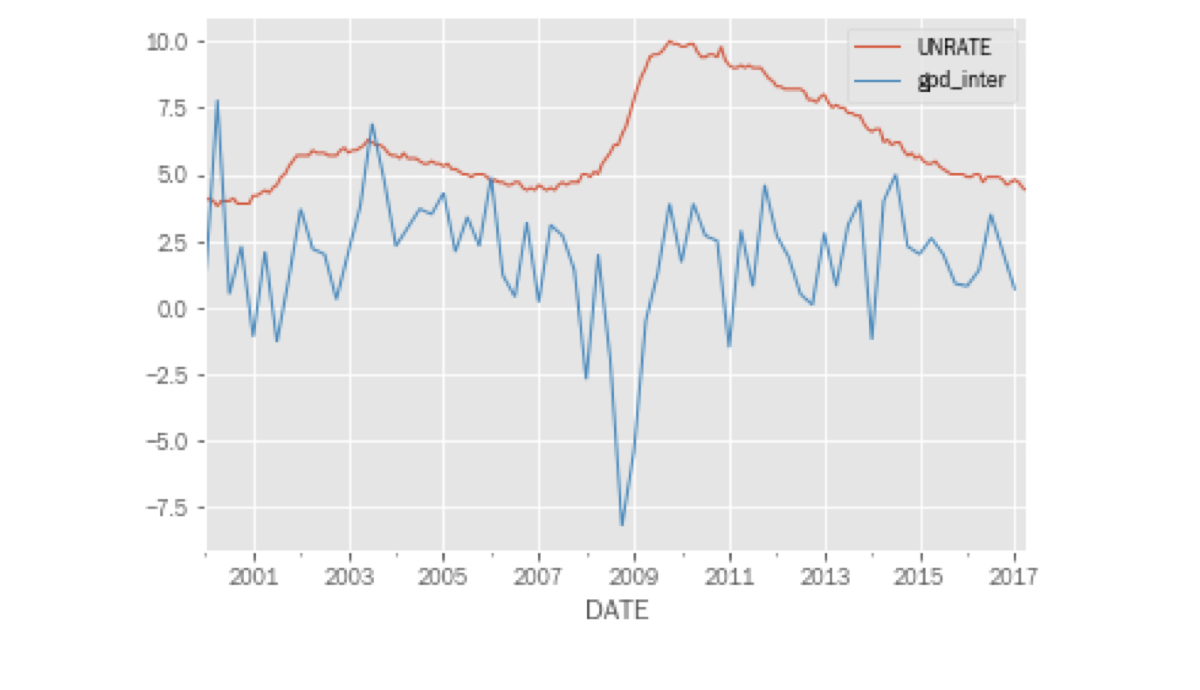
pd.concat([unrate, gdp_inter], axis=1).plot();
Pythonでの時系列データ操作