중급 Python
Hugo Bowne-Anderson
Data Scientist at DataCamp
많은 선택지
다양한 그래프 유형
원하는 대로 맞춤 설정 가능
선택 시 고려 사항
데이터 용량
전달하고 싶은 메시지
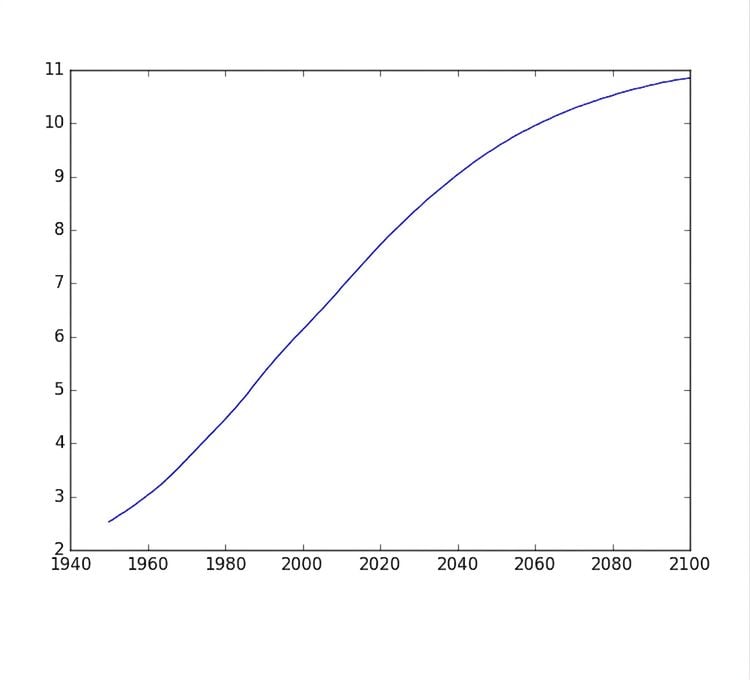
population.py
import matplotlib.pyplot as plt
year = [1950, 1951, 1952, ..., 2100]
pop = [2.538, 2.57, 2.62, ..., 10.85]

plt.plot(year, pop)

plt.show()
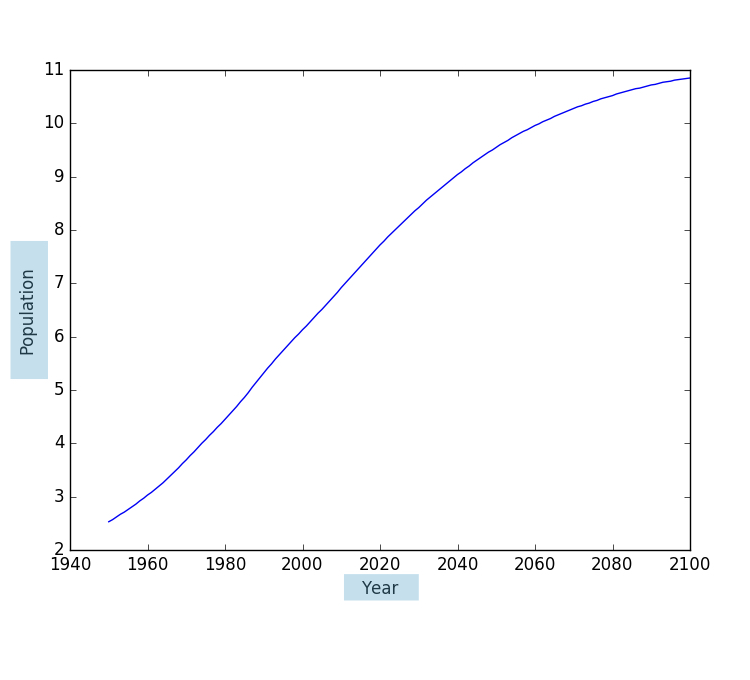
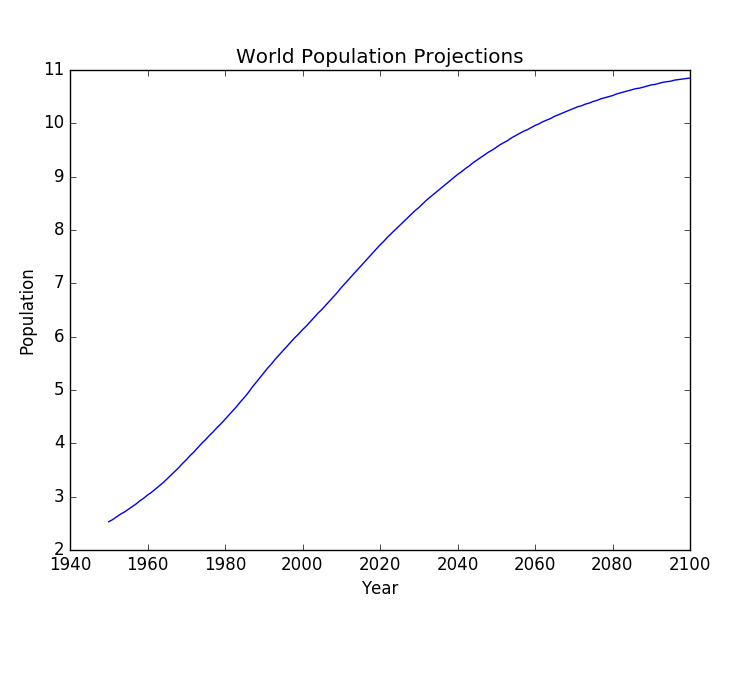
import matplotlib.pyplot as plt
year = [1950, 1951, 1952, ..., 2100]
pop = [2.538, 2.57, 2.62, ..., 10.85]

plt.plot(year, pop)


plt.xlabel('Year')
plt.ylabel('Population')


plt.show()
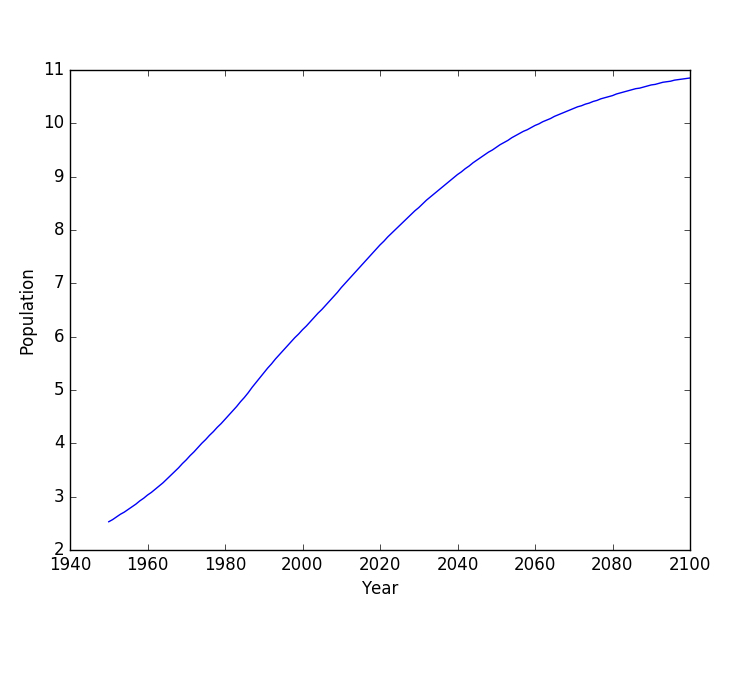
import matplotlib.pyplot as plt
year = [1950, 1951, 1952, ..., 2100]
pop = [2.538, 2.57, 2.62, ..., 10.85]

plt.plot(year, pop)


plt.xlabel('Year')
plt.ylabel('Population')


plt.show()
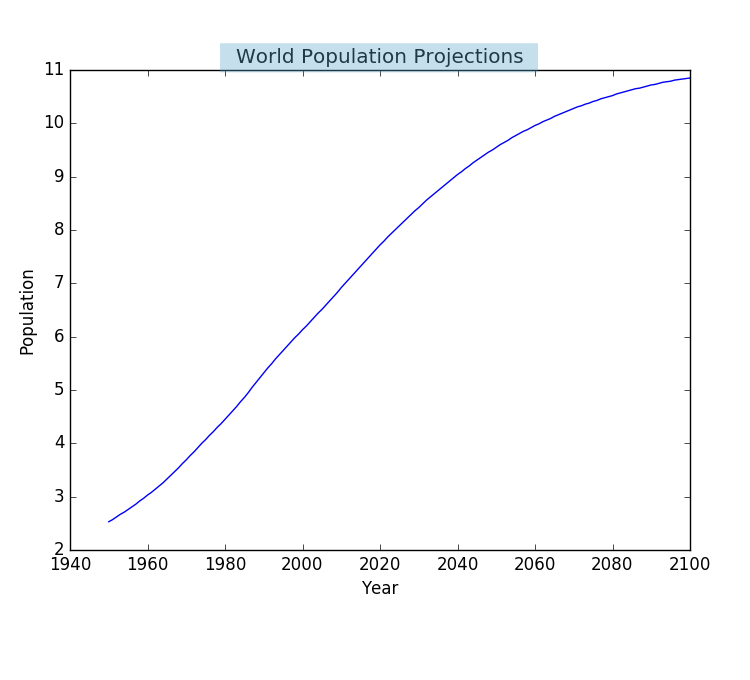
import matplotlib.pyplot as plt
year = [1950, 1951, 1952, ..., 2100]
pop = [2.538, 2.57, 2.62, ..., 10.85]

plt.plot(year, pop)


plt.xlabel('Year')
plt.ylabel('Population')

plt.title('World Population Projections')


plt.show()
plt.title('World Population Projections')
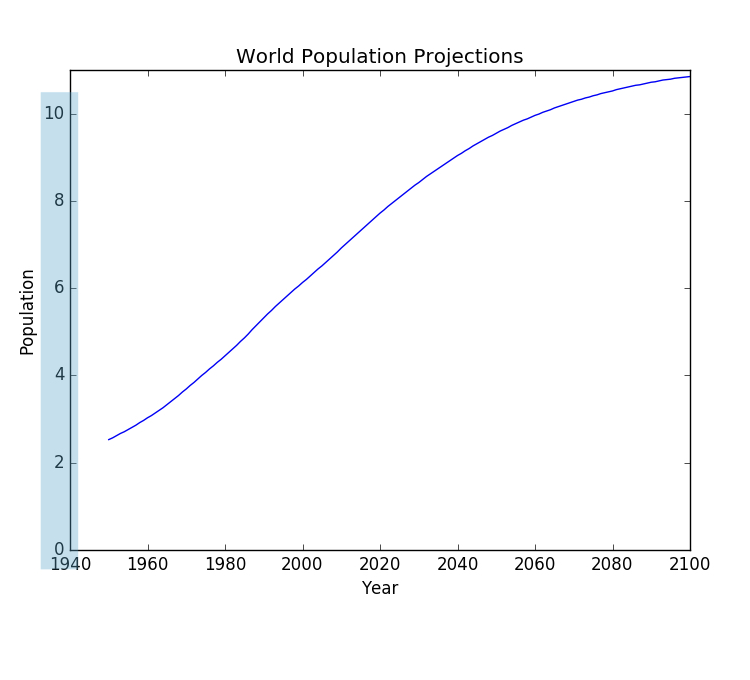
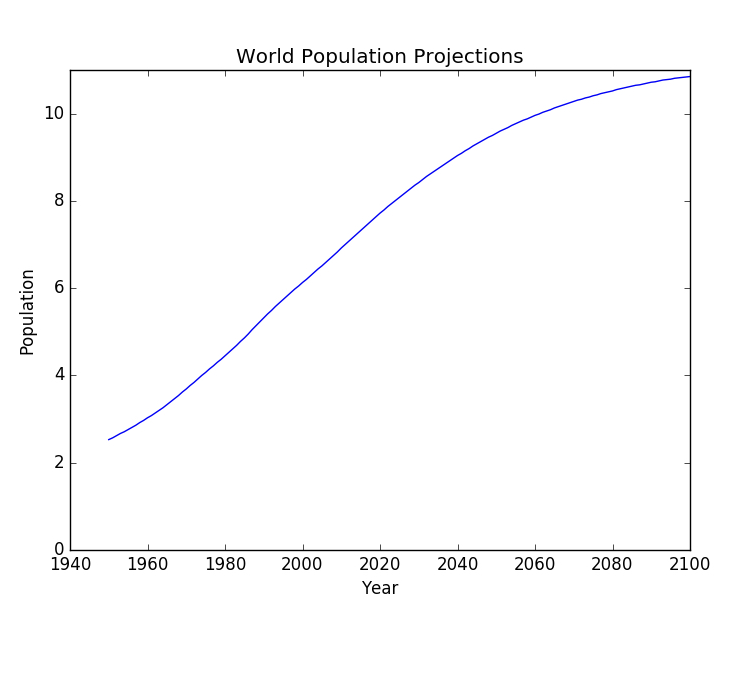
import matplotlib.pyplot as plt
year = [1950, 1951, 1952, ..., 2100]
pop = [2.538, 2.57, 2.62, ..., 10.85]

plt.plot(year, pop)


plt.xlabel('Year')
plt.ylabel('Population')

plt.title('World Population Projections')

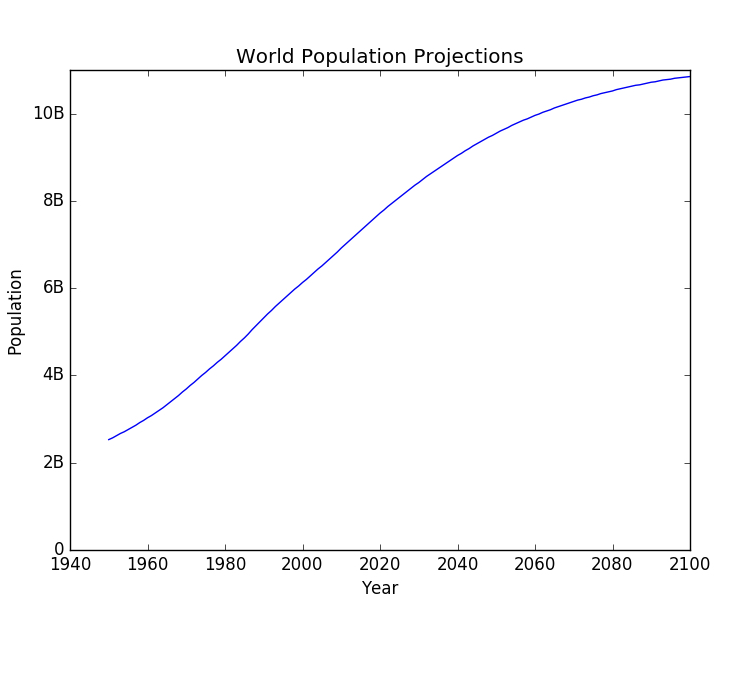
plt.yticks([0, 2, 4, 6, 8, 10])


plt.show()
plt.yticks([0, 2, 4, 6, 8, 10])
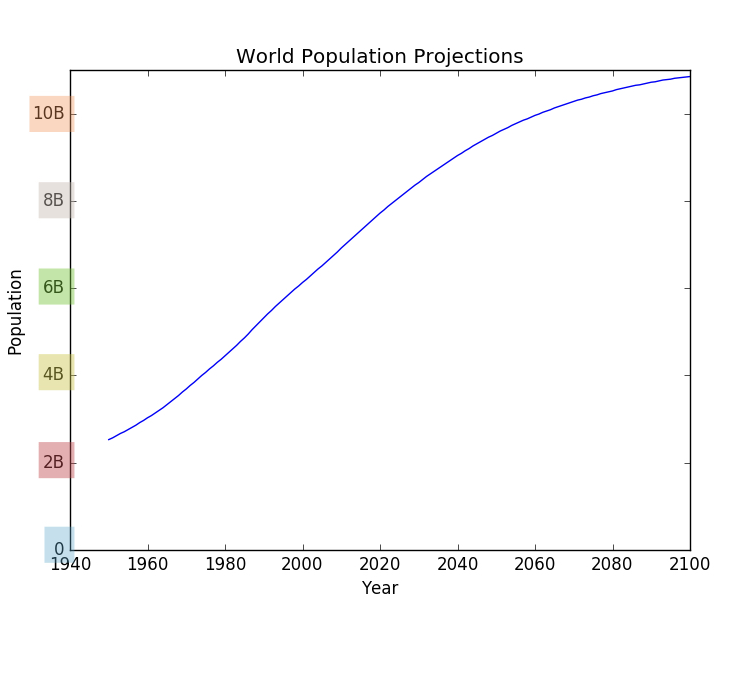
import matplotlib.pyplot as plt
year = [1950, 1951, 1952, ..., 2100]
pop = [2.538, 2.57, 2.62, ..., 10.85]

plt.plot(year, pop)


plt.xlabel('Year')
plt.ylabel('Population')

plt.title('World Population Projections')

plt.yticks([0, 2, 4, 6, 8, 10],

           ['0', '2B', '4B', '6B', '8B', '10B'])


plt.show()
plt.yticks([0, 2, 4, 6, 8, 10],
['0', '2B', '4B', '6B', '8B', '10B'])
import matplotlib.pyplot as plt
year = [1950, 1951, 1952, ..., 2100]
pop = [2.538, 2.57, 2.62, ..., 10.85]


# Add more data
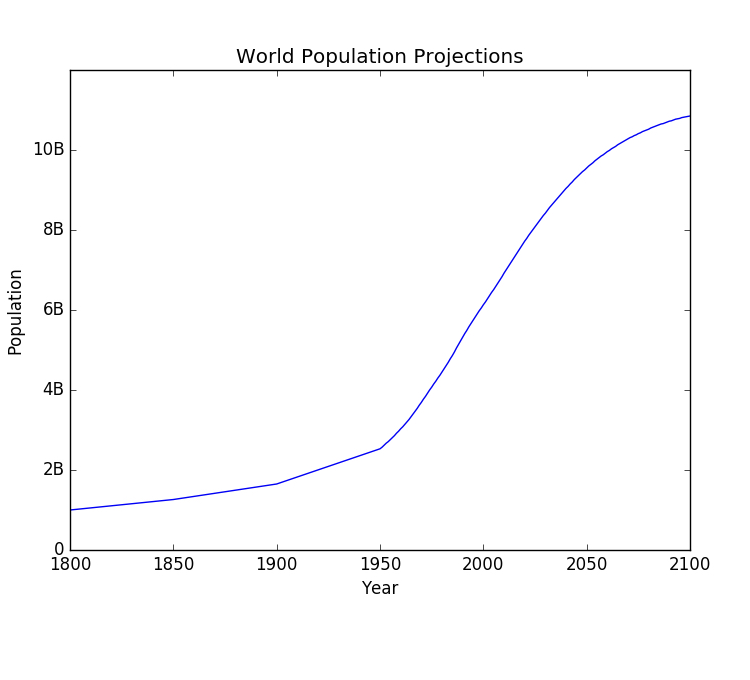
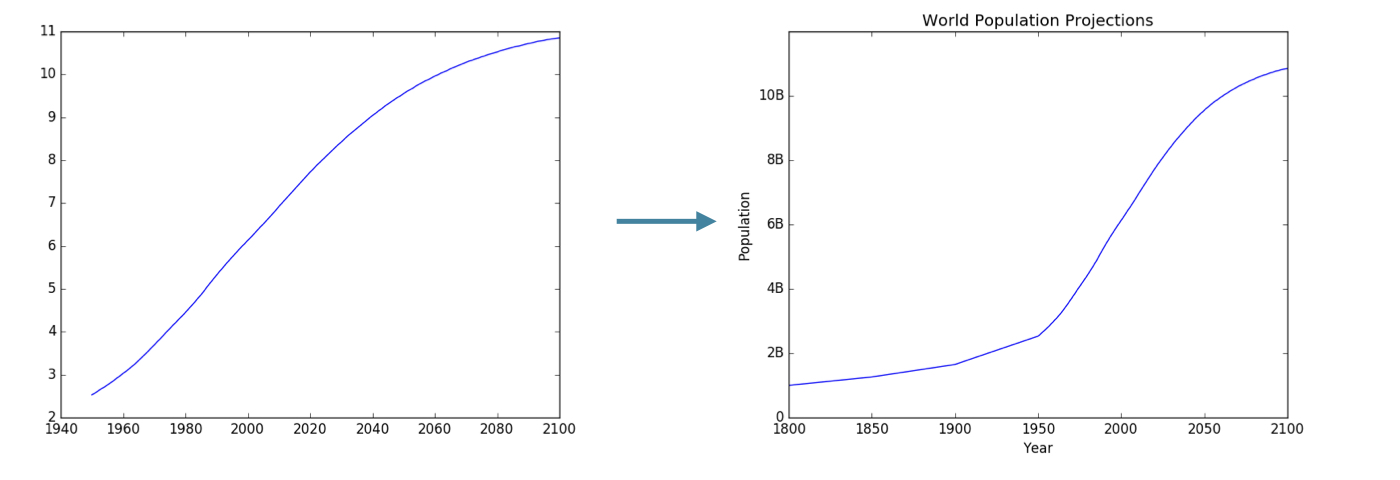
year = [1800, 1850, 1900] + year
pop = [1.0, 1.262, 1.650] + pop


plt.plot(year, pop)


plt.xlabel('Year')
plt.ylabel('Population')

plt.title('World Population Projections')

plt.yticks([0, 2, 4, 6, 8, 10],

           ['0', '2B', '4B', '6B', '8B', '10B'])


plt.show()
import matplotlib.pyplot as plt year = [1950, 1951, 1952, ..., 2100] pop = [2.538, 2.57, 2.62, ..., 10.85]
# Add more data year = [1800, 1850, 1900] + year pop = [1.0, 1.262, 1.650] + pop
plt.plot(year, pop)