scikit-learn으로 배우는 지도 학습
George Boorman
Core Curriculum Manager, DataCamp
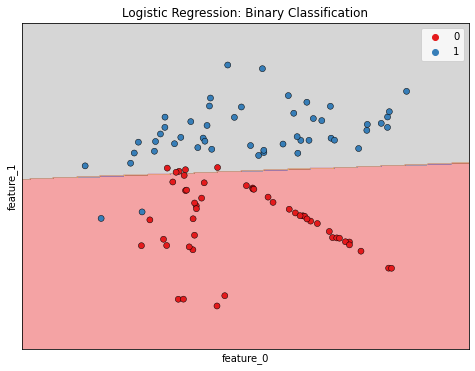
로지스틱 회귀는 분류 문제에 사용됨
로지스틱 회귀는 확률을 출력
확률이 $ \ p>0.5인 경우:
1
확률이 $ \ p<0.5$인 경우:
0
from sklearn.linear_model import LogisticRegression

logreg = LogisticRegression()

X_train, X_test, y_train, y_test = train_test_split(X, y, test_size=0.3,
                                                    random_state=42)

logreg.fit(X_train, y_train)

y_pred = logreg.predict(X_test)
from sklearn.linear_model import LogisticRegression
logreg = LogisticRegression()
X_train, X_test, y_train, y_test = train_test_split(X, y, test_size=0.3, random_state=42)
logreg.fit(X_train, y_train)
y_pred = logreg.predict(X_test)
y_pred_probs = logreg.predict_proba(X_test)[:, 1]

print(y_pred_probs[0])
y_pred_probs = logreg.predict_proba(X_test)[:, 1]
print(y_pred_probs[0])
[0.08961376]
기본 로지스틱 회귀 임계값 = 0.5
로지스틱 회귀에 국한되지 않음
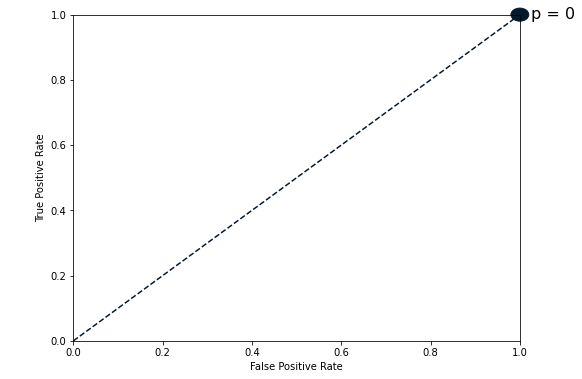
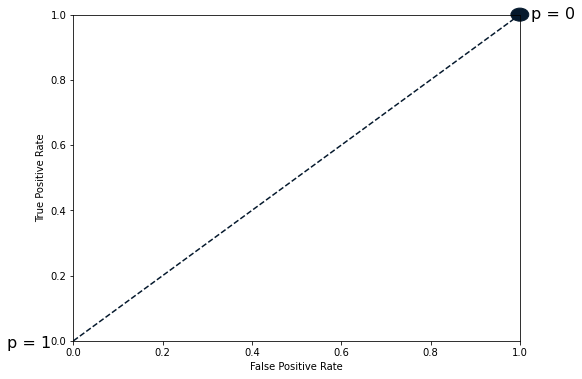
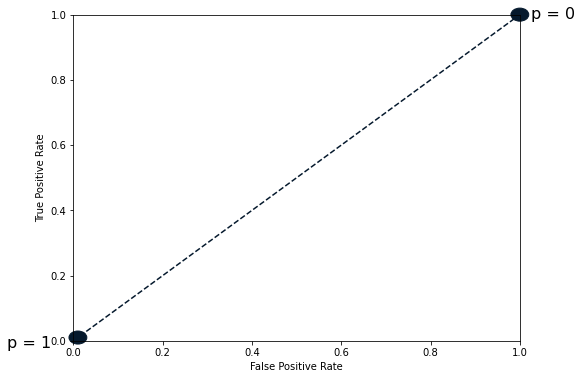
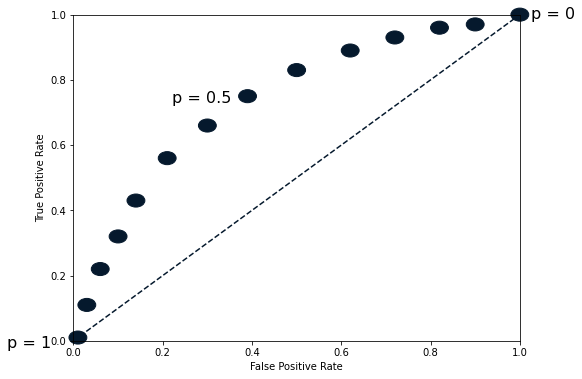
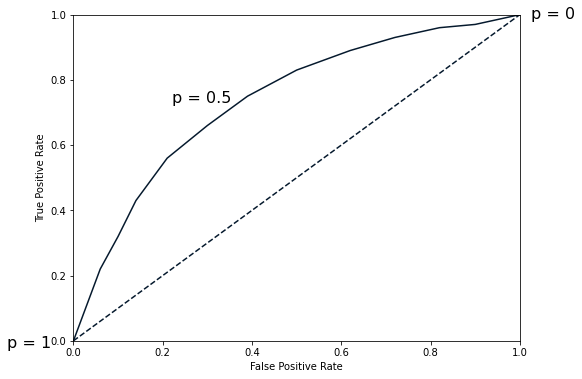
임계값을 바꾸면 어떻게 될까요?
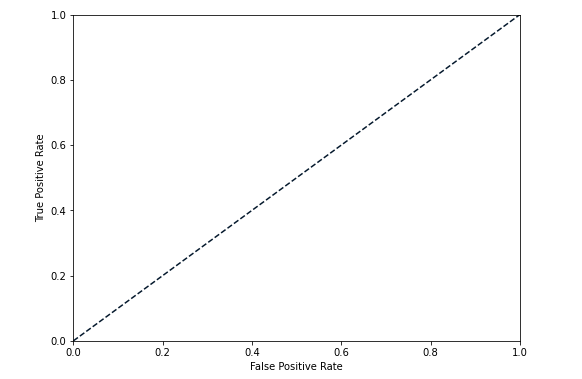
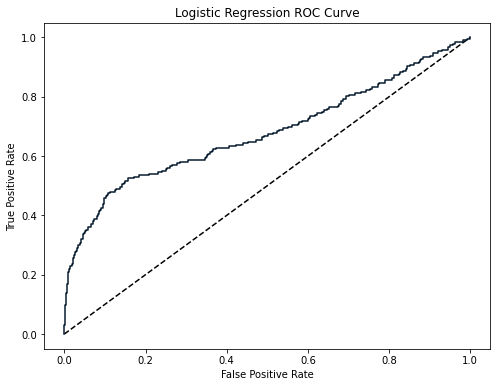
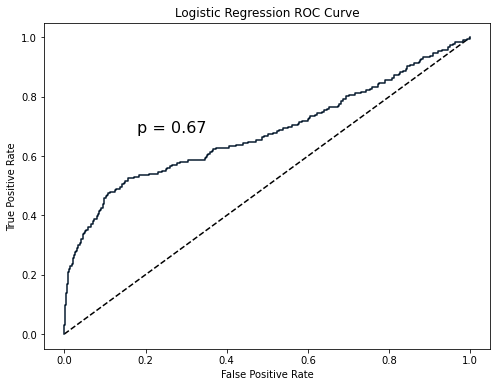
from sklearn.metrics import roc_curve

fpr, tpr, thresholds = roc_curve(y_test, y_pred_probs)

plt.plot([0, 1], [0, 1], 'k--')
plt.plot(fpr, tpr)
plt.xlabel('False Positive Rate')
plt.ylabel('True Positive Rate')
plt.title('Logistic Regression ROC Curve')
plt.show()
from sklearn.metrics import roc_curve
fpr, tpr, thresholds = roc_curve(y_test, y_pred_probs)
plt.plot([0, 1], [0, 1], 'k--') plt.plot(fpr, tpr) plt.xlabel('False Positive Rate') plt.ylabel('True Positive Rate') plt.title('Logistic Regression ROC Curve') plt.show()
from sklearn.metrics import roc_auc_score

print(roc_auc_score(y_test, y_pred_probs))
from sklearn.metrics import roc_auc_score
print(roc_auc_score(y_test, y_pred_probs))
0.6700964152663693