scikit-learn으로 배우는 지도 학습
George Boorman
Core Curriculum Manager, DataCamp
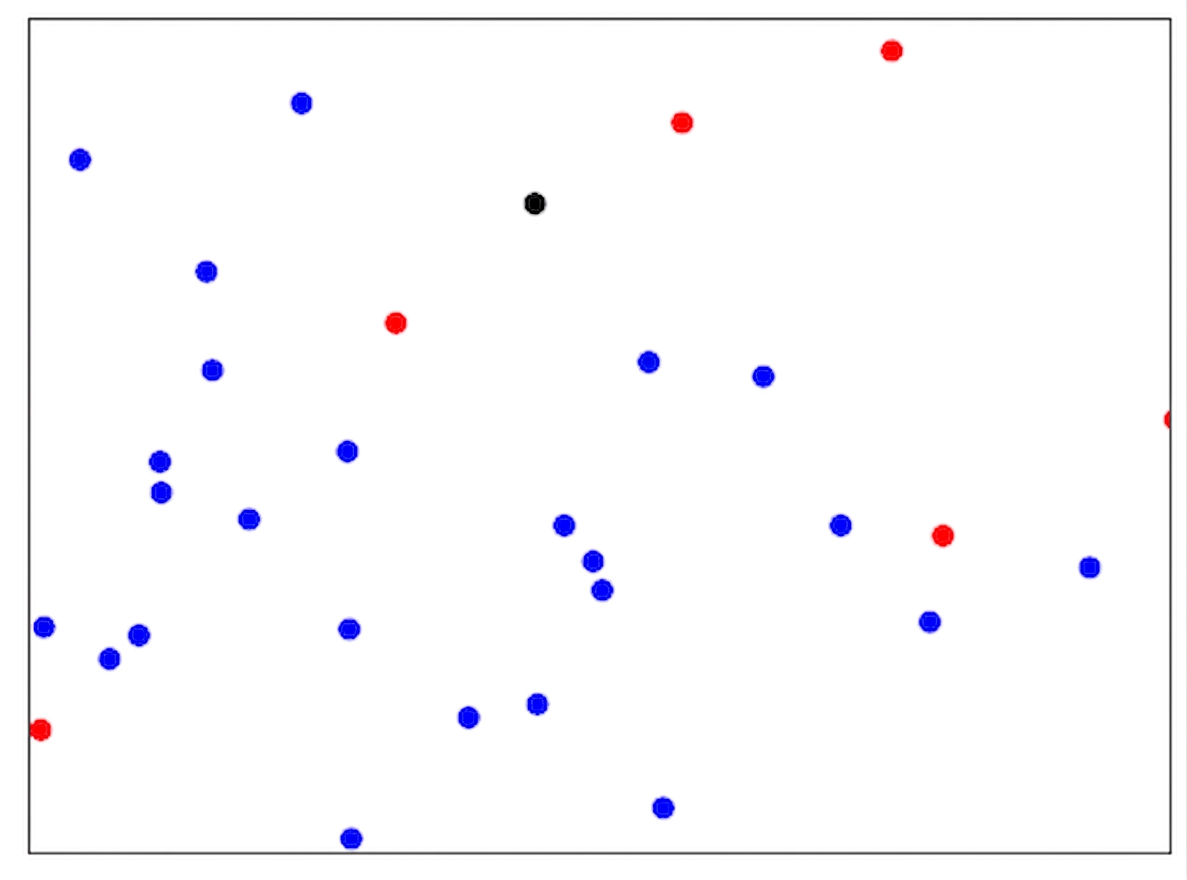
데이터 포인트의 레이블을 예측합니다
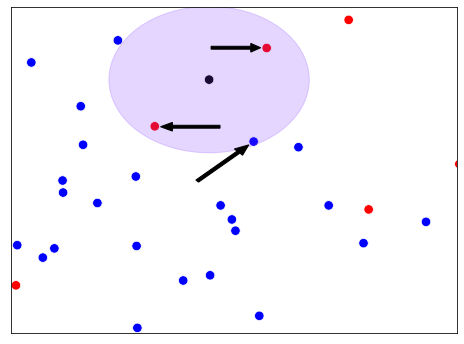
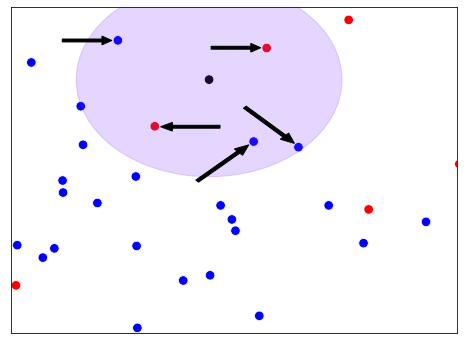
k개의 가장 가까운 레이블이 지정된 데이터 포인트 확인하기
k
다수결 투표 적용
from sklearn.neighbors import KNeighborsClassifier

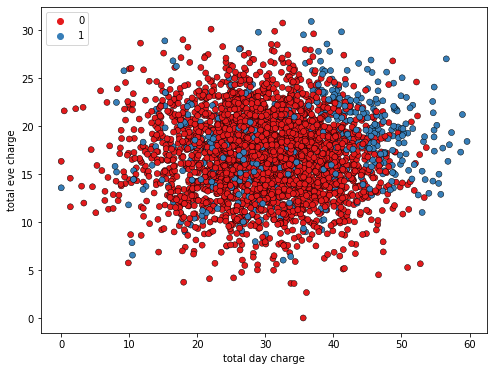
X = churn_df[["total_day_charge", "total_eve_charge"]].values
y = churn_df["churn"].values

print(X.shape, y.shape)
from sklearn.neighbors import KNeighborsClassifier
X = churn_df[["total_day_charge", "total_eve_charge"]].values y = churn_df["churn"].values
print(X.shape, y.shape)
(3333, 2), (3333,)
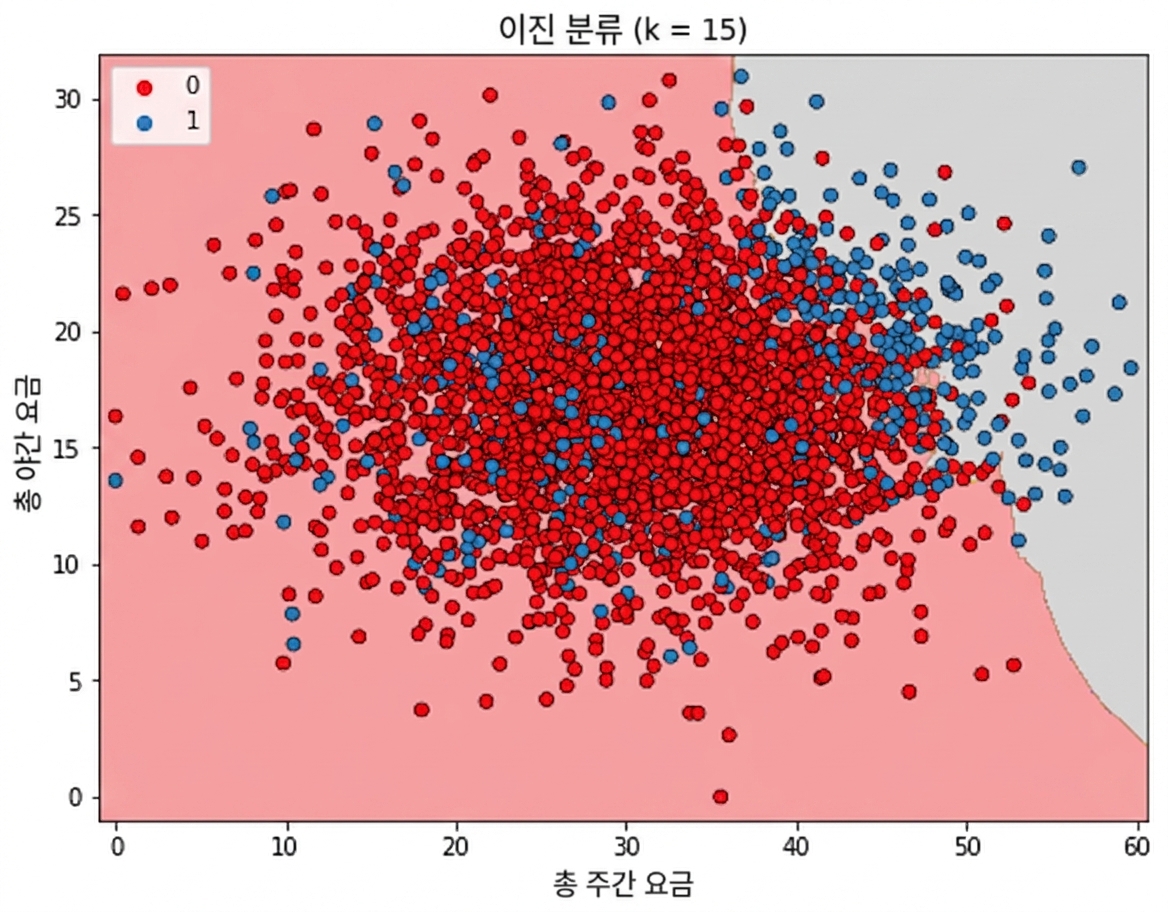
knn = KNeighborsClassifier(n_neighbors=15)

knn.fit(X, y)
knn = KNeighborsClassifier(n_neighbors=15)
knn.fit(X, y)
X_new = np.array([[56.8, 17.5],
                  [24.4, 24.1],
                  [50.1, 10.9]])

print(X_new.shape)
X_new = np.array([[56.8, 17.5], [24.4, 24.1], [50.1, 10.9]])
print(X_new.shape)
(3, 2)
predictions = knn.predict(X_new)

print('Predictions: {}'.format(predictions))
predictions = knn.predict(X_new)
print('Predictions: {}'.format(predictions))
Predictions: [1 0 0]