상관관계

Python으로 하는 탐색적 데이터 분석

Izzy Weber

Curriculum Manager, DataCamp

상관관계

  • 두 변수 간 관계의 방향과 강도를 설명합니다
  • 수치형이 아닌 열로 인한 오류를 방지하려면 numeric_only=True를 설정하세요
divorce.corr(numeric_only=True)

                    income_man  income_woman  marriage_duration  num_kids  marriage_year 
 income_man         1.000       0.318         0.085              0.041     0.019         
 income_woman       0.318       1.000         0.079              -0.018    0.026         
 marriage_duration  0.085       0.079         1.000              0.447     -0.812        
 num_kids           0.041       -0.018        0.447              1.000     -0.461        
 marriage_year      0.019       0.026         -0.812             -0.461    1.000

피어슨 상관계수를 계산합니다

Python으로 하는 탐색적 데이터 분석

상관관계 히트맵

sns.heatmap(divorce.corr(numeric_only=True), annot=True)
plt.show()
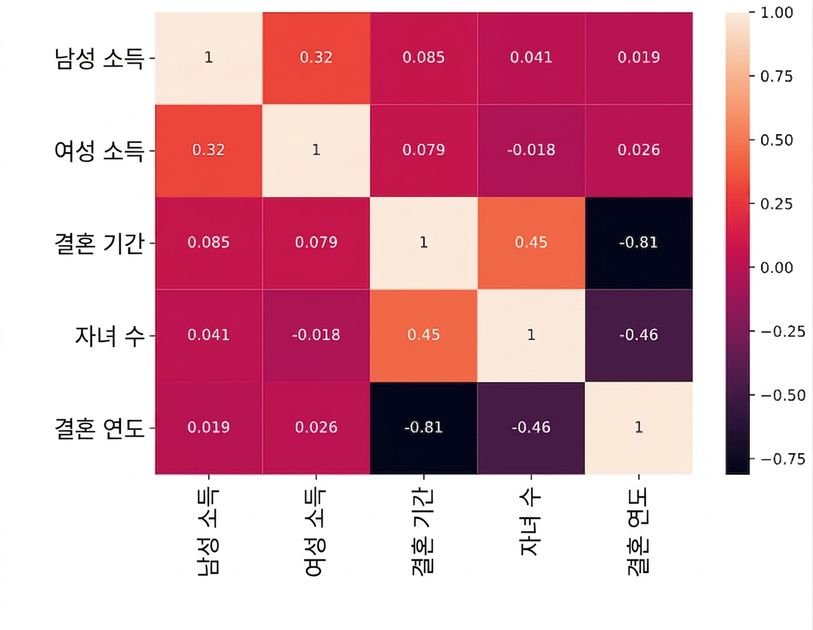
A heatmap of divorce correlations

Python으로 하는 탐색적 데이터 분석

맥락 속의 상관관계

divorce["divorce_date"].min()
Timestamp('2000-01-08 00:00:00')
divorce["divorce_date"].max()
Timestamp('2015-11-03 00:00:00')
Python으로 하는 탐색적 데이터 분석

관계 시각화하기

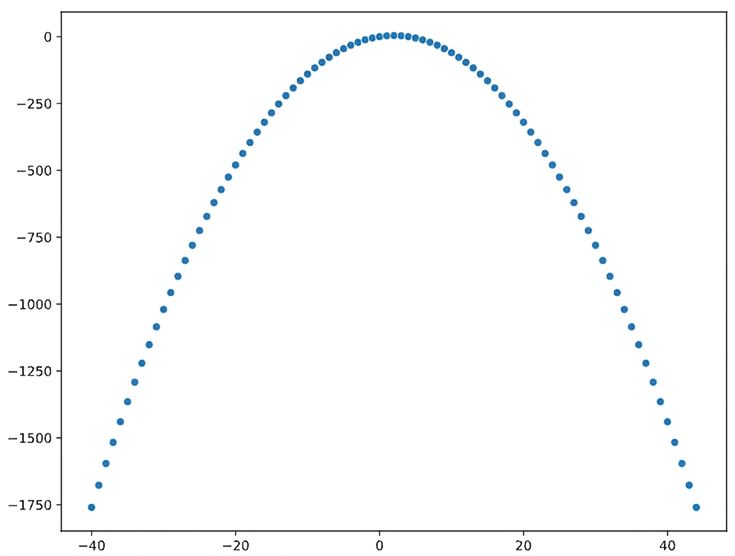
A strong relationship with a low linear correlation coefficient

  • 강한 관계이지만 선형은 아님 피어슨 상관계수: -6.48e-18

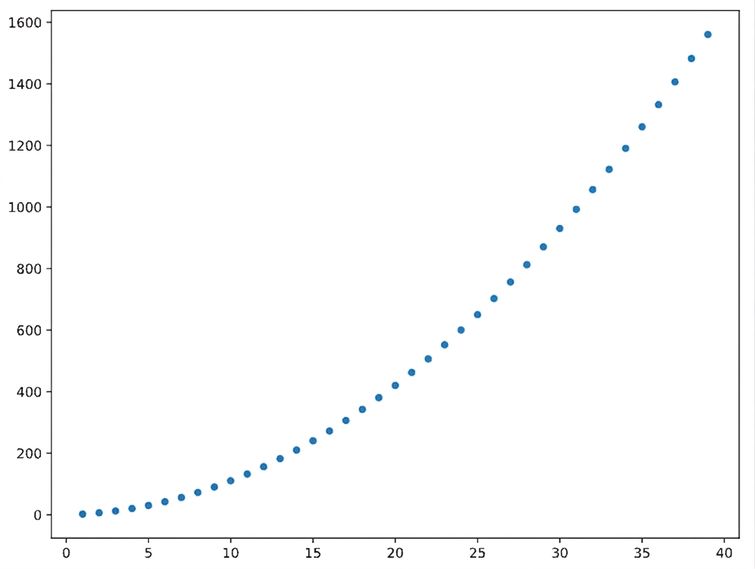
A quadratic relationship with a high linear correlation coefficient

  • 이차 관계이지만 선형은 아님
Python으로 하는 탐색적 데이터 분석

산포도 그래프

sns.scatterplot(data=divorce, x="income_man", y="income_woman")
plt.show()
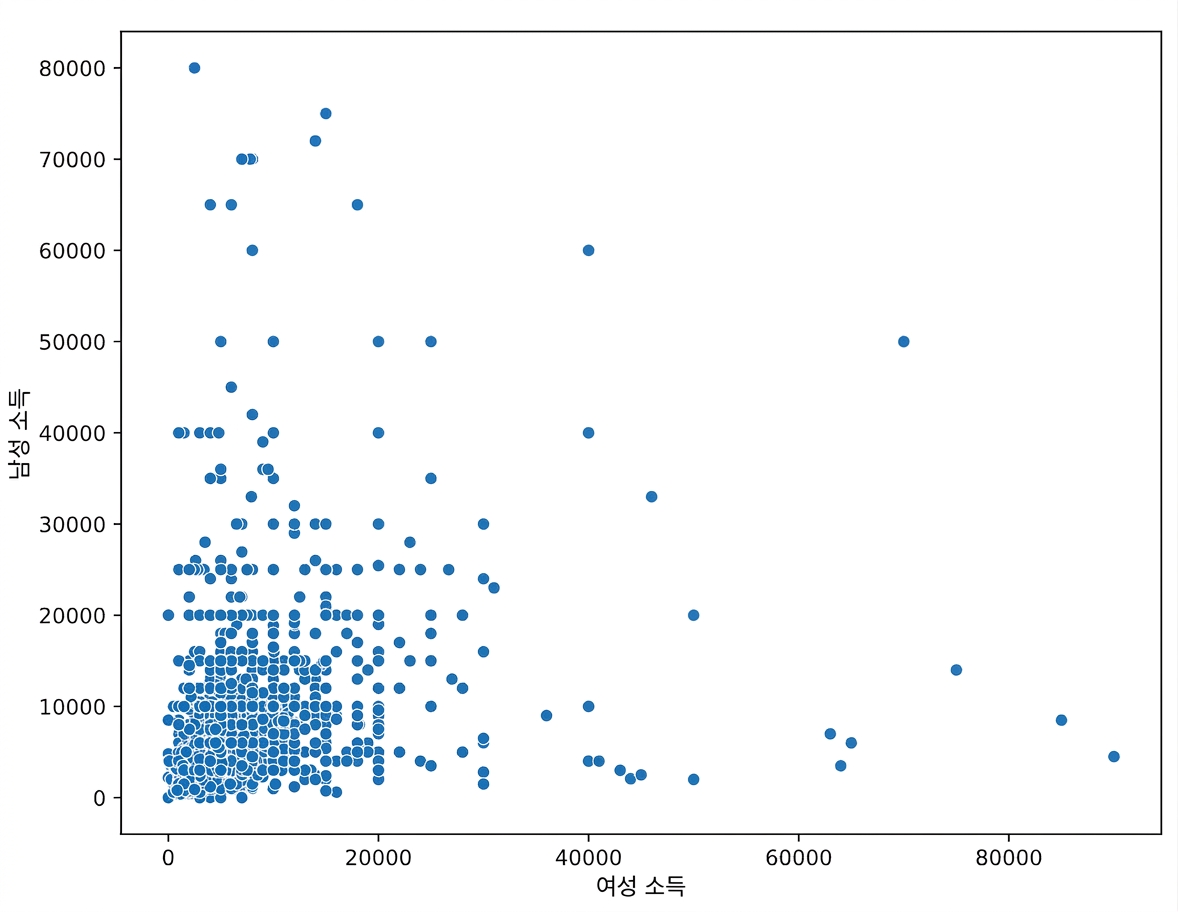
a scatterplot of mens and womens income at time of divorce

Python으로 하는 탐색적 데이터 분석

페어플롯

sns.pairplot(data=divorce)
plt.show()
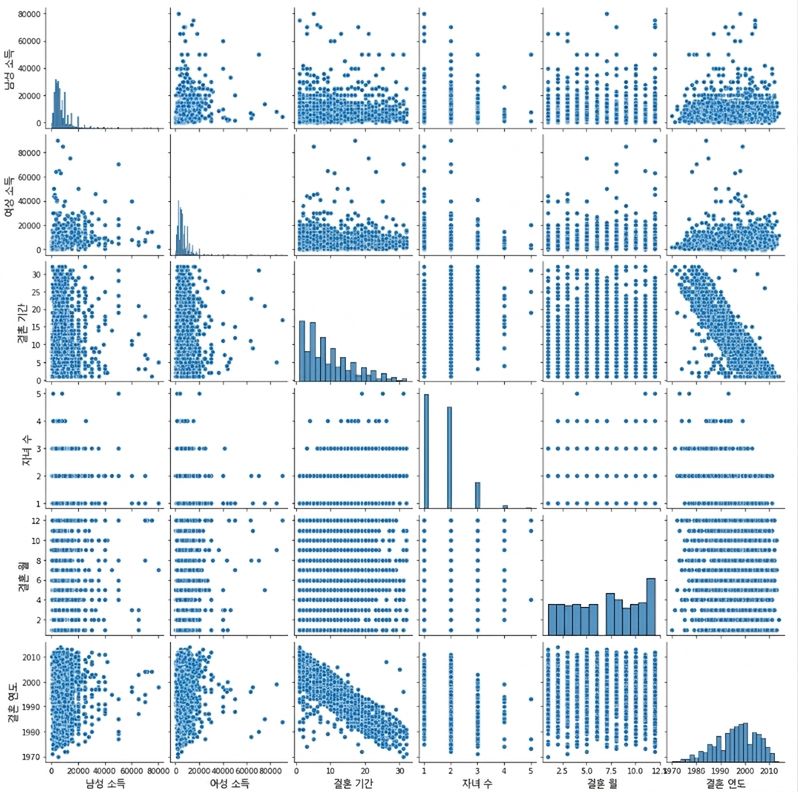
A pairplot of all numeric columns in the divorce dataframe

Python으로 하는 탐색적 데이터 분석

페어플롯

sns.pairplot(data=divorce, vars=["income_man", "income_woman", "marriage_duration"])
plt.show()
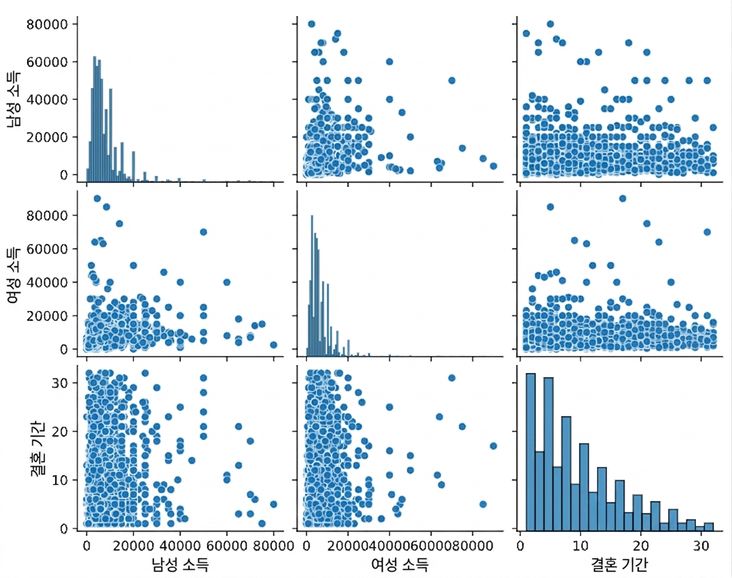
a pairplot of partner incomes and marriage duration

Python으로 하는 탐색적 데이터 분석

연습해 봅시다!

Python으로 하는 탐색적 데이터 분석

Preparing Video For Download...