시간에 따른 패턴

Python으로 하는 탐색적 데이터 분석

Izzy Weber

Curriculum Manager, DataCamp

시간에 따른 패턴

divorce = pd.read_csv("divorce.csv")
divorce.head()
  marriage_date  marriage_duration
0    2000-06-26                5.0
1    2000-02-02                2.0
2    1991-10-09                10.0
3    1993-01-02                10.0
4    1998-12-11                7.0               
Python으로 하는 탐색적 데이터 분석

DateTime 데이터 불러오기

  • DateTime 데이터는 Pandas에 명시적으로 지정해야 합니다
divorce.dtypes
marriage_date         object
marriage_duration    float64
dtype: object
Python으로 하는 탐색적 데이터 분석

DateTime 데이터 불러오기

divorce = pd.read_csv("divorce.csv", parse_dates=["marriage_date"])
divorce.dtypes
marriage_date        datetime64[ns]
marriage_duration           float64
dtype: object
Python으로 하는 탐색적 데이터 분석

DateTime 데이터로 변환하기

  • pd.to_datetime()은 인수를 DateTime 데이터로 변환합니다
divorce["marriage_date"] = pd.to_datetime(divorce["marriage_date"])
divorce.dtypes
marriage_date        datetime64[ns]
marriage_duration           float64
dtype: object
Python으로 하는 탐색적 데이터 분석

DateTime 데이터 생성하기

divorce.head(2)
   month  day  year  marriage_duration 
0      6   26  2000                5.0 
1      2    2  2000                2.0
divorce["marriage_date"] = pd.to_datetime(divorce[["month", "day", "year"]])
divorce.head(2)
    month  day  year  marriage_duration  marriage_date 

 0      6   26  2000                5.0     2000-06-26 
 1      2    2  2000                2.0     2000-02-02
Python으로 하는 탐색적 데이터 분석

DateTime 데이터 생성하기

  • 전체 날짜에서 일부를 dt.month, dt.day, dt.year 속성을 사용해 추출합니다
divorce["marriage_month"] = divorce["marriage_date"].dt.month
divorce.head()
    marriage_date  marriage_duration  marriage_month 
 0     2000-06-26                5.0               6 
 1     2000-02-02                2.0               2 
 2     1991-10-09               10.0              10 
 3     1993-01-02               10.0               1 
 4     1998-12-11                7.0              12
Python으로 하는 탐색적 데이터 분석

시간에 따른 패턴 시각화

sns.lineplot(data=divorce, x="marriage_month", y="marriage_duration")
plt.show()
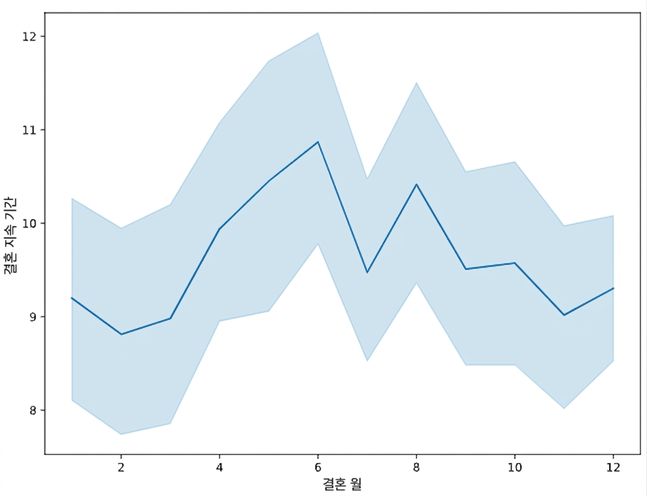
A line plot showing the relationship between month of marriage and marriage duration

Python으로 하는 탐색적 데이터 분석

연습해 봅시다!

Python으로 하는 탐색적 데이터 분석

Preparing Video For Download...