초기 탐색

Python으로 하는 탐색적 데이터 분석

Izzy Weber

Curriculum Manager, DataCamp

탐색적 데이터 분석

데이터를 검토하고 정제하여...

  • 인사이트 도출
  • 가설 생성하기

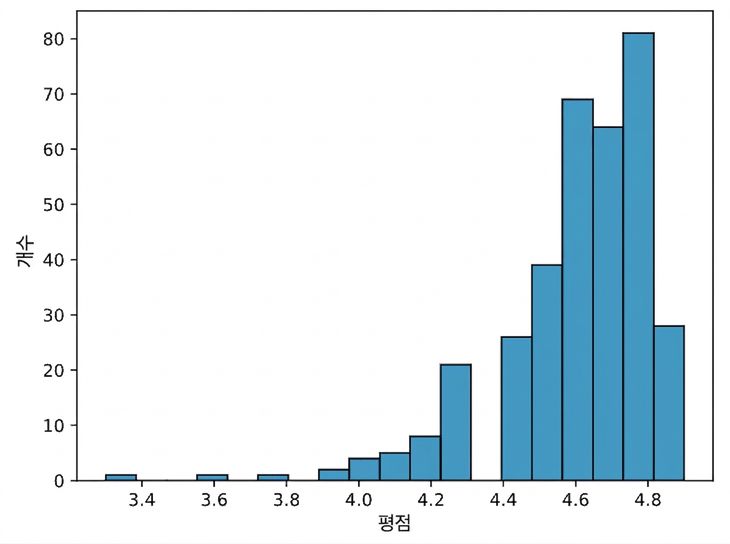
a histogram of book ratings

Python으로 하는 탐색적 데이터 분석

.head()로 처음 살펴보기

books = pd.read_csv("books.csv")

books.head()
|                          name |                   author |  rating | year |       genre |
|-------------------------------|--------------------------|---------|------|-------------|
| 10-Day Green Smoothie Cleanse |                 JJ Smith |    4.73 | 2016 | Non Fiction |
|             11/22/63: A Novel |             Stephen King |    4.62 | 2011 |     Fiction |
|             12 Rules for Life |       Jordan B. Peterson |    4.69 | 2018 | Non Fiction |
|        1984 (Signet Classics) |            George Orwell |    4.73 | 2017 |     Fiction |
|          5,000 Awesome Facts  | National Geographic Kids |    4.81 | 2019 |   Childrens |
Python으로 하는 탐색적 데이터 분석

더 많은 .info() 수집하기

books.info()
<class 'pandas.core.frame.DataFrame'>
RangeIndex: 350 entries, 0 to 349
Data columns (total 5 columns):
 #   Column  Non-Null Count  Dtype  
--   ------  --------------  -----  
 0   name    350 non-null    object 
 1   author  350 non-null    object 
 2   rating  350 non-null    float64
 3   year    350 non-null    int64  
 4   genre   350 non-null    object 
dtypes: float64(1), int64(1), object(3)
memory usage: 13.8+ KB
Python으로 하는 탐색적 데이터 분석

범주형 열 자세히 살펴보기

books.value_counts("genre")
genre
Non Fiction    179
Fiction        131
Childrens       40
dtype: int64
Python으로 하는 탐색적 데이터 분석

.describe() 수치형 열

books.describe()
         rating        year
count    350.000000  350.000000
mean     4.608571    2013.508571
std      0.226941    3.284711
min      3.300000    2009.000000
25%      4.500000    2010.000000
50%      4.600000    2013.000000
75%      4.800000    2016.000000
max      4.900000    2019.000000
Python으로 하는 탐색적 데이터 분석

수치형 데이터 시각화

import seaborn as sns
import matplotlib.pyplot as plt

sns.histplot(data=books, x="rating") plt.show()

a histogram of book ratings

Python으로 하는 탐색적 데이터 분석

구간 너비 조정하기

sns.histplot(data=books, x="rating", binwidth=.1)
plt.show()
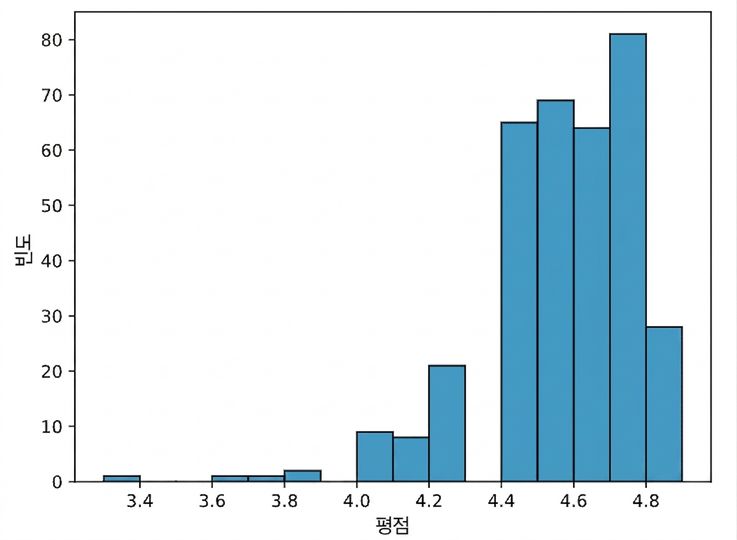
a histogram of book ratings

Python으로 하는 탐색적 데이터 분석

연습해 봅시다!

Python으로 하는 탐색적 데이터 분석

Preparing Video For Download...