이상치 처리하기

Python으로 하는 탐색적 데이터 분석

George Boorman

Curriculum Manager, DataCamp

이상치란?

  • 다른 데이터 포인트들에서 멀리 떨어진 관측값
    • 중위 주택 가격: $400,000
    • 이상치 주택 가격: $5,000,000
  • 값이 다른 이유를 고려해야 함:
    • 위치, 침실 수, 면적 등

Large house with a swimming pool

1 이미지 출처: https://unsplash.com/@pixeldan
Python으로 하는 탐색적 데이터 분석

## 기술 통계 활용하기

print(salaries["Salary_USD"].describe())
count       518.000
mean     104905.826
std       62660.107
min        3819.000
25%       61191.000
50%       95483.000
75%      137496.000
max      429675.000
Name: Salary_USD, dtype: float64
Python으로 하는 탐색적 데이터 분석

사분위 범위 활용하기

사분위수 범위(IQR)

  • IQR = 75번째 - 25번째 백분위수
Python으로 하는 탐색적 데이터 분석

상자 그래프에서의 IQR

sns.boxplot(data=salaries,
            y="Salary_USD")
plt.show()
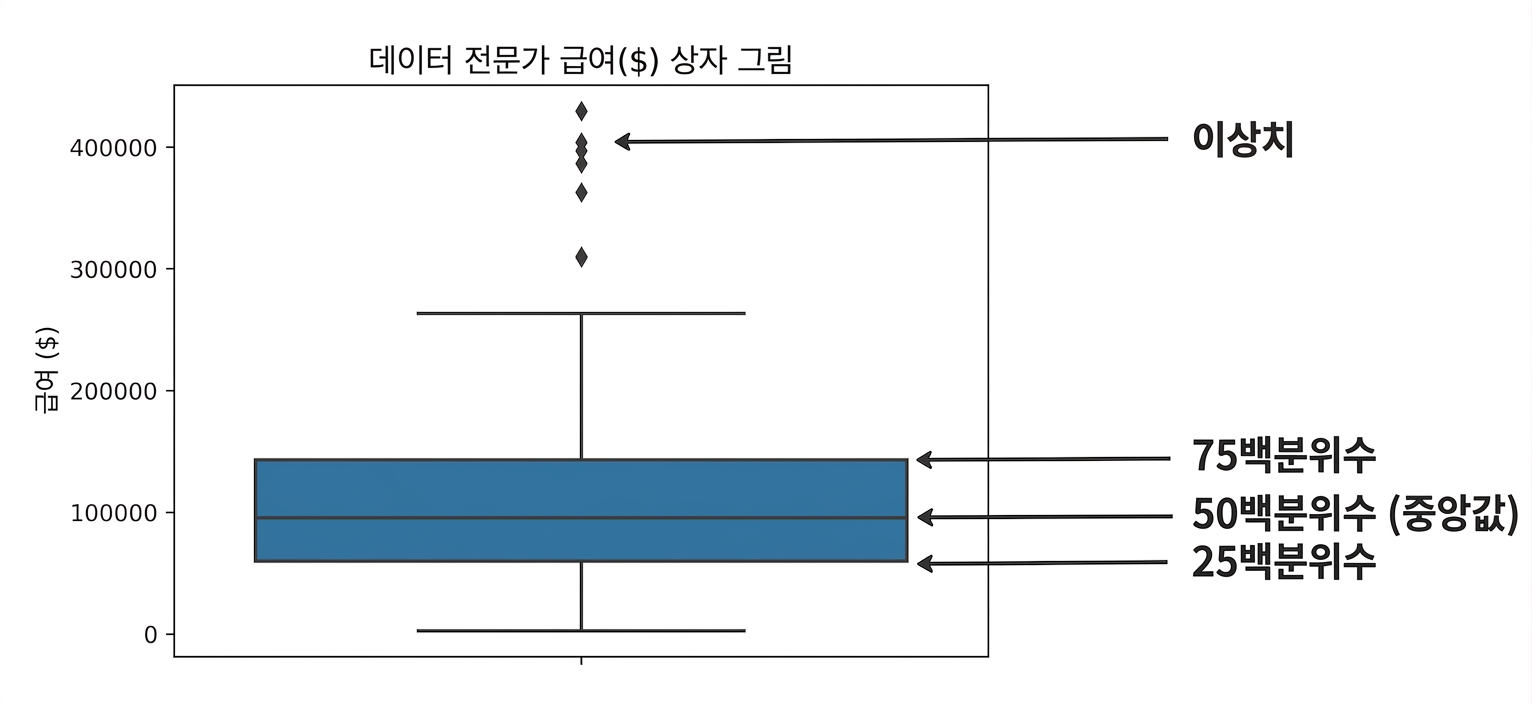
Box plot of salaries for data professionals, showing the 25th percentile at the bottom of the box, the 50th percentile as the middle line, the 75th percentile at the top of the box, and outliers as diamonds outside of the box

Python으로 하는 탐색적 데이터 분석

사분위 범위 활용하기

사분위수 범위(IQR)

  • IQR = 75번째 - 25번째 백분위수
  • 상위 이상치> 75백분위수 + (1.5 * IQR)
  • 하위 이상치 < 25백분위수 - (1.5 * IQR)
Python으로 하는 탐색적 데이터 분석

임계값 파악하기

# 75th percentile
seventy_fifth = salaries["Salary_USD"].quantile(0.75)

# 25th percentile twenty_fifth = salaries["Salary_USD"].quantile(0.25)
# Interquartile range salaries_iqr = seventy_fifth - twenty_fifth
print(salaries_iqr)
76305.0
Python으로 하는 탐색적 데이터 분석

이상치 식별하기

# Upper threshold
upper = seventy_fifth + (1.5 * salaries_iqr)

# Lower threshold lower = twenty_fifth - (1.5 * salaries_iqr)
print(upper, lower)
251953.5 -53266.5
Python으로 하는 탐색적 데이터 분석

데이터 부분집합 만들기

salaries[(salaries["Salary_USD"] < lower) | (salaries["Salary_USD"] > upper)] \

[["Experience", "Employee_Location", "Salary_USD"]]
        Experience    Employee_Location    Salary_USD
29      Mid           US                   429675.0
67      Mid           US                   257805.0
80      Senior        US                   263534.0
83      Mid           US                   429675.0
133     Mid           US                   403895.0
410     Executive     US                   309366.0
441     Senior        US                   362837.0
445     Senior        US                   386708.0
454     Senior        US                   254368.0
Python으로 하는 탐색적 데이터 분석

왜 이상치를 찾을까요?

  • 이상치는 극단적인 값입니다

    • 데이터 특성을 정확하게 반영하지 않을 수 있습니다
  • 평균과 표준 편차를 왜곡할 수 있습니다

  • 통계적 검정과 머신 러닝 모델은 정규 분포된 데이터가 필요합니다

Python으로 하는 탐색적 데이터 분석

이상치는 어떻게 처리할까요?

질문하기:

  • 이러한 이상치는 왜 존재할까요?
    • 더 고위 직책 / 국가별로 더 높은 급여 지급
    • 데이터세트에 남겨두는 것을 고려하세요
  • 데이터가 정확한가요?
    • 데이터 수집에 오류가 있었을까요?
      • 그렇다면, 제거하세요
Python으로 하는 탐색적 데이터 분석

이상치 제거하기

no_outliers = salaries[(salaries["Salary_USD"] > lower) & (salaries["Salary_USD"] < upper)]
print(no_outliers["Salary_USD"].describe())
count       509.000000
mean     100674.567780
std       53643.050057
min        3819.000000
25%       60928.000000
50%       95483.000000
75%      134059.000000
max      248257.000000
Name: Salary_USD, dtype: float64
Python으로 하는 탐색적 데이터 분석

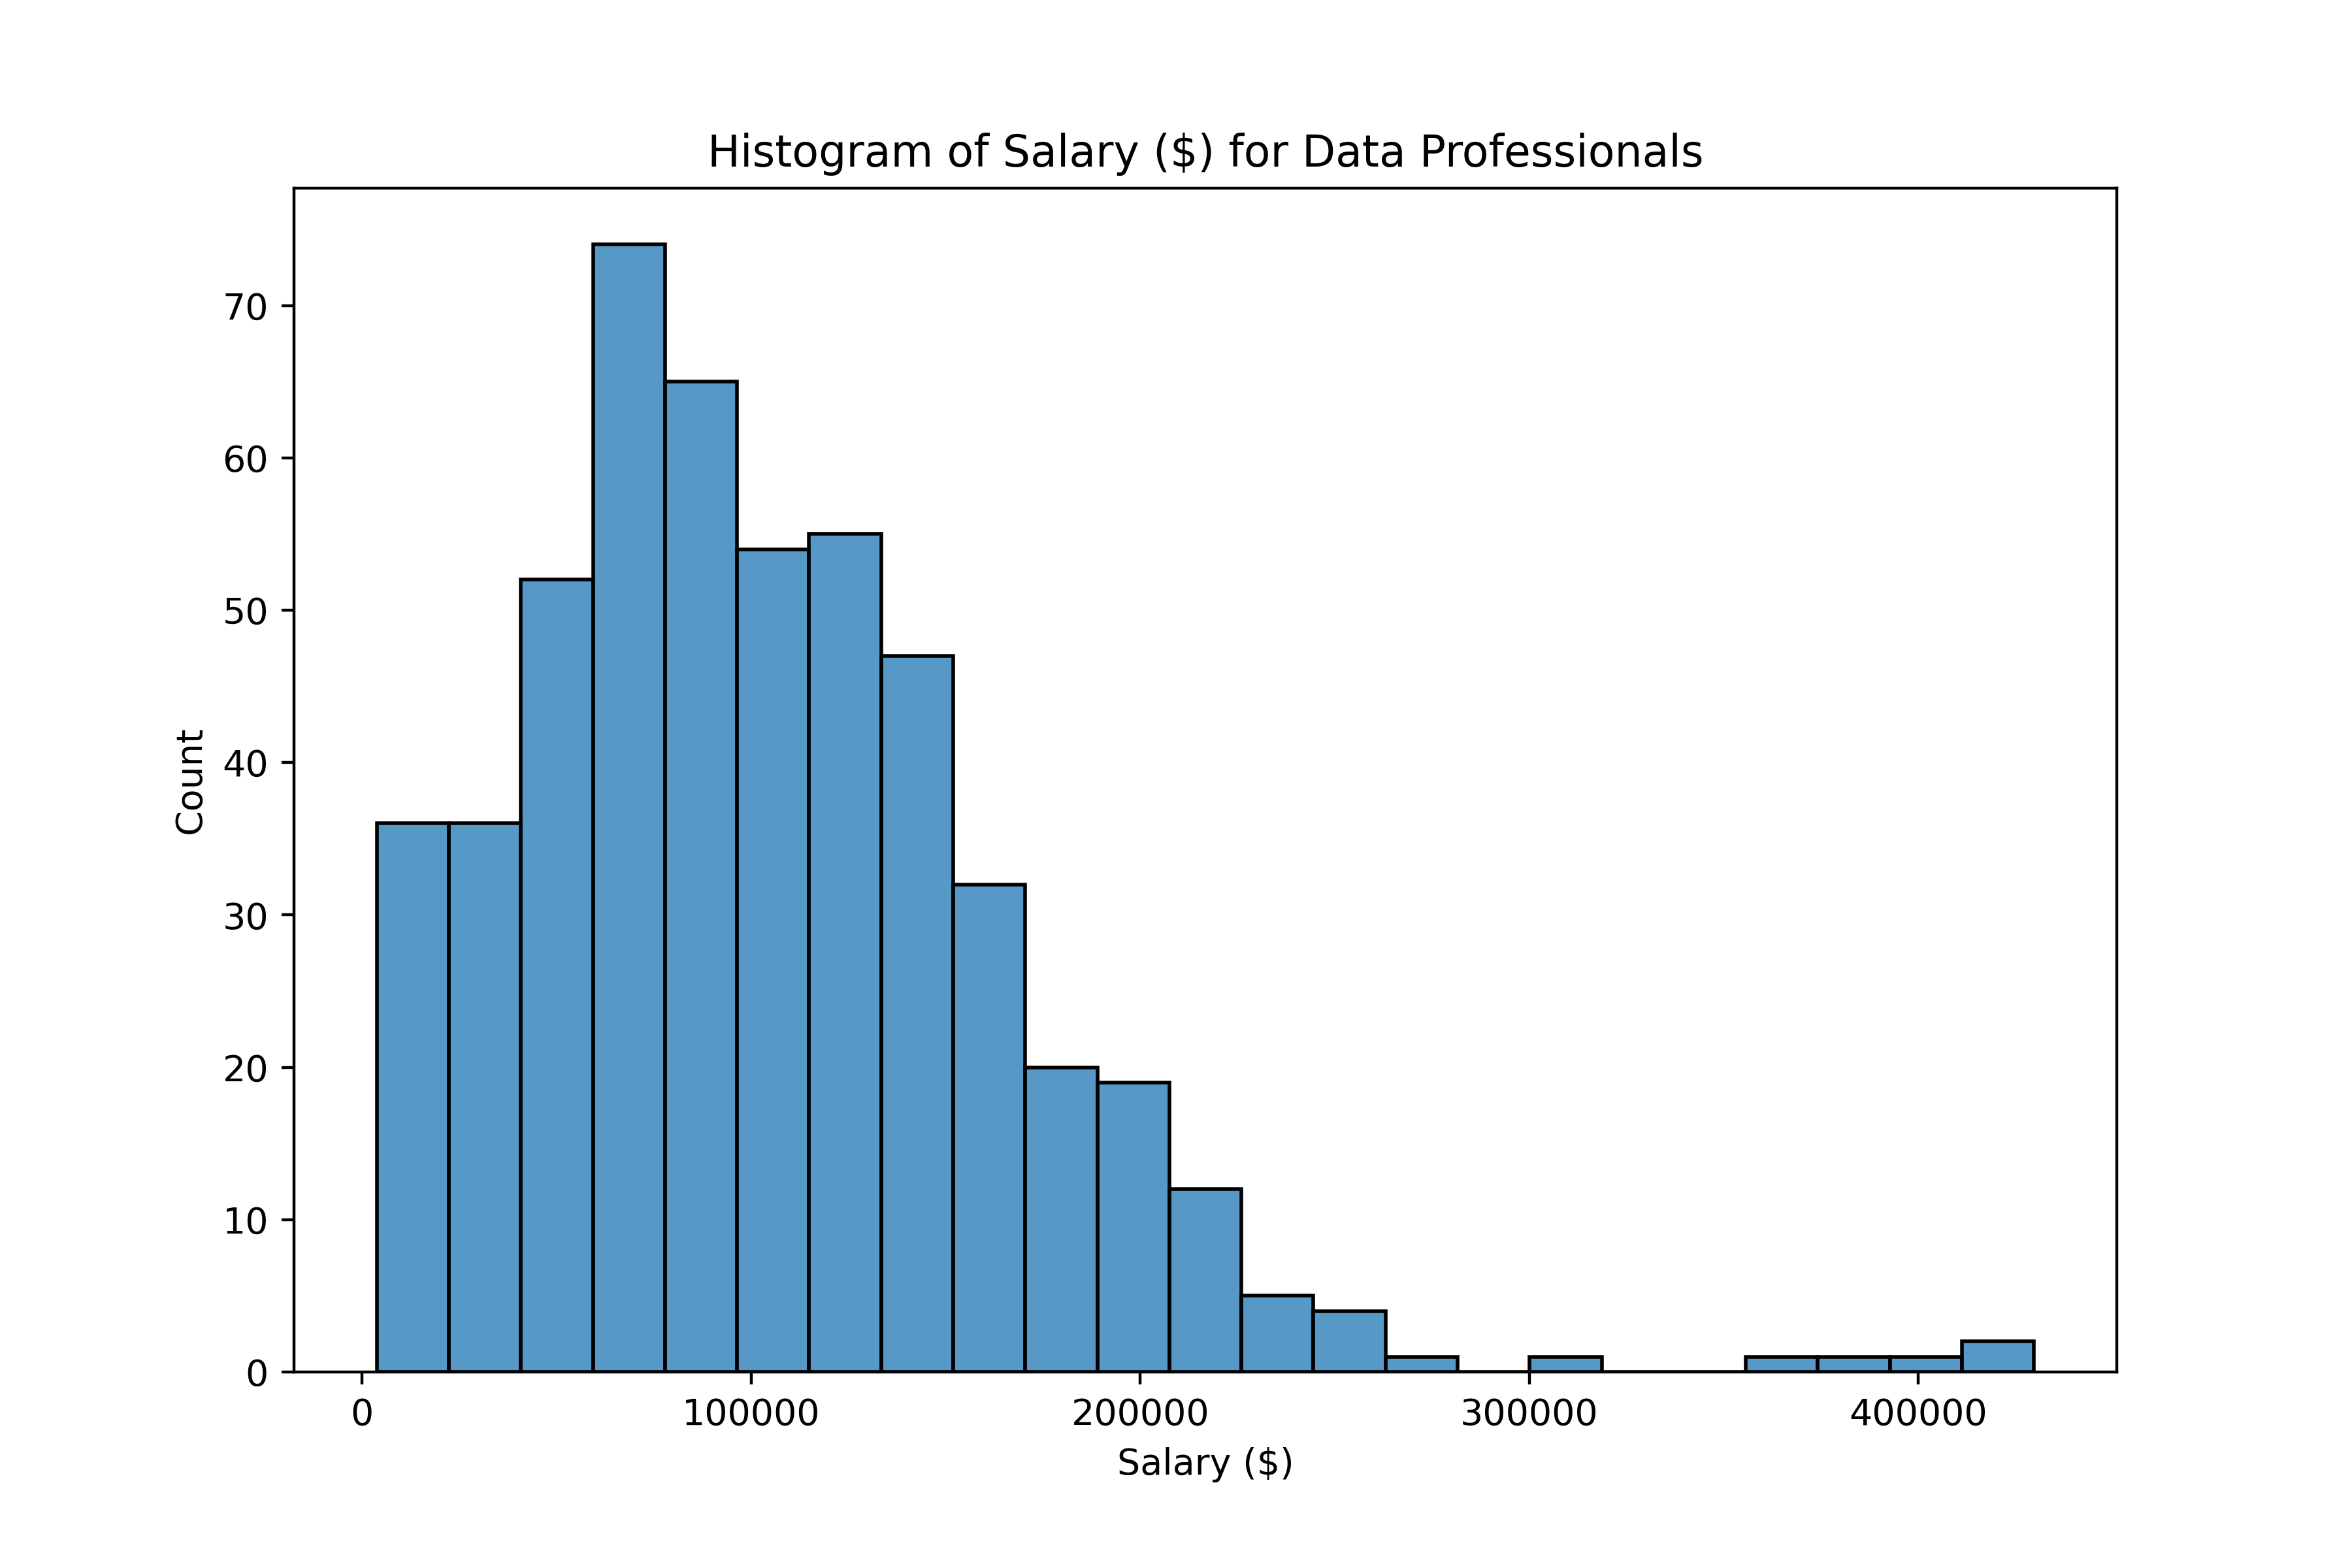
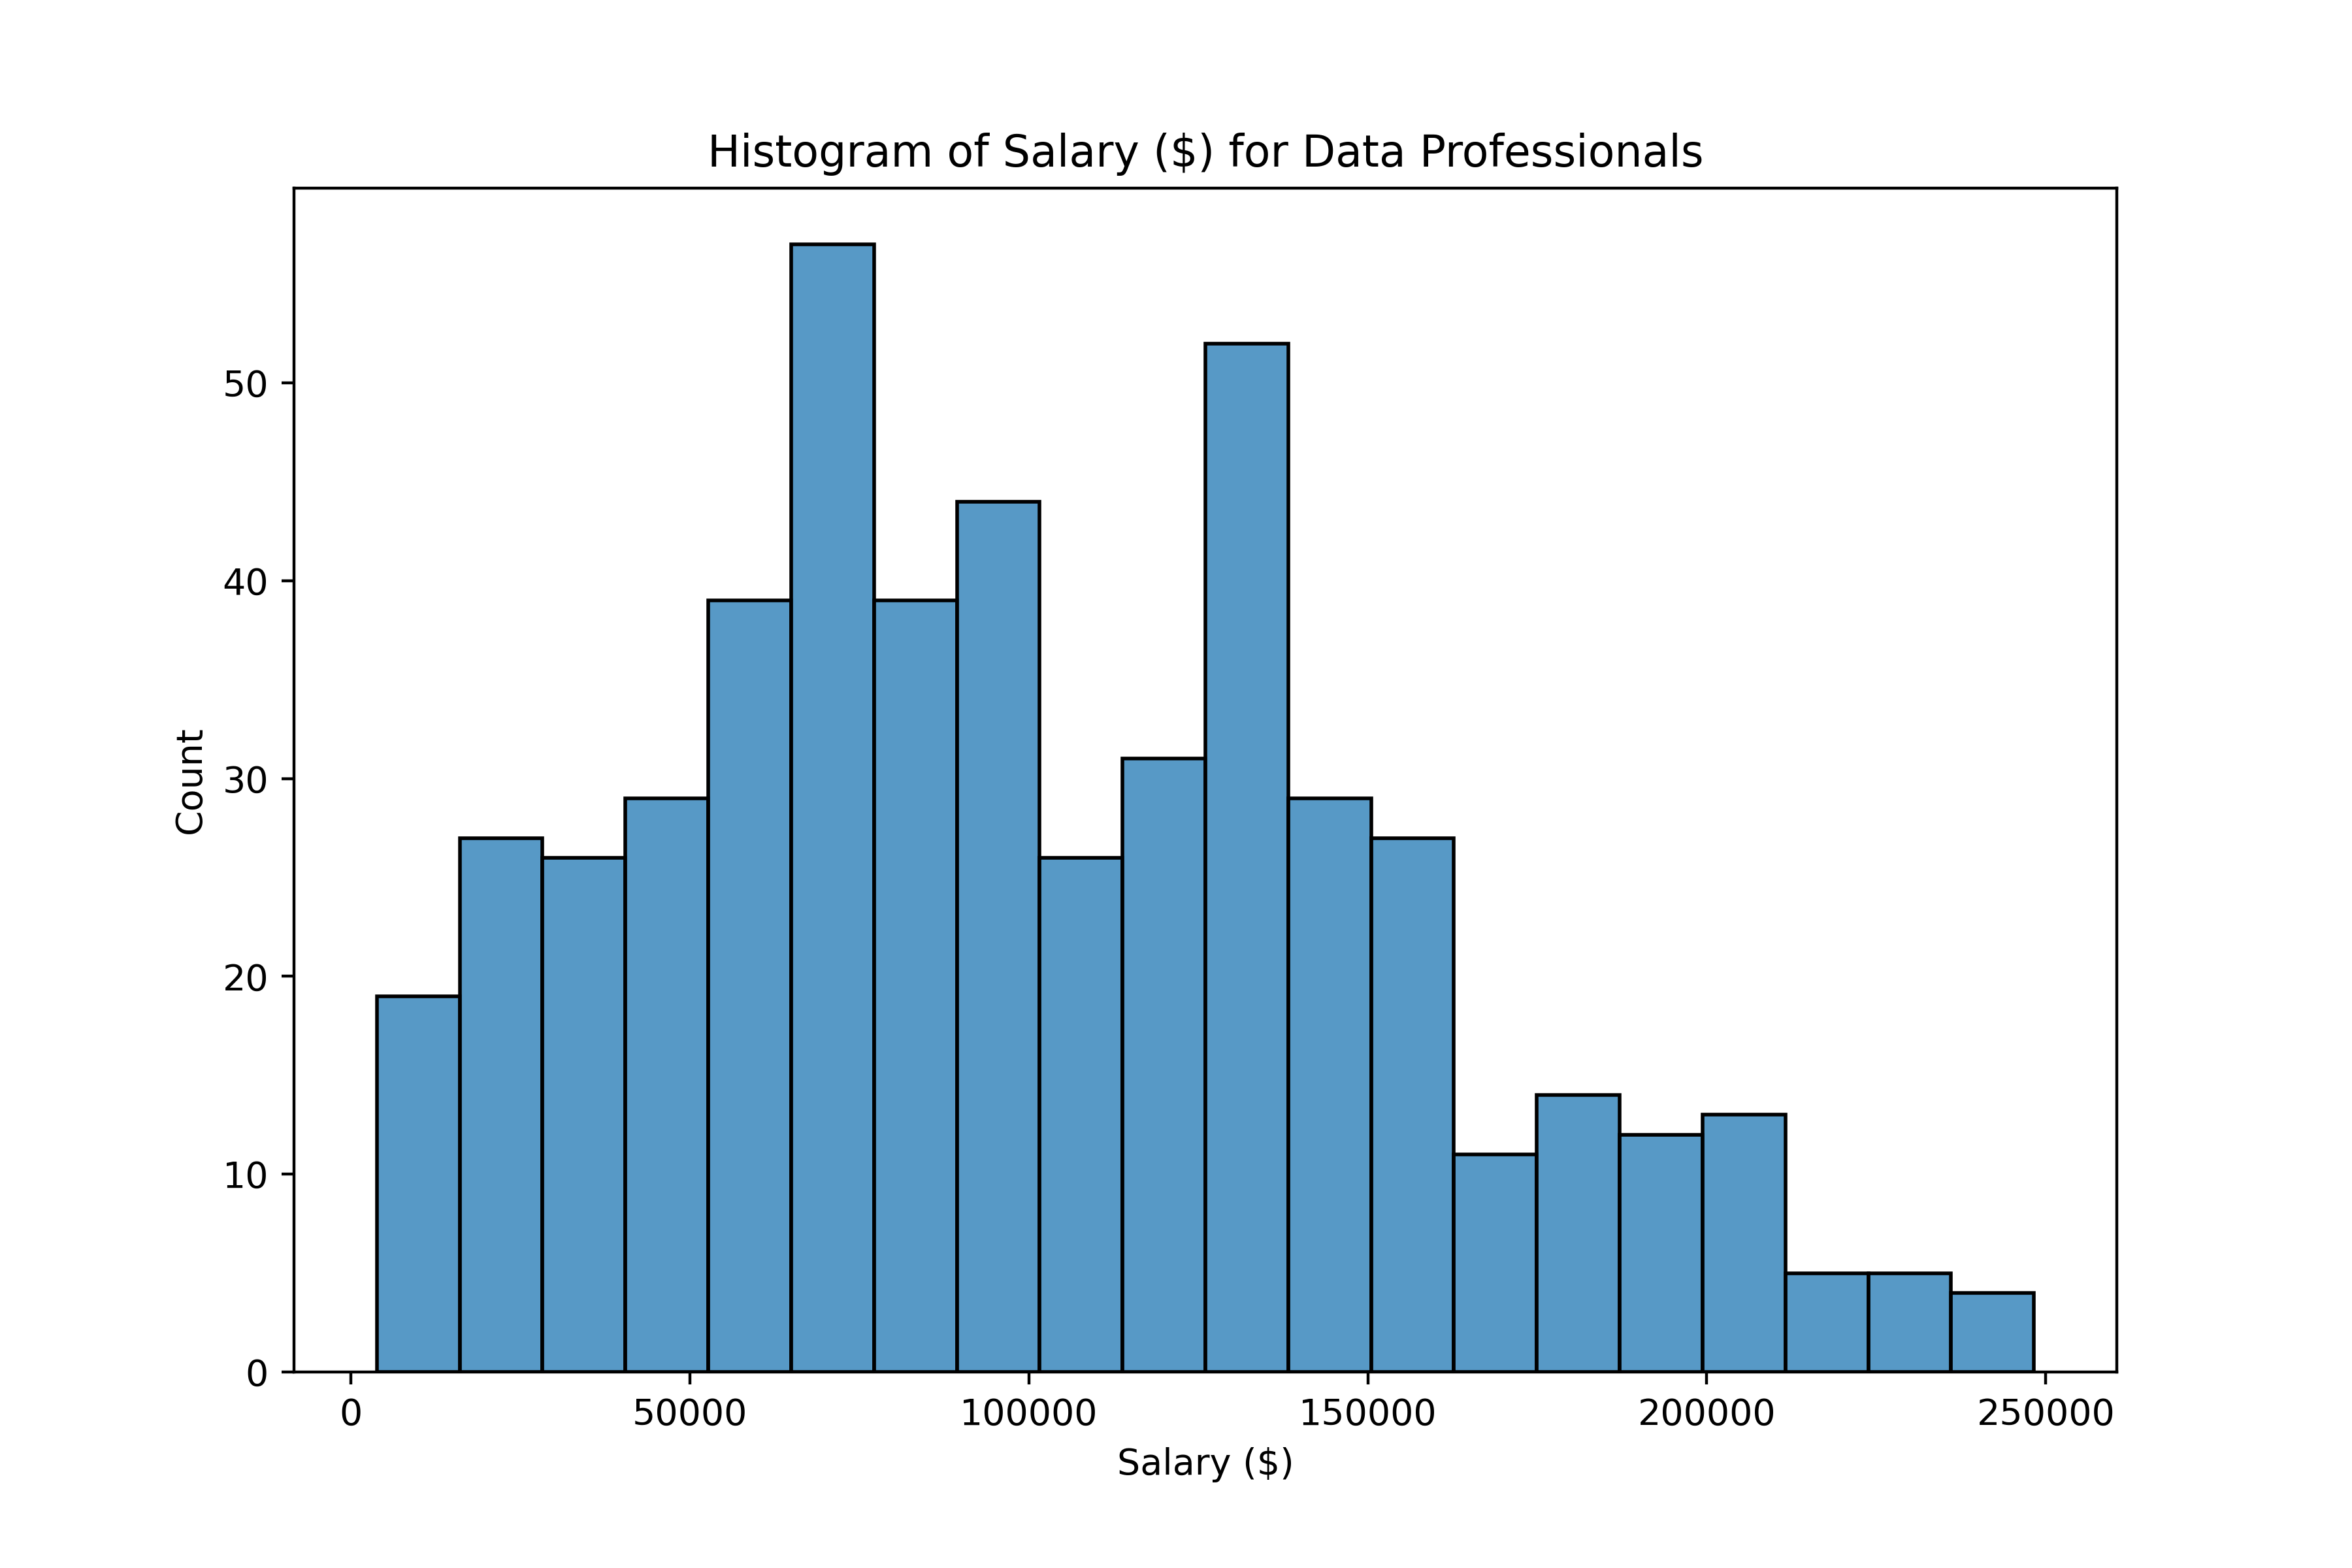
급여 분포

Histogram of salaries after replacing outliers with the median, with extreme values from around 250000 to 450000 dollars

Histogram of salaries after replacing outliers with the median, which almost resembles a normal distribution

Python으로 하는 탐색적 데이터 분석

연습해 봅시다!

Python으로 하는 탐색적 데이터 분석

Preparing Video For Download...