수치형 데이터 다루기

Python으로 하는 탐색적 데이터 분석

George Boorman

Curriculum Manager, DataCamp

원본 급여 데이터세트

print(salaries.info())
Python으로 하는 탐색적 데이터 분석

원본 급여 데이터세트

<class 'pandas.core.frame.DataFrame'>
RangeIndex: 594 entries, 0 to 593
Data columns (total 9 columns):
 #   Column                Non-Null Count  Dtype  
--   ------                --------------  -----  
 0   Working_Year          594 non-null    int64  
 1   Designation           567 non-null    object 
 2   Experience            561 non-null    object 
 3   Employment_Status     563 non-null    object 
 4   Salary_In_Rupees      566 non-null    object 
 5   Employee_Location     554 non-null    object 
 6   Company_Location      570 non-null    object 
 7   Company_Size          535 non-null    object 
 8   Remote_Working_Ratio  571 non-null    float64
dtypes: float64(1), int64(1), object(7)
memory usage: 41.9+ KB
None
Python으로 하는 탐색적 데이터 분석

루피 단위 급여

print(salaries["Salary_In_Rupees"].head())
0    20,688,070.00
1     8,674,985.00
2     1,591,390.00
3    11,935,425.00
4     5,729,004.00
Name: Salary_In_Rupees, dtype: object
Python으로 하는 탐색적 데이터 분석

문자열을 숫자로 변환하기

  • Salary_In_Rupees에서 쉼표 값 제거
  • 열을 float 데이터 유형으로 변환
  • 통화를 변환하여 새로운 열 생성

Dollar bills

Python으로 하는 탐색적 데이터 분석

문자열을 숫자로 변환하기

pd.Series.str.replace("characters to remove", "characters to replace them with")
salaries["Salary_In_Rupees"] = salaries["Salary_In_Rupees"].str.replace(",", "")

print(salary["Salary_In_Rupees"].head())
1    20688070.00
2     8674985.00
3     1591390.00
4    11935425.00
5     5729004.00
Name: Salary_In_Rupees, dtype: object
Python으로 하는 탐색적 데이터 분석

문자열을 숫자로 변환하기

salaries["Salary_In_Rupees"] = salaries["Salary_In_Rupees"].astype(float)
  • 1 인도 루피 = 0.012 미국 달러
salaries["Salary_USD"] = salaries["Salary_In_Rupees"] * 0.012
Python으로 하는 탐색적 데이터 분석

새 열 미리 보기

print(salaries[["Salary_In_Rupees", "Salary_USD"]].head())
   Salary_In_Rupees  Salary_USD
0        20688070.0  248256.840
1         8674985.0  104099.820
2         1591390.0   19096.680
3        11935425.0  143225.100
4         5729004.0   68748.048
Python으로 하는 탐색적 데이터 분석

데이터프레임에 요약 통계 추가하기

salaries.groupby("Company_Size")["Salary_USD"].mean()
Company_Size
L    111934.432174
M    110706.628527
S     69880.980179
Name: Salary_USD, dtype: float64
Python으로 하는 탐색적 데이터 분석

데이터프레임에 요약 통계 추가하기

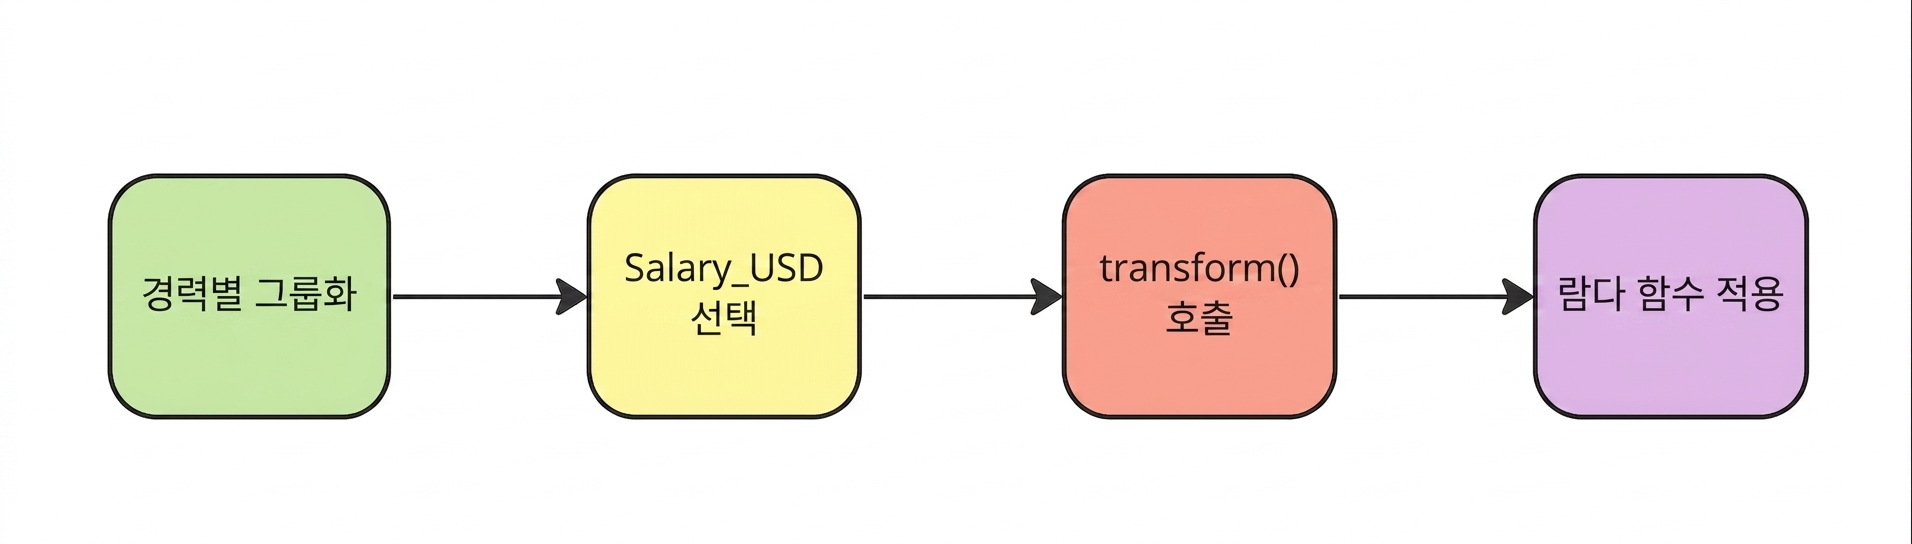
Group by the Experience column

salaries["std_dev"] = salaries.groupby("Experience")
Python으로 하는 탐색적 데이터 분석

데이터프레임에 요약 통계 추가하기

Then select the Salary_USD column

salaries["std_dev"] = salaries.groupby("Experience")["Salary_USD"]
Python으로 하는 탐색적 데이터 분석

데이터프레임에 요약 통계 추가하기

Call the pandas dot-transform method

salaries["std_dev"] = salaries.groupby("Experience")["Salary_USD"].transform(
Python으로 하는 탐색적 데이터 분석

데이터프레임에 요약 통계 추가하기

Apply a lambda function

salaries["std_dev"] = salaries.groupby("Experience")["Salary_USD"].transform(lambda x: x.std())
Python으로 하는 탐색적 데이터 분석

데이터프레임에 요약 통계 추가하기

print(salaries[["Experience", "std_dev"]].value_counts())
Experience         std_dev
SE                 52995.385395        257
MI                 63217.397343        197
EN                 43367.256303         83
EX                 86426.611619         24
Python으로 하는 탐색적 데이터 분석

데이터프레임에 요약 통계 추가하기

salaries["median_by_comp_size"] = salaries.groupby("Company_Size") \
                                        ["Salary_USD"].transform(lambda x: x.median())
print(salaries[["Company_Size", "median_by_comp_size"]].head())
     Company_Size     median_by_comp_size
0    S                60833.424
1    M                105914.964
2    S                60833.424
3    L                95483.400
4    L                95483.400
Python으로 하는 탐색적 데이터 분석

연습해 봅시다!

Python으로 하는 탐색적 데이터 분석

Preparing Video For Download...