새로운 특성 생성하기

Python으로 하는 탐색적 데이터 분석

George Boorman

Curriculum Manager, DataCamp

상관관계

sns.heatmap(planes.corr(numeric_only=True), annot=True)
plt.show()
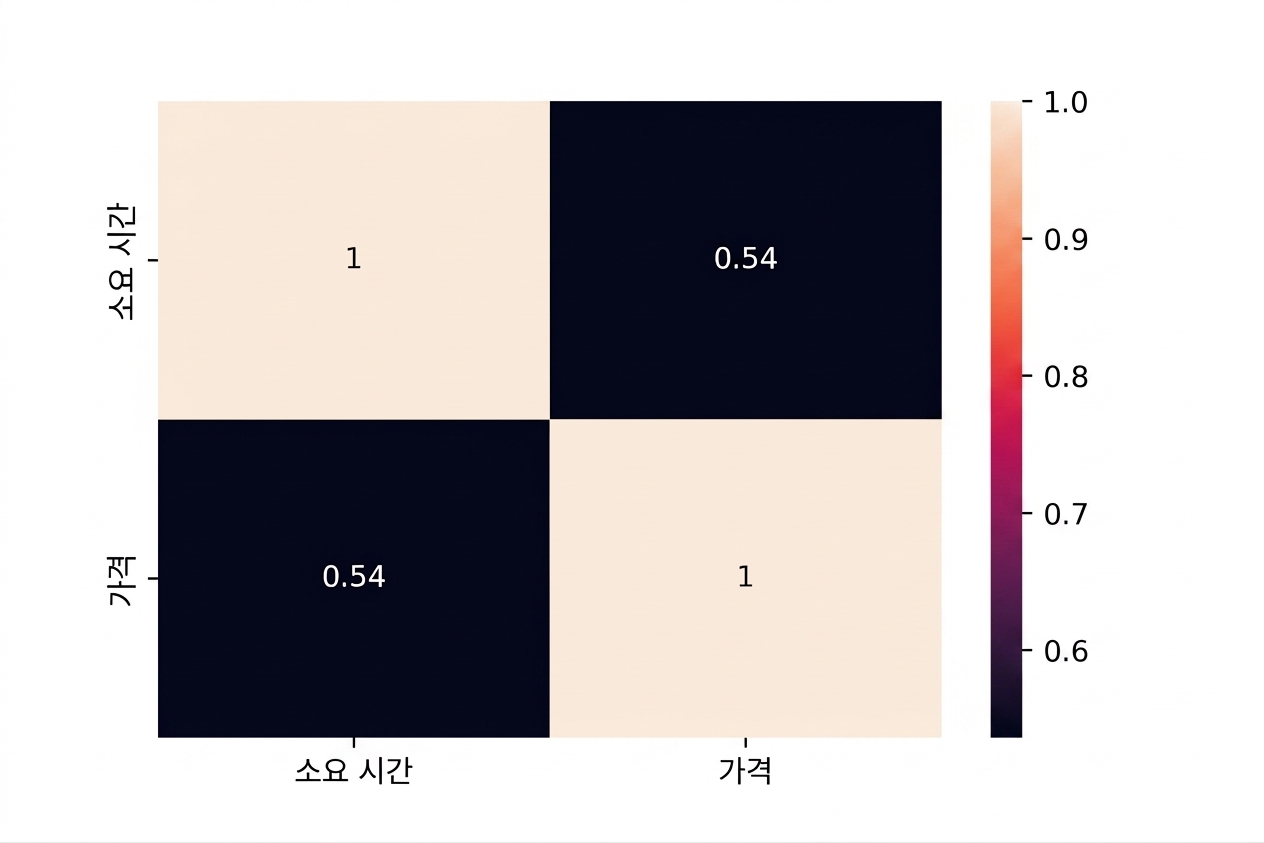
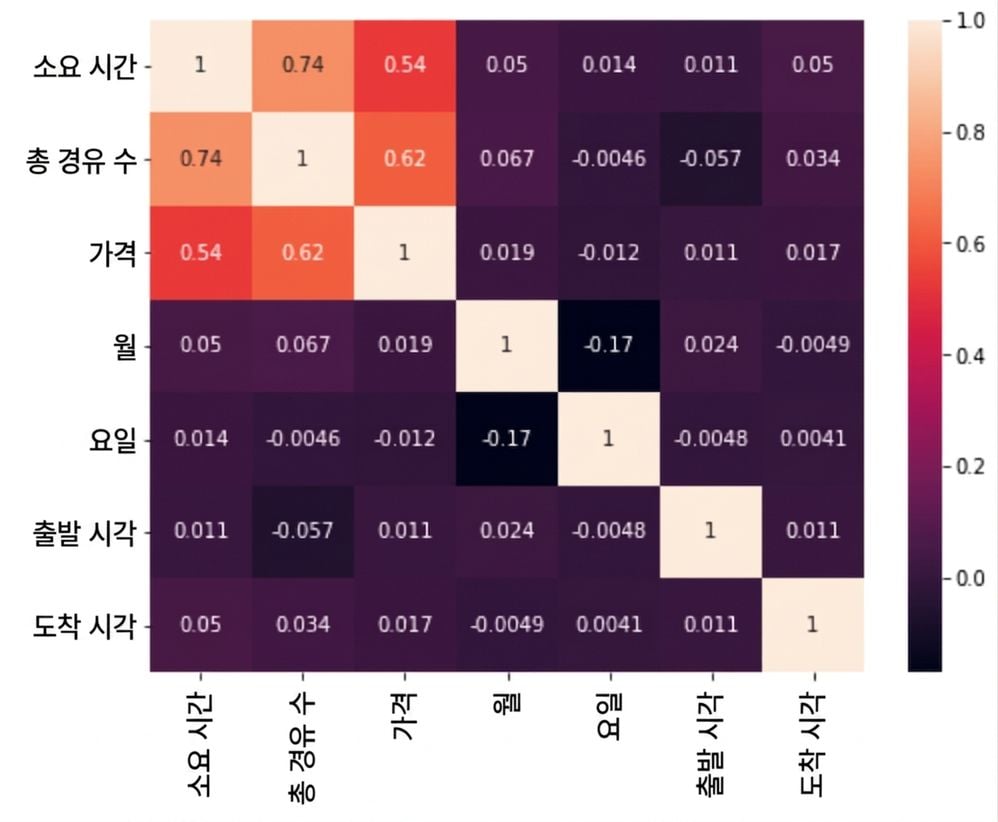
Heatmap showing 0.54 Pearson correlation coefficient between Price and Duration

Python으로 하는 탐색적 데이터 분석

데이터 유형 확인하기

print(planes.dtypes)
Airline                    object
Date_of_Journey    datetime64[ns]
Source                     object
Destination                object
Route                      object
Dep_Time           datetime64[ns]
Arrival_Time       datetime64[ns]
Duration                  float64
Total_Stops                object
Additional_Info            object
Price                     float64
dtype: object
Python으로 하는 탐색적 데이터 분석

경유 횟수

print(planes["Total_Stops"].value_counts())
1 stop      4107
non-stop    2584
2 stops     1127
3 stops       29
4 stops        1
Name: Total_Stops, dtype: int64
Python으로 하는 탐색적 데이터 분석

경유 횟수 정리하기

planes["Total_Stops"] = planes["Total_Stops"].str.replace(" stops", "")

planes["Total_Stops"] = planes["Total_Stops"].str.replace(" stop", "")
planes["Total_Stops"] = planes["Total_Stops"].str.replace("non-stop", "0")
planes["Total_Stops"] = planes["Total_Stops"].astype(int)
Python으로 하는 탐색적 데이터 분석

상관관계

sns.heatmap(planes.corr(numeric_only=True), annot=True)
plt.show()
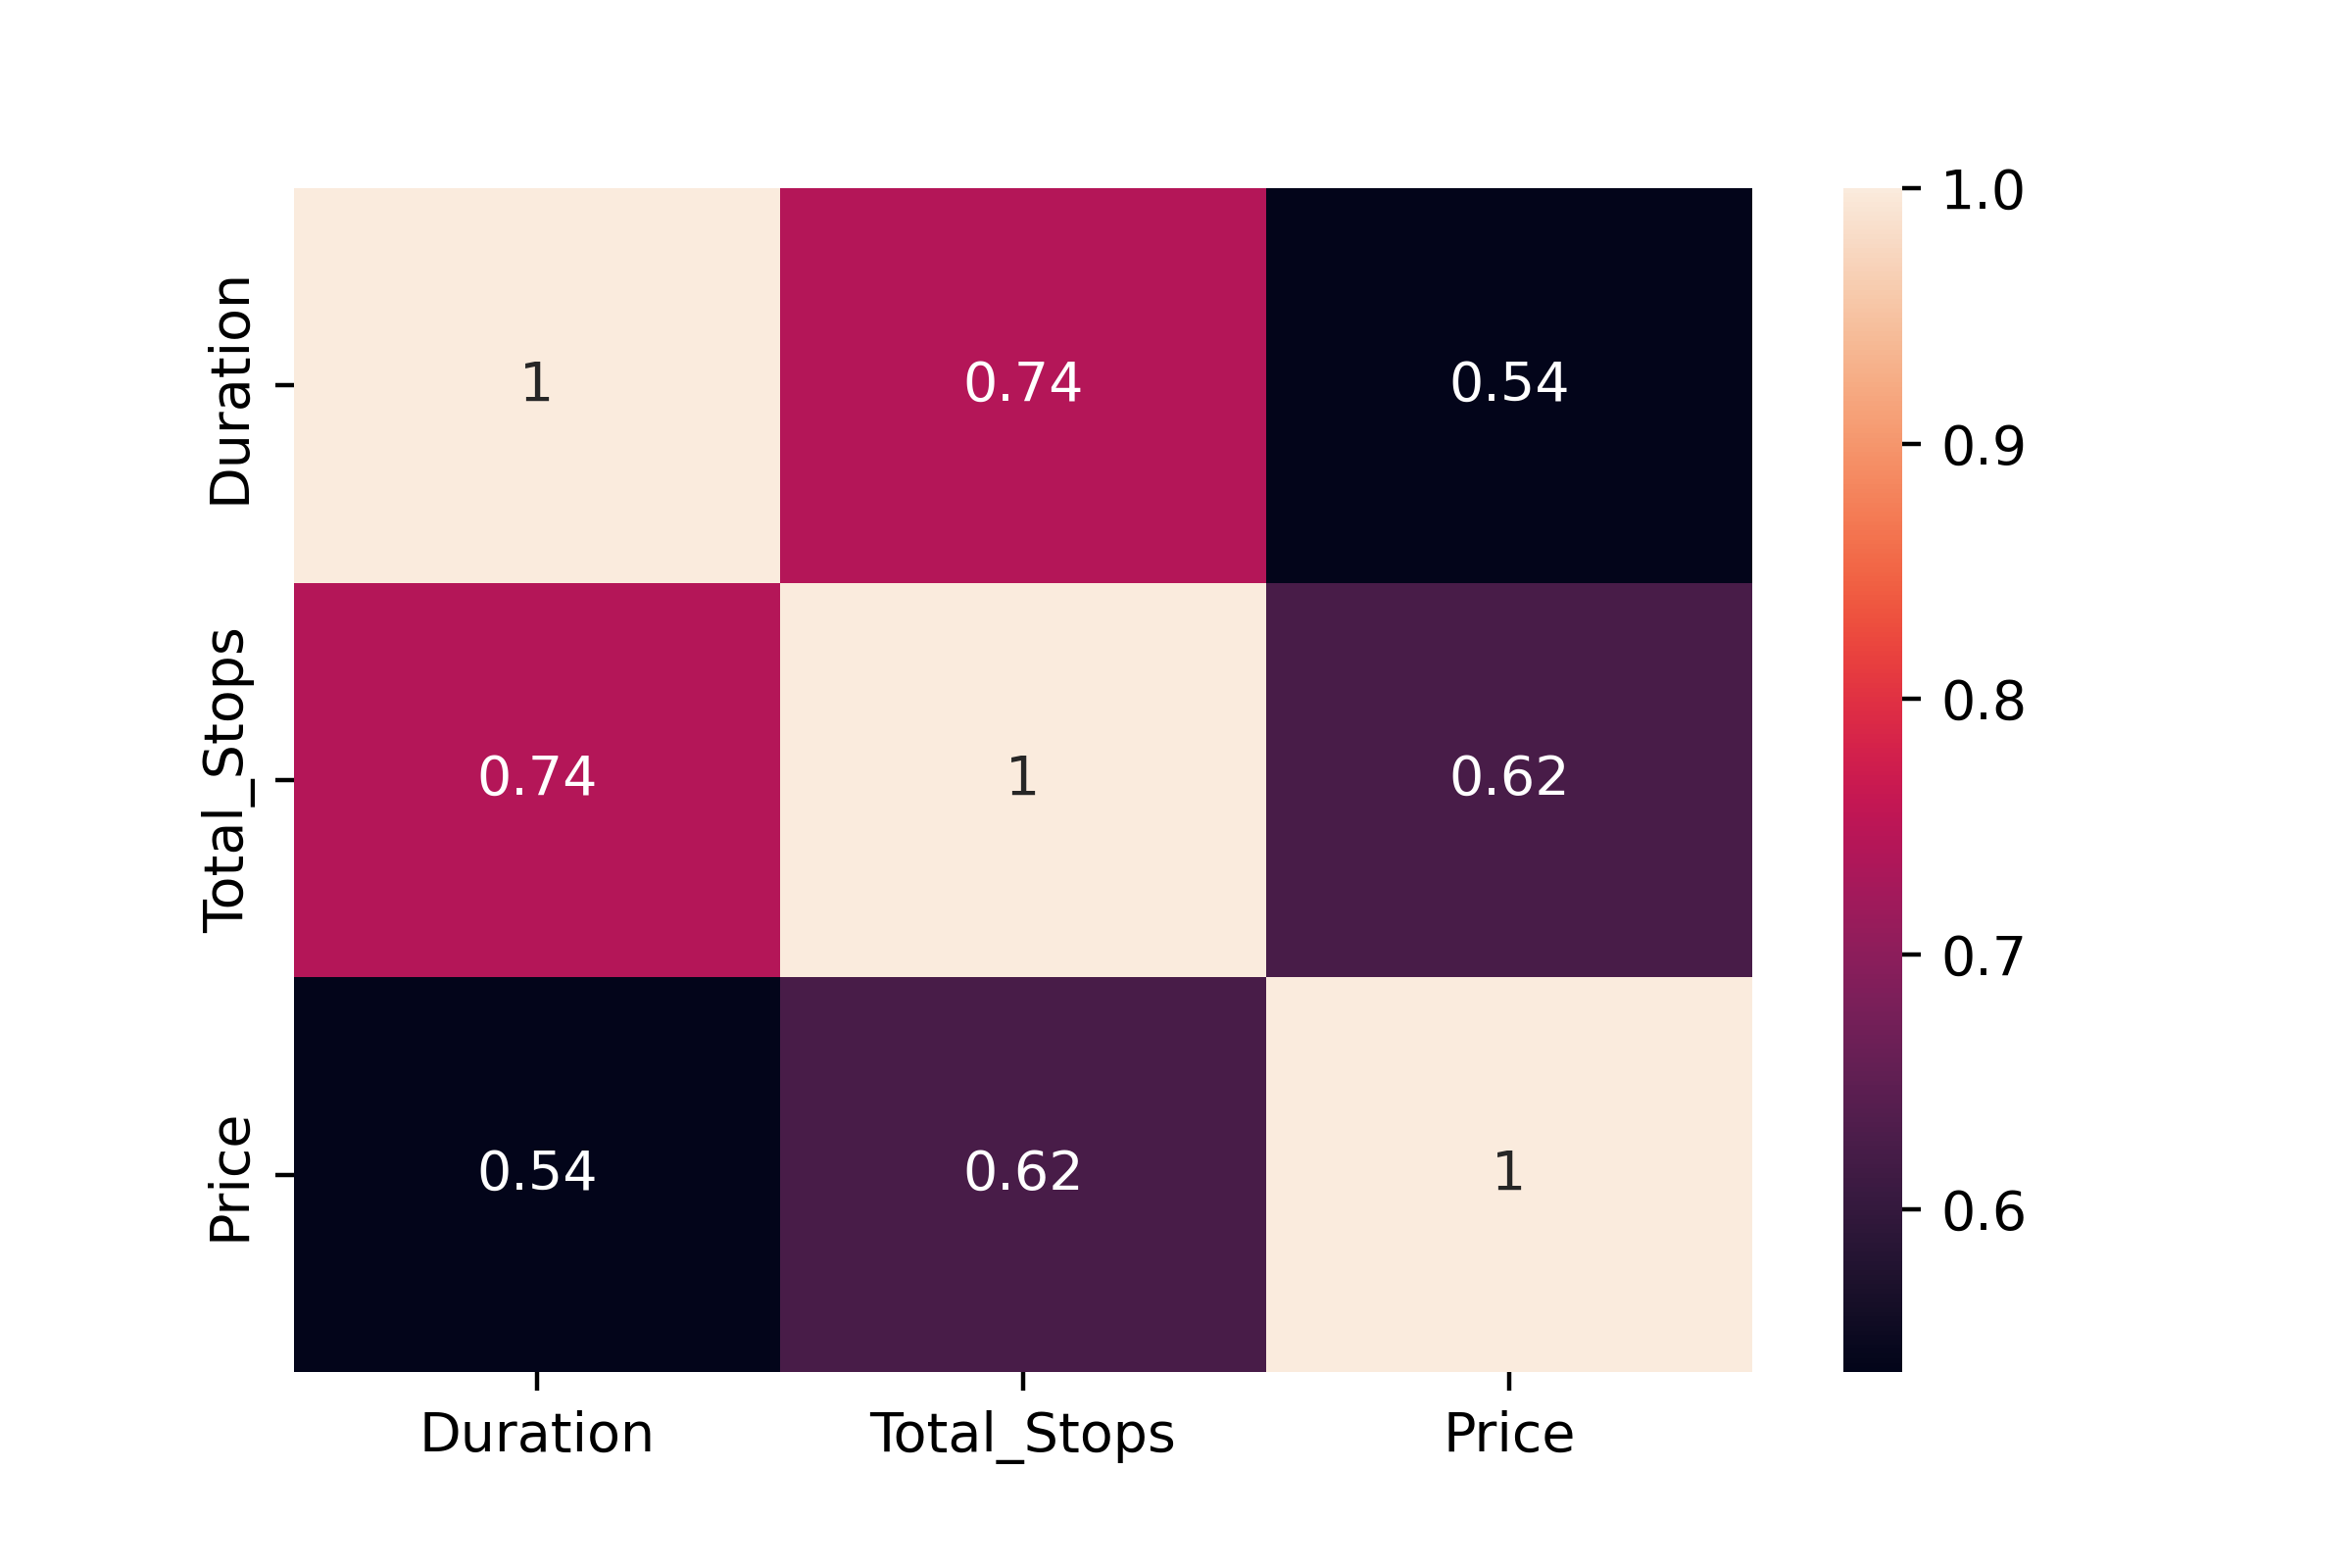
Heatmap showing 0.62 Pearson correlation coefficient between Price and Total Stops and 0.74 correlation between Duration and Total Stops

Python으로 하는 탐색적 데이터 분석

날짜

print(planes.dtypes)
Airline                    object
Date_of_Journey    datetime64[ns]
Source                     object
Destination                object
Route                      object
Dep_Time           datetime64[ns]
Arrival_Time       datetime64[ns]
Duration                  float64
Total_Stops                 int64
Additional_Info            object
Price                     float64
dtype: object
Python으로 하는 탐색적 데이터 분석

월과 요일 추출하기

planes["month"] = planes["Date_of_Journey"].dt.month

planes["weekday"] = planes["Date_of_Journey"].dt.weekday
print(planes[["month", "weekday", "Date_of_Journey"]].head())
   month  weekday   Date_of_Journey
0      9        4        2019-09-06
1     12        3        2019-12-05
2      1        3        2019-01-03
3      6        0        2019-06-24
4     12        1        2019-12-03
Python으로 하는 탐색적 데이터 분석

출발 및 도착 시간

planes["Dep_Hour"] = planes["Dep_Time"].dt.hour
planes["Arrival_Hour"] = planes["Arrival_Time"].dt.hour
Python으로 하는 탐색적 데이터 분석

상관관계

Heatmap showing no relationship between datetime attributes and price

Python으로 하는 탐색적 데이터 분석

범주 만들기

print(planes["Price"].describe())
count     7848.000000
mean      9035.413609
std       4429.822081
min       1759.000000
25%       5228.000000
50%       8355.000000
75%      12373.000000
max      54826.000000
Name: Price, dtype: float64
구간 티켓 유형
<= 5228 이코노미
> 5228 <= 8355 프리미엄 이코노미
> 8335 <= 12373 비즈니스
> 12373 퍼스트
Python으로 하는 탐색적 데이터 분석

기술 통계

twenty_fifth = planes["Price"].quantile(0.25)

median = planes["Price"].median()
seventy_fifth = planes["Price"].quantile(0.75)
maximum = planes["Price"].max()
Python으로 하는 탐색적 데이터 분석

레이블과 빈

labels = ["Economy", "Premium Economy", "Business Class", "First Class"]

bins = [0, twenty_fifth, median, seventy_fifth, maximum]
Python으로 하는 탐색적 데이터 분석

pd.cut()

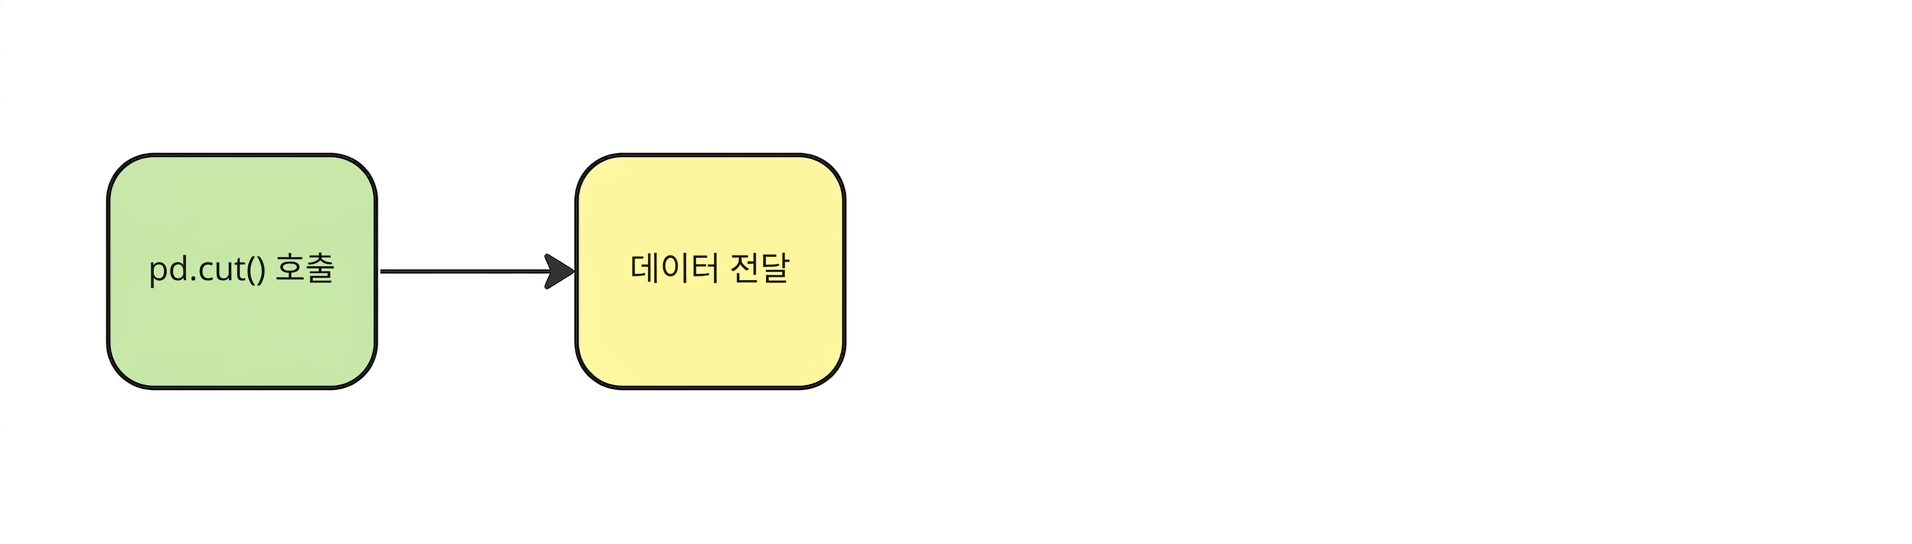
Call pd-dot-cut

planes["Price_Category"] = pd.cut(


Python으로 하는 탐색적 데이터 분석

pd.cut()

Pass the data

planes["Price_Category"] = pd.cut(planes["Price"],


Python으로 하는 탐색적 데이터 분석

pd.cut()

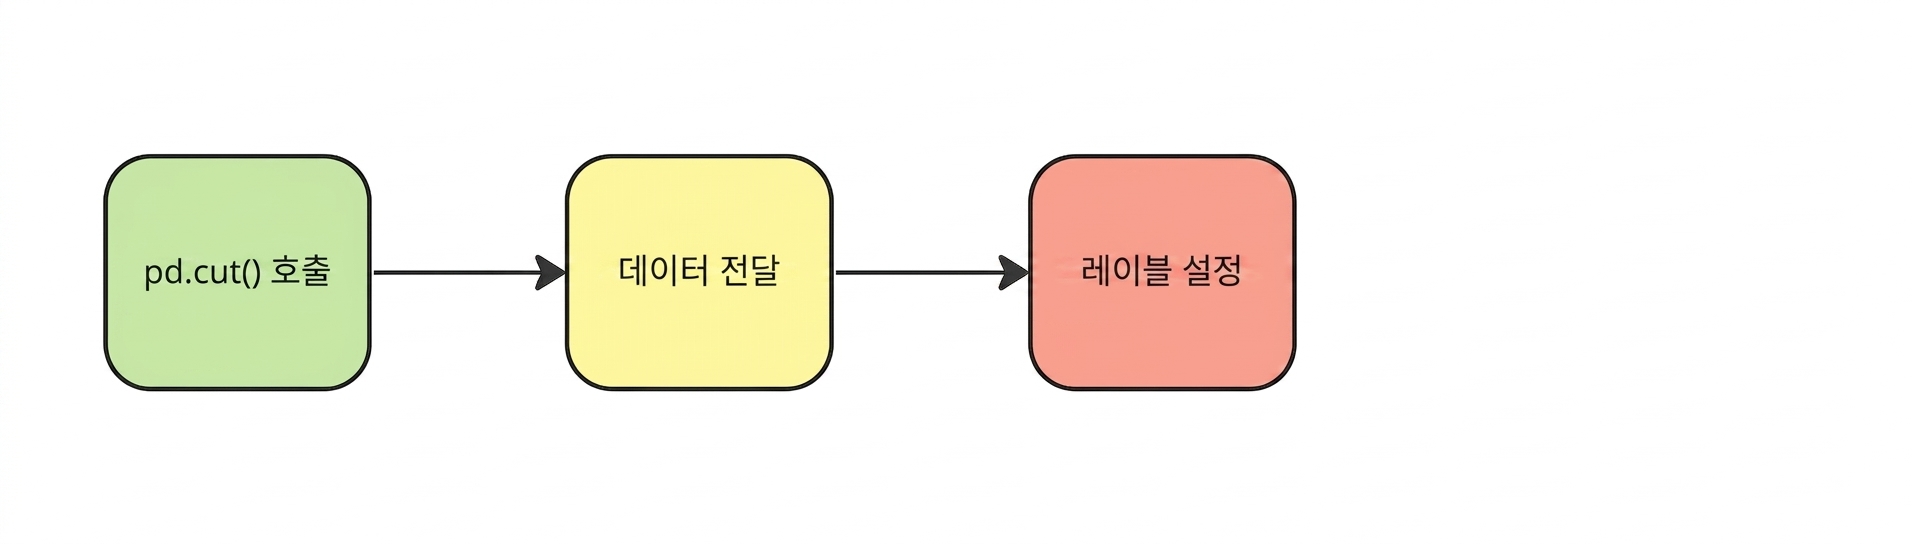
Set the labels

planes["Price_Category"] = pd.cut(planes["Price"],
                                  labels=labels,

Python으로 하는 탐색적 데이터 분석

pd.cut()

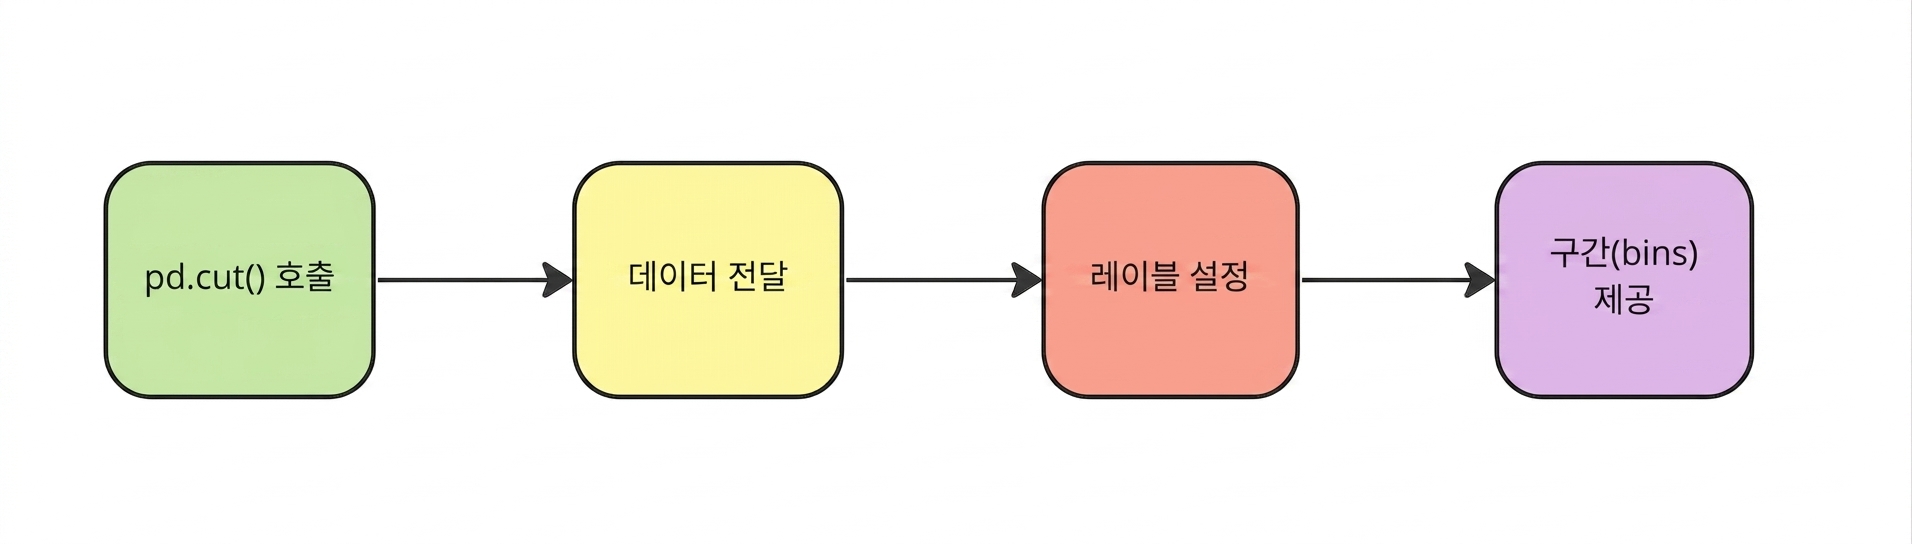
Provide the bins

planes["Price_Category"] = pd.cut(planes["Price"],
                                  labels=labels,
                                  bins=bins)
Python으로 하는 탐색적 데이터 분석

가격 범주

print(planes[["Price","Price_Category"]].head())
     Price   Price_Category
0  13882.0      First Class
1   6218.0  Premium Economy
2  13302.0      First Class
3   3873.0          Economy
4  11087.0   Business Class
Python으로 하는 탐색적 데이터 분석

항공사별 가격 범주

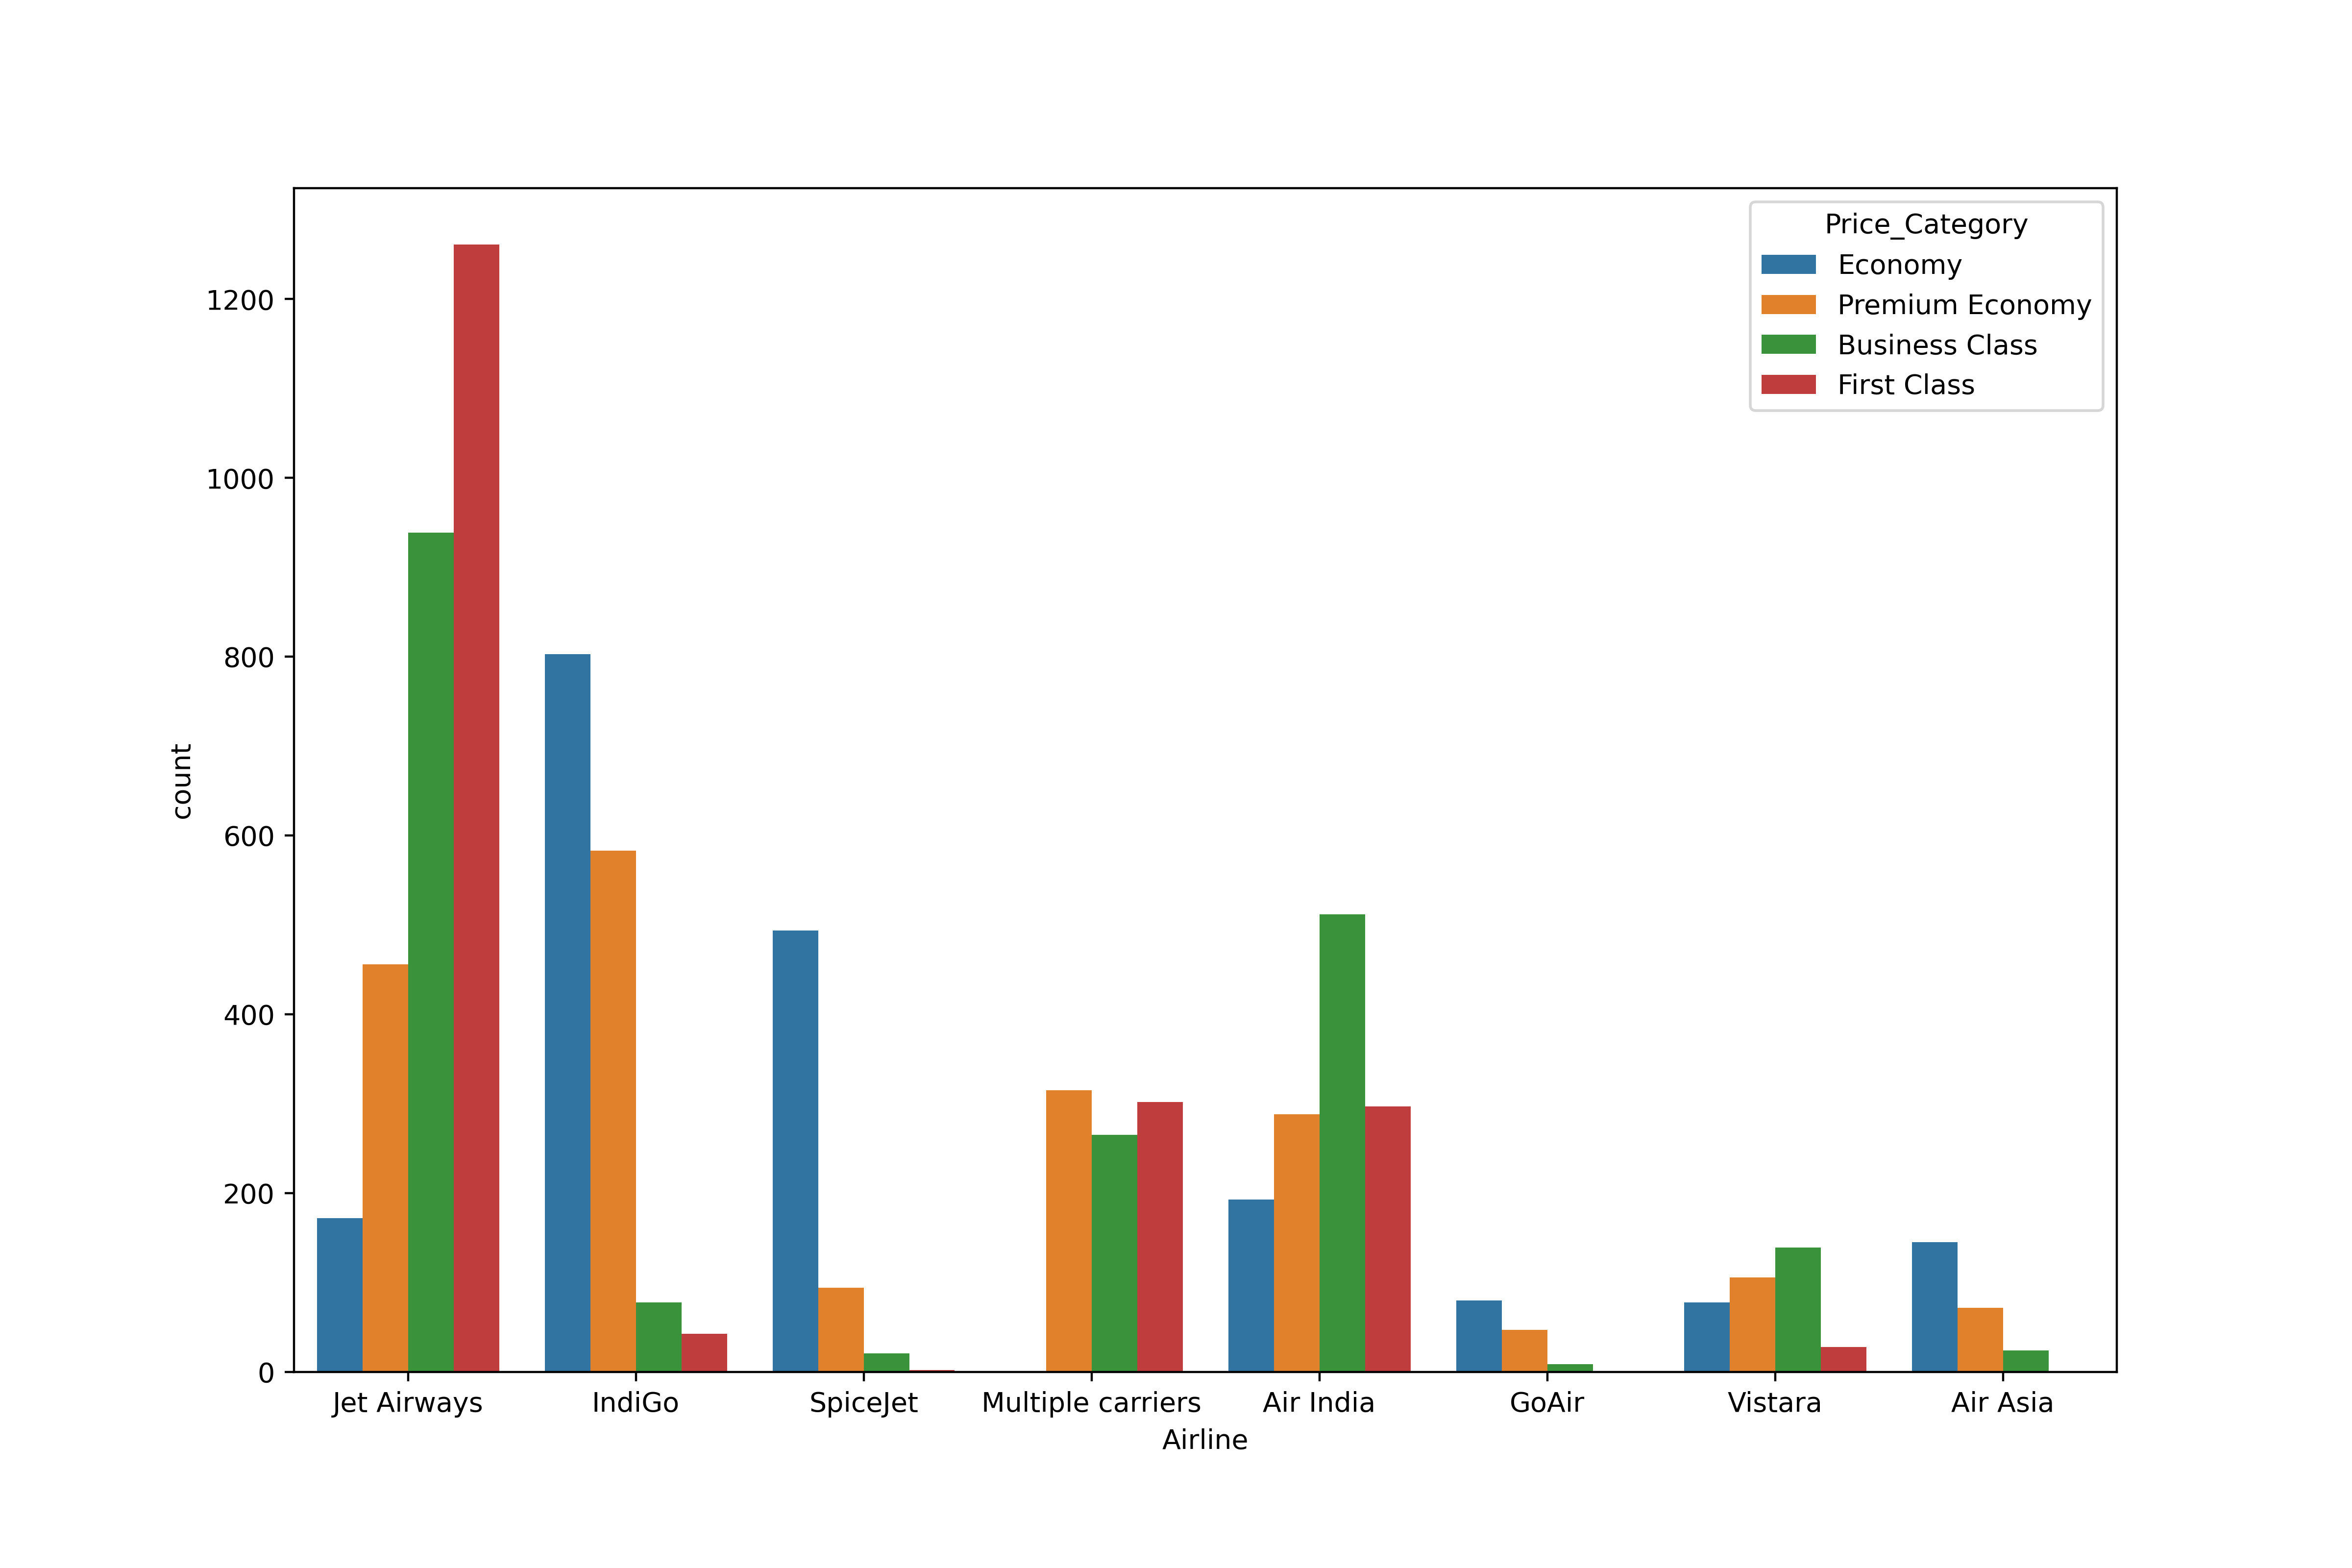
sns.countplot(data=planes, x="Airline", hue="Price_Category")
plt.show()
Python으로 하는 탐색적 데이터 분석

항공사별 가격 범주

Countplot showing the number of flights per airline in different price categories, with Jet Airways having the largest number of First Class tickets

Python으로 하는 탐색적 데이터 분석

연습해 봅시다!

Python으로 하는 탐색적 데이터 분석

Preparing Video For Download...