미적 요소 활용 모범 사례
ggplot2로 시작하는 데이터 시각화

Rick Scavetta
Founder, Scavetta Academy
형식은 기능을 따른다

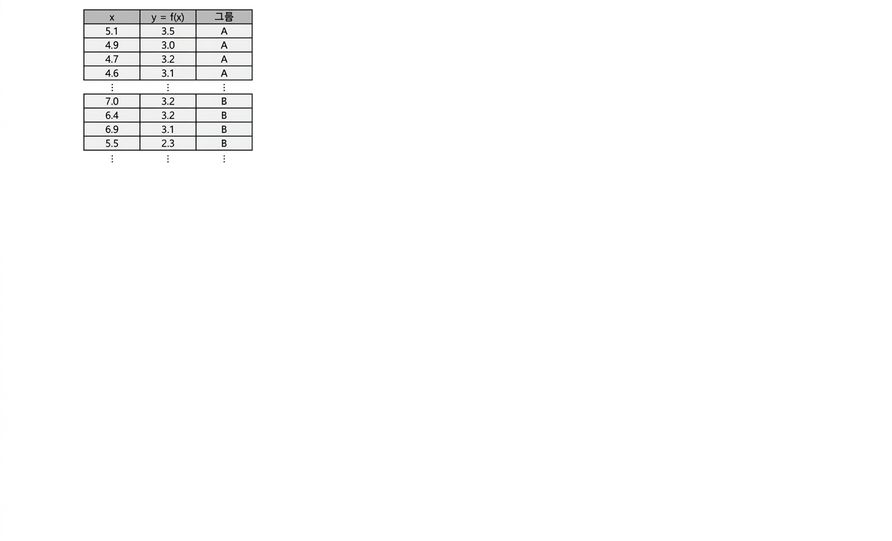

데이터에서 정보 추출하기

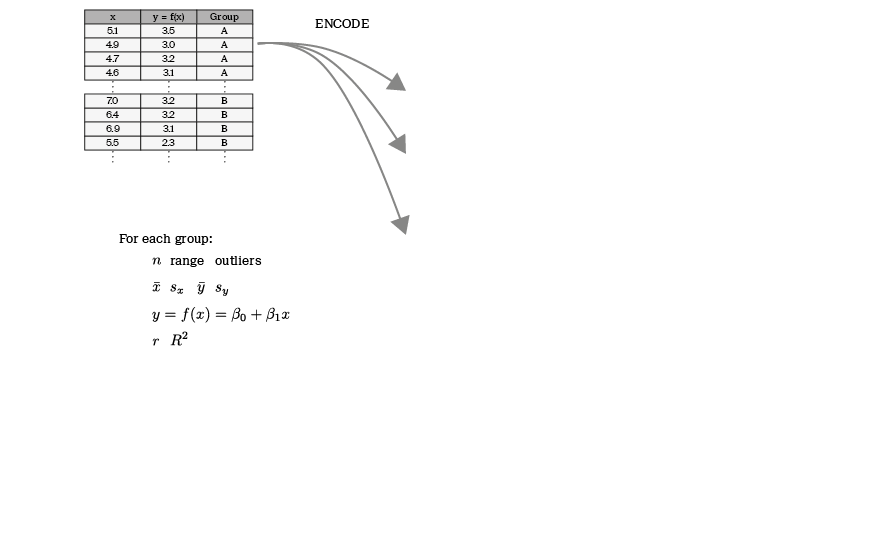
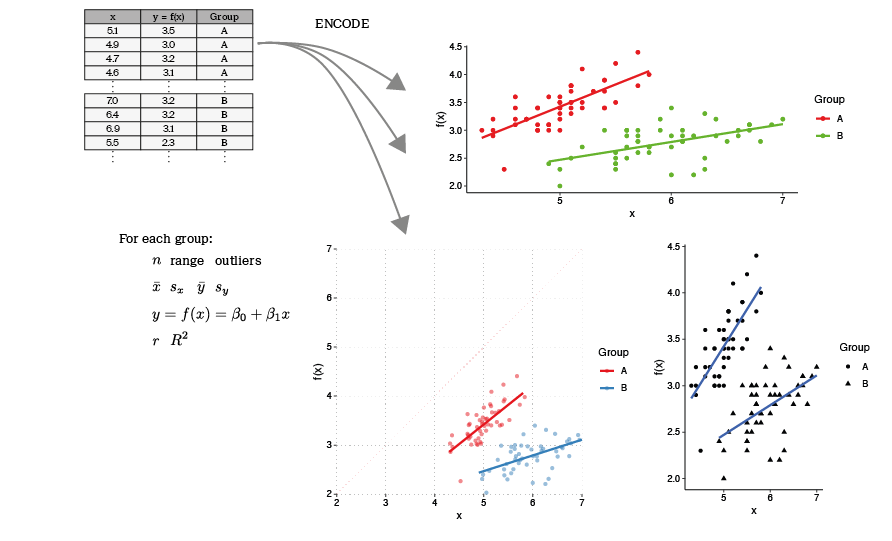
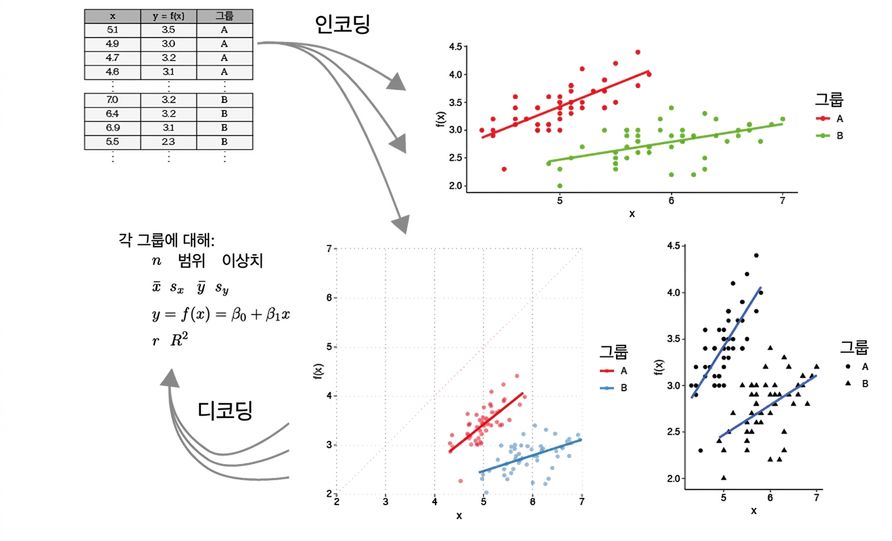
미적 요소 - 연속형 변수
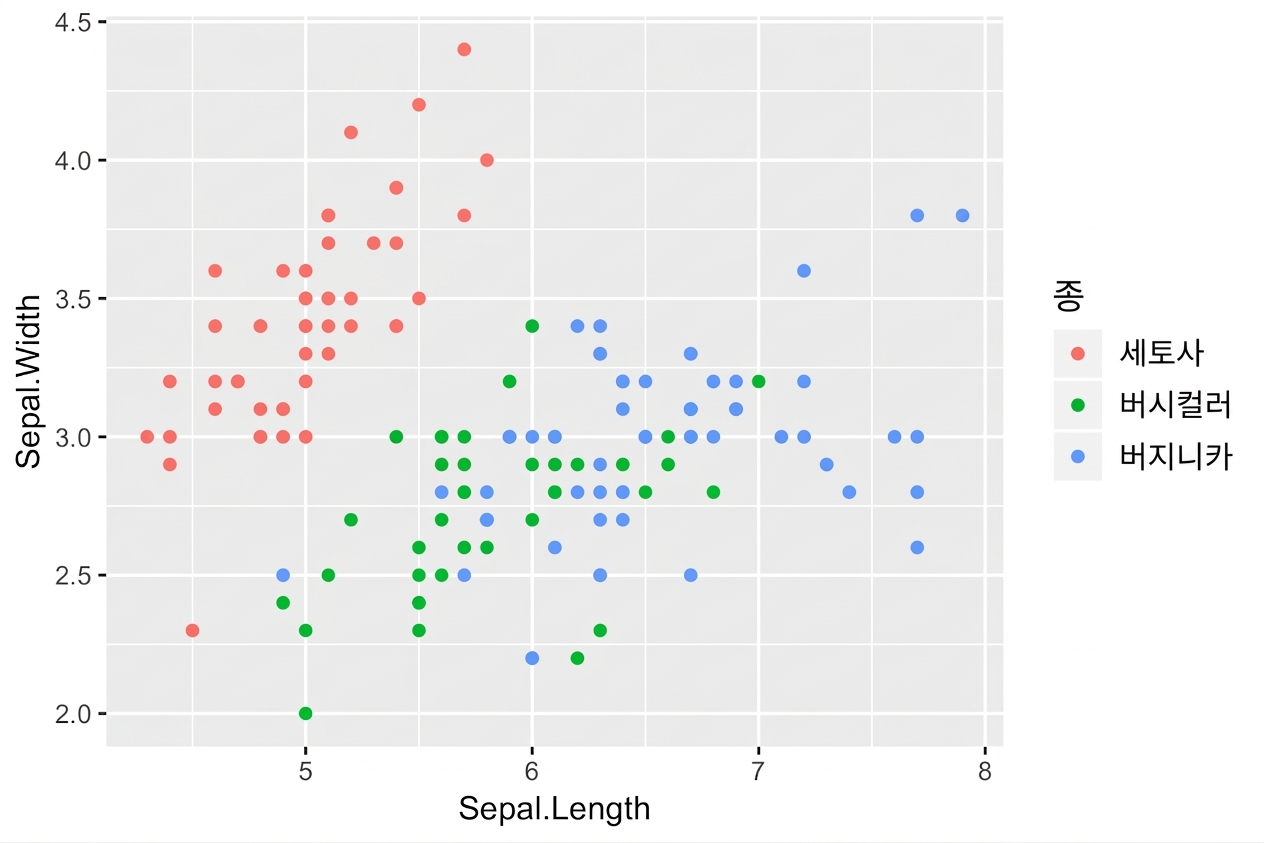
미적 요소 - 연속형 변수
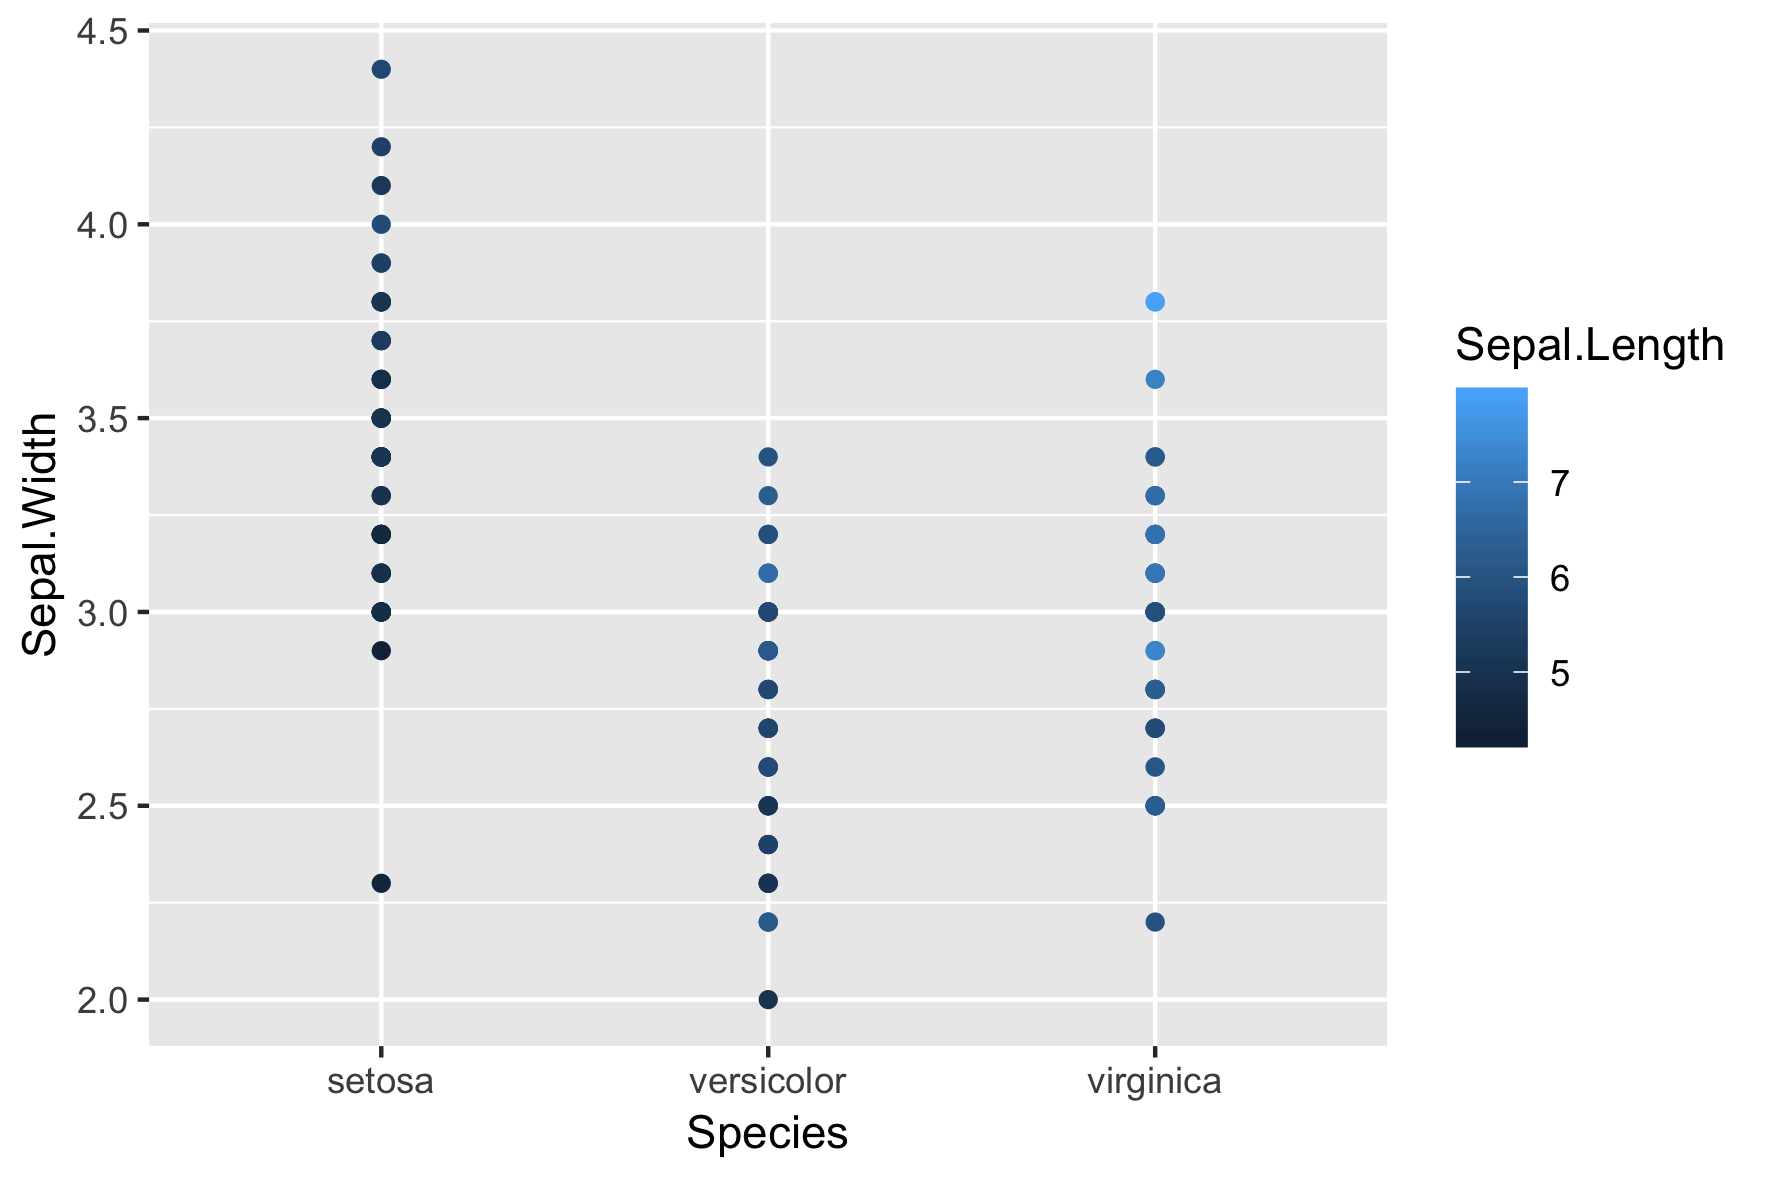
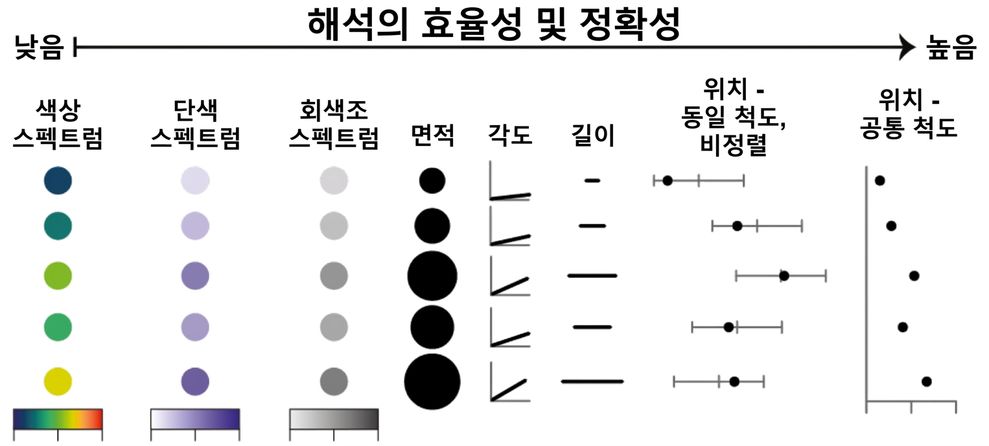
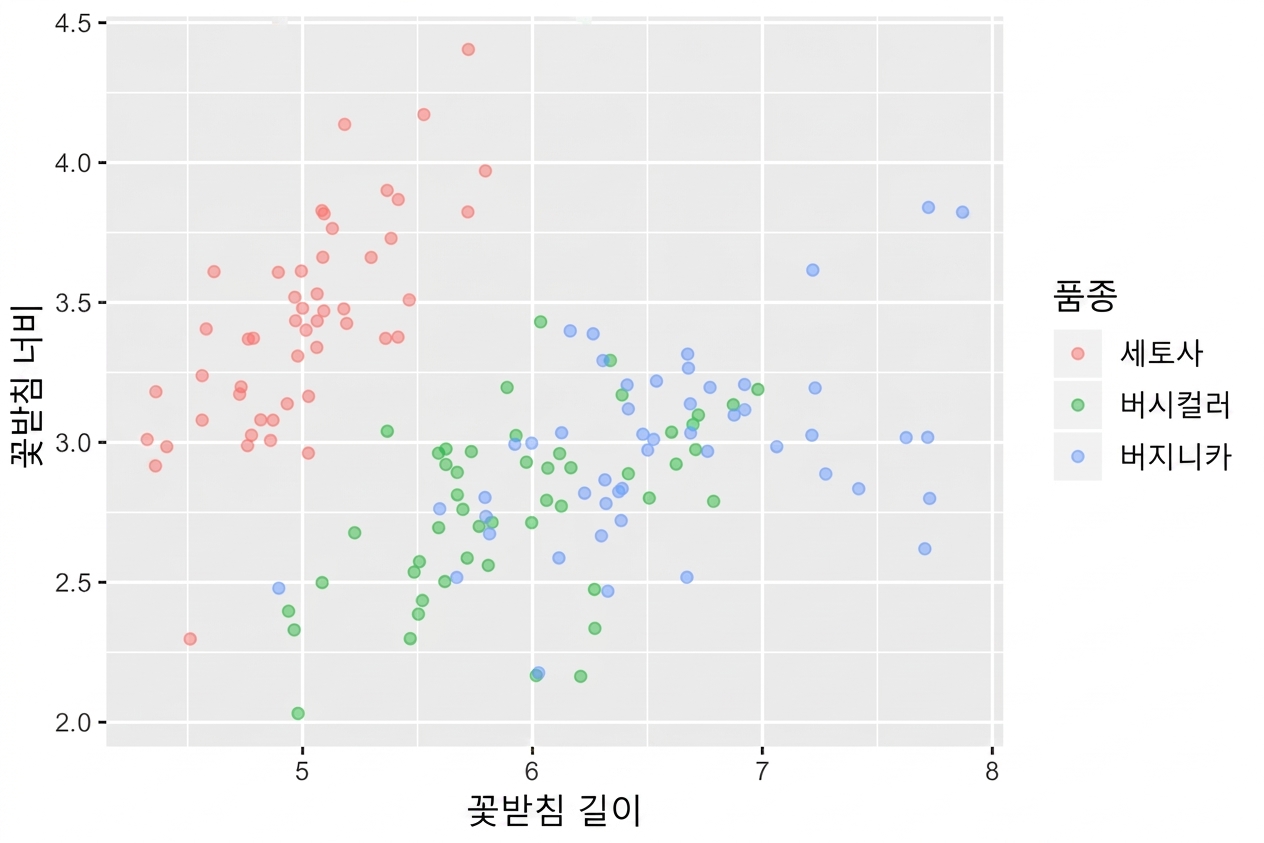
3가지 iris 산포도
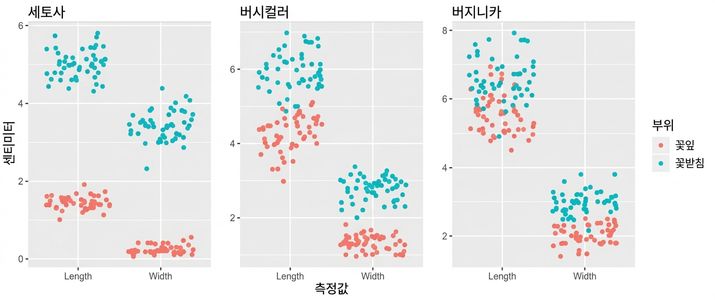
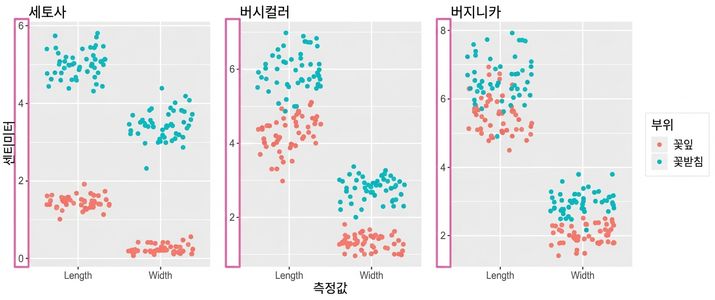
3가지 iris 산포도: y축 불일치
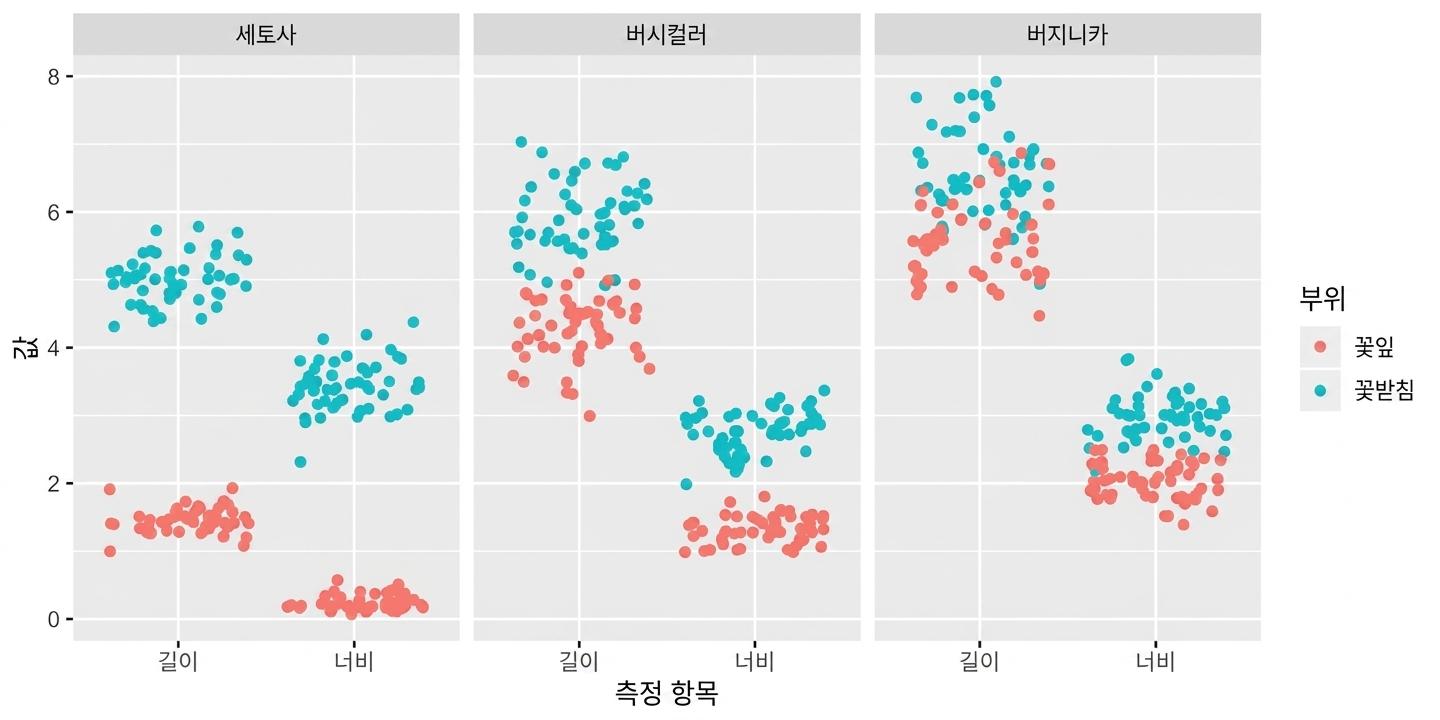
단일 패싯 그래프: 공통 y축
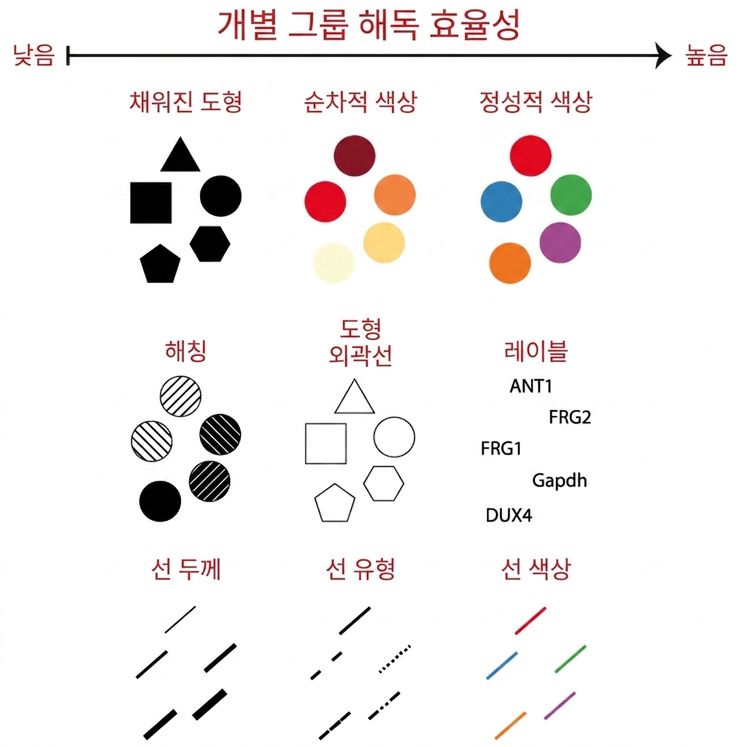
미적 요소 - 범주형 변수
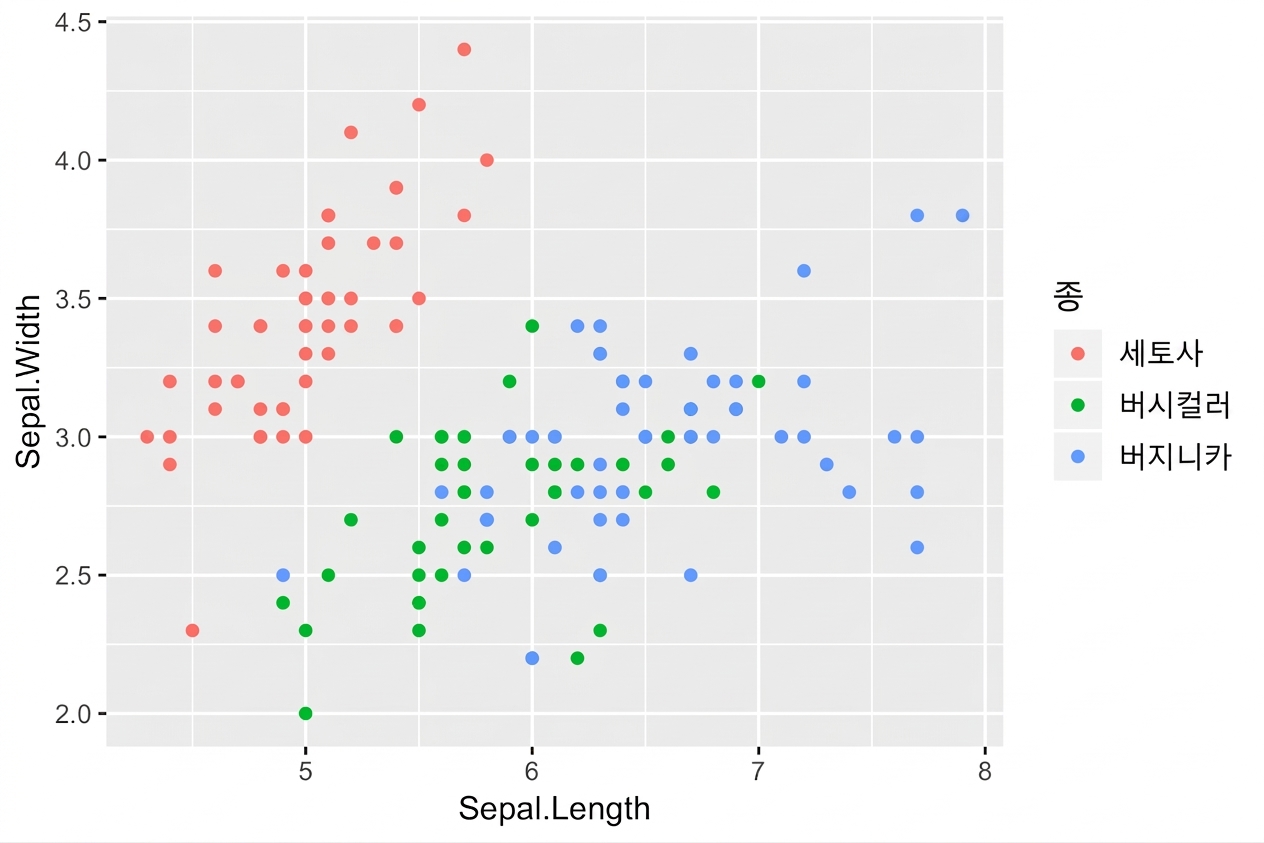
미적 요소 - 범주형 변수
ggplot2로 시작하는 데이터 시각화
Rick Scavetta
Founder, Scavetta Academy

