다음 단계
Matplotlib으로 시작하는 데이터 시각화

Ariel Rokem
Data Scientist
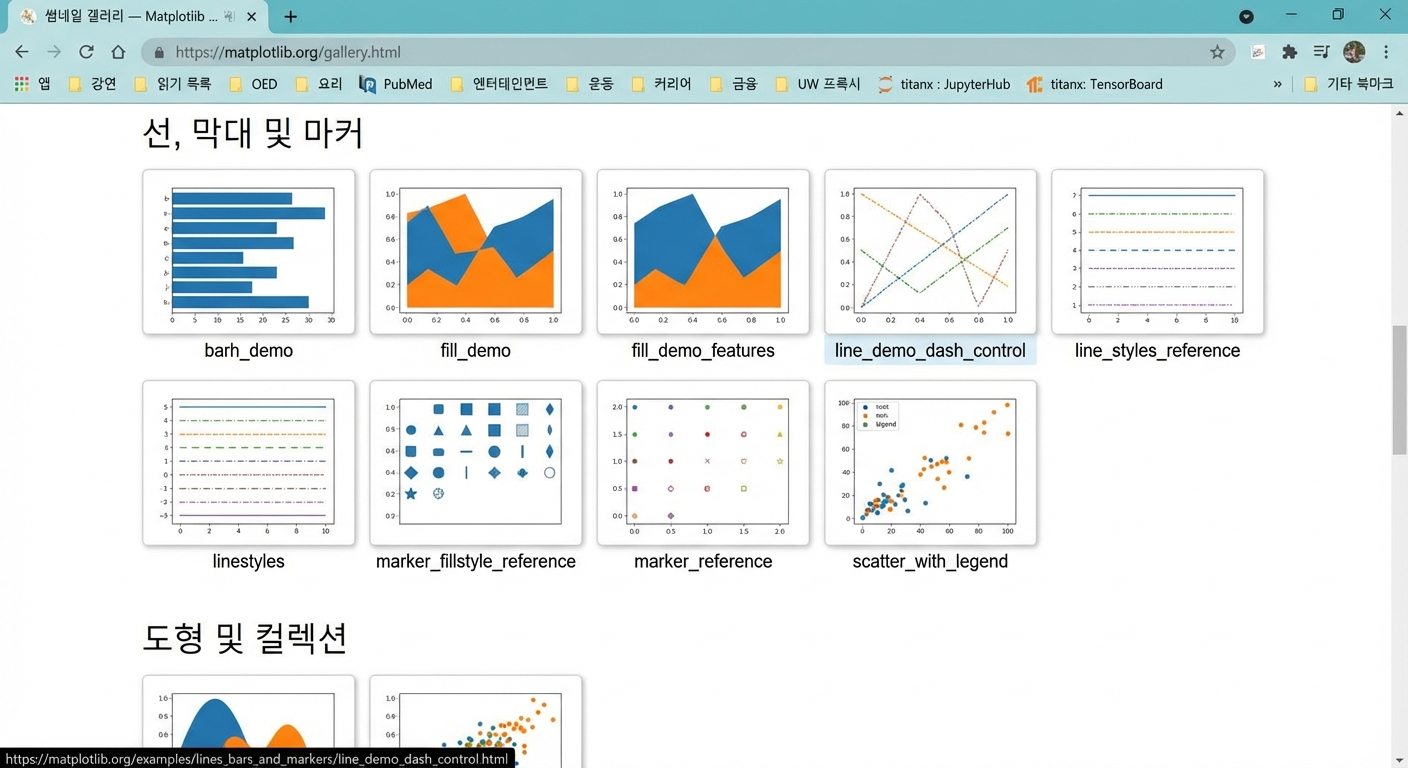
예제 갤러리
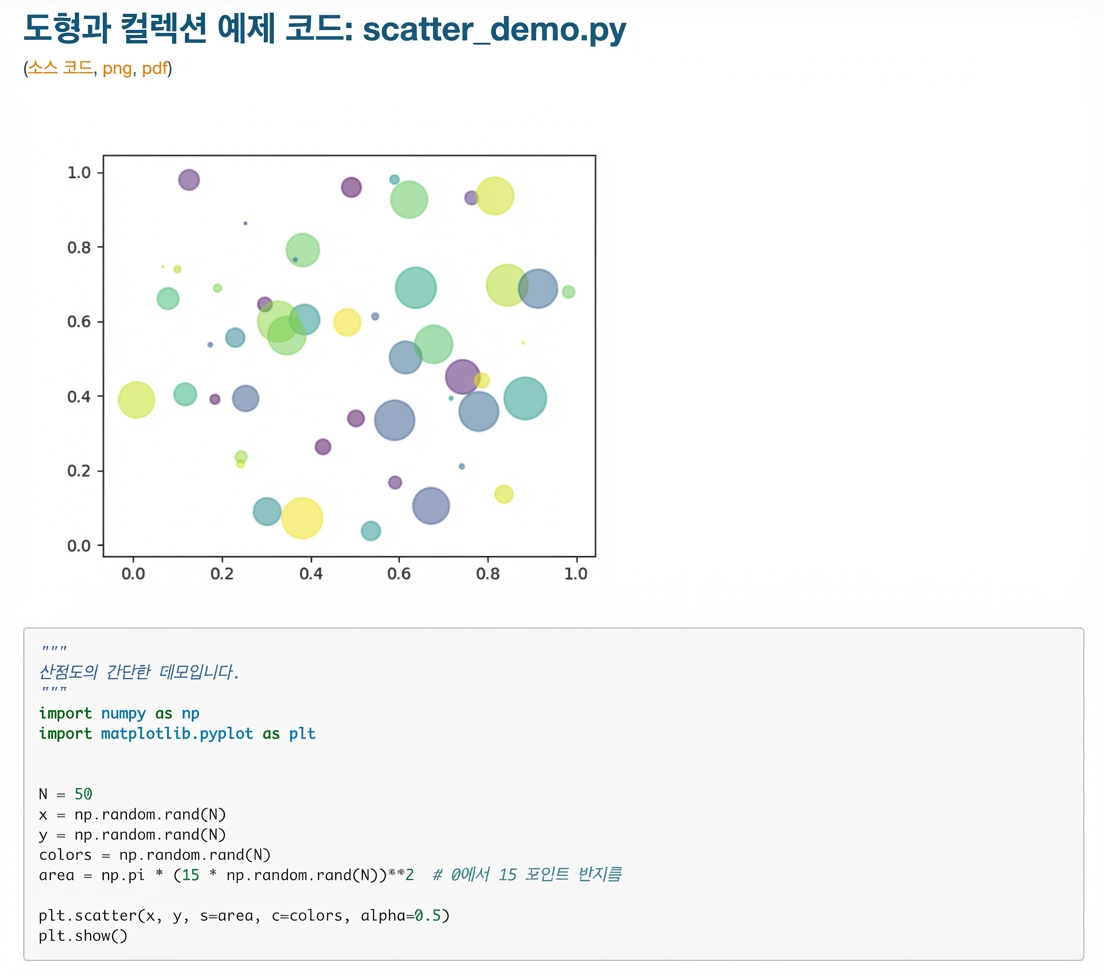
코드 포함 예제 페이지
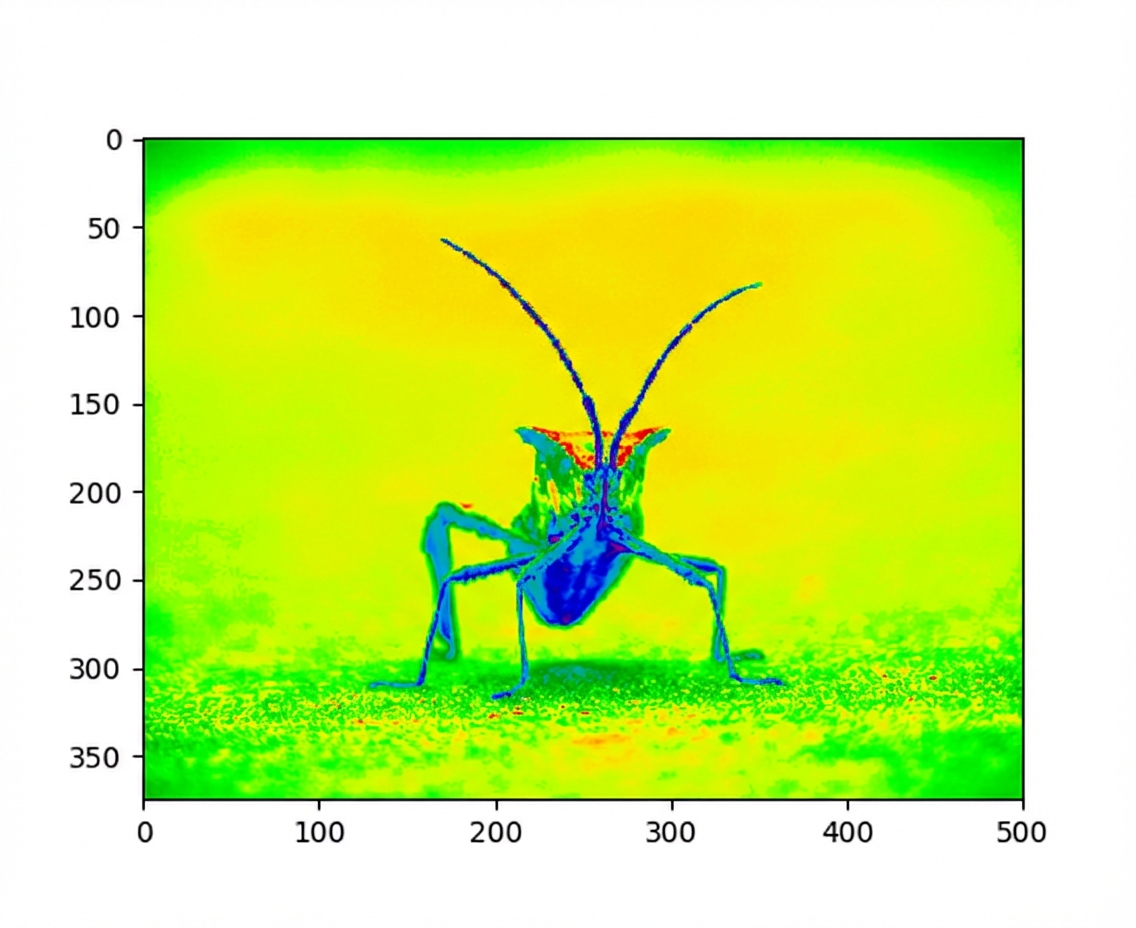
의사색으로 이미지 시각화
애니메이션
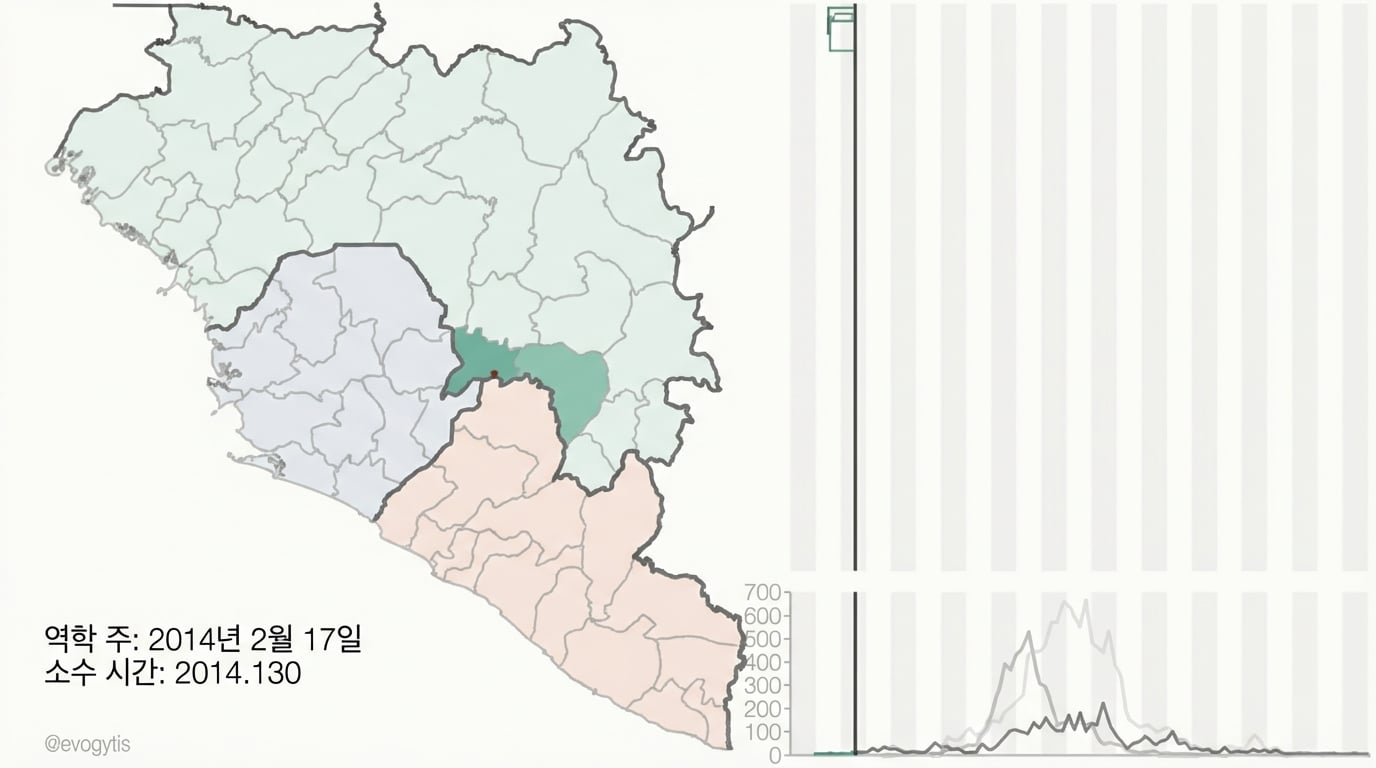
Matplotlib로 지리공간 데이터 다루기

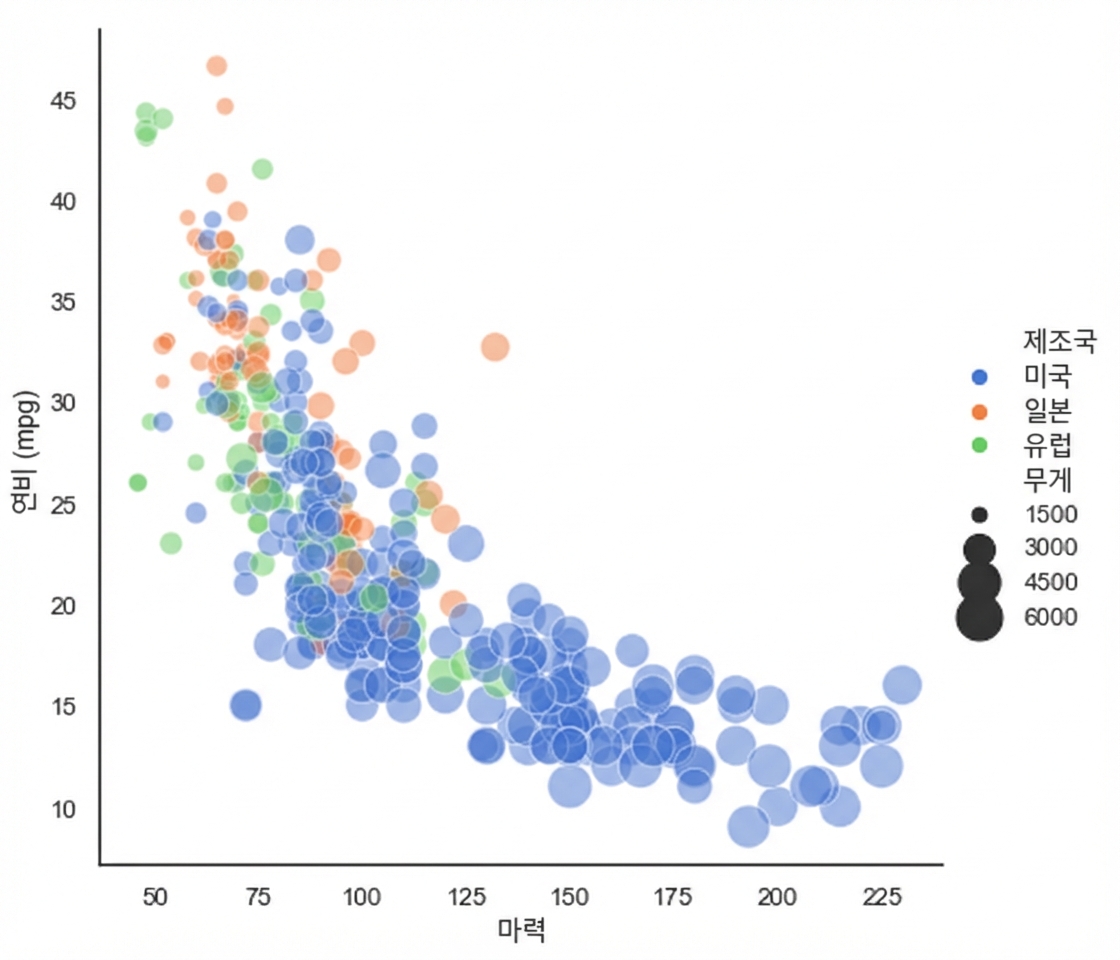
pandas + Matplotlib = Seaborn
seaborn.relplot(x="horsepower", y="mpg", hue="origin", size="weight",
                sizes=(40, 400), alpha=.5, palette="muted",
                height=6, data=mpg)