pandas란?
Python으로 시작하는 데이터 사이언스

Hillary Green-Lerman
Lead Data Scientist, Looker
pandas로 할 수 있는 일
- 다양한 소스에서 표 형식 데이터 불러오기
- 특정 행/열 검색
- 집계 통계 계산
- 여러 소스의 데이터 결합
pandas로 표 데이터 다루기
표 형식 데이터
+-------------------------------------------------+
|        suspect        |     location    | price |
+-----------------------+-----------------+-------+
| Fred Frequentist      | Petroleum Plaza | 24.95 |
| Ronald Aylmer Fisher  | Clothing Club   | 20.15 |
+-------------------------------------------------+
DataFrame
                suspect        location  price
0      Fred Frequentist  Perolium Plaza  24.95
1  Ronald Aylmer Fisher   Clothing Club  20.15
CSV 파일
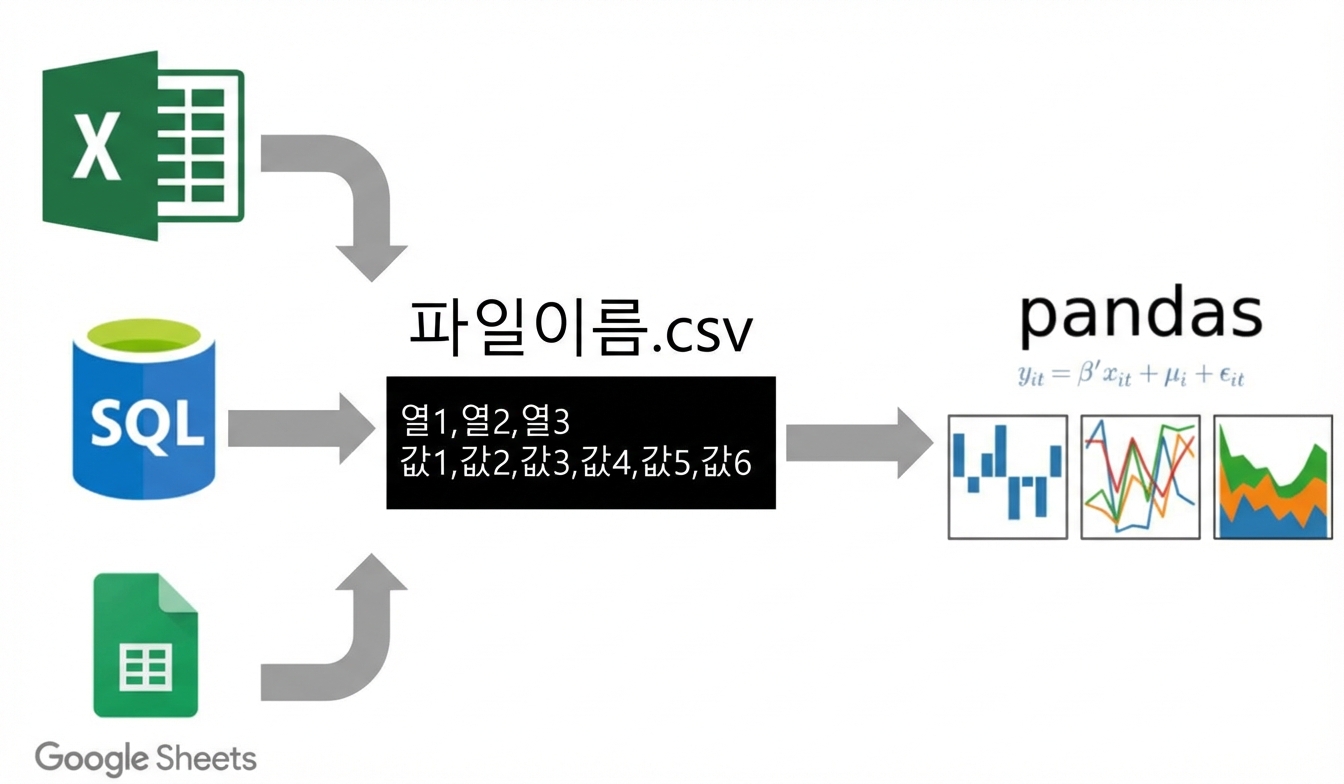
CSV 불러오기
import pandas as pd
df = pd.read_csv('ransom.csv')
DataFrame 출력
df = pd.read_csv('filename.csv')print(df)
                 suspect         location          item  price
0         Kirstine Smith  Petroleum Plaza           gas  24.95
1       Fred Frequentist      Burger Mart         fries   1.95
2           Gertrude Cox      Burger Mart         fries   1.95
3   Ronald Aylmer Fisher    Clothing Club         shirt  14.25
4         Kirstine Smith    Clothing Club         dress  20.15
5       Fred Frequentist   Groceries R Us     cucumbers   2.05
6         Kirstine Smith    Clothing Club         dress  20.15
7           Gertrude Cox  Petroleum Plaza   fizzy drink   1.90
8           Gertrude Cox      Burger Mart         fries   1.95
9   Ronald Aylmer Fisher    Clothing Club         shirt  14.25
10  Ronald Aylmer Fisher  Petroleum Plaza       carwash  13.25
11  Ronald Aylmer Fisher    Clothing Club         shirt  14.25
12        Kirstine Smith  Petroleum Plaza           gas  24.95
13      Fred Frequentist   Groceries R Us          eggs   6.50
14          Gertrude Cox  Petroleum Plaza           gas  24.95
15      Fred Frequentist   Groceries R Us          eggs   6.50
16  Ronald Aylmer Fisher   Groceries R Us          eggs   6.50
17      Fred Frequentist   Groceries R Us        cheese   5.00
DataFrame 살펴보기
df.head()
print(df.head())
                 suspect         location          item  price
0         Kirstine Smith  Petroleum Plaza           gas  24.95
1       Fred Frequentist      Burger Mart         fries   1.95
2           Gertrude Cox      Burger Mart         fries   1.95
3   Ronald Aylmer Fisher    Clothing Club         shirt  14.25
4         Kirstine Smith    Clothing Club         dress  20.15
DataFrame 살펴보기
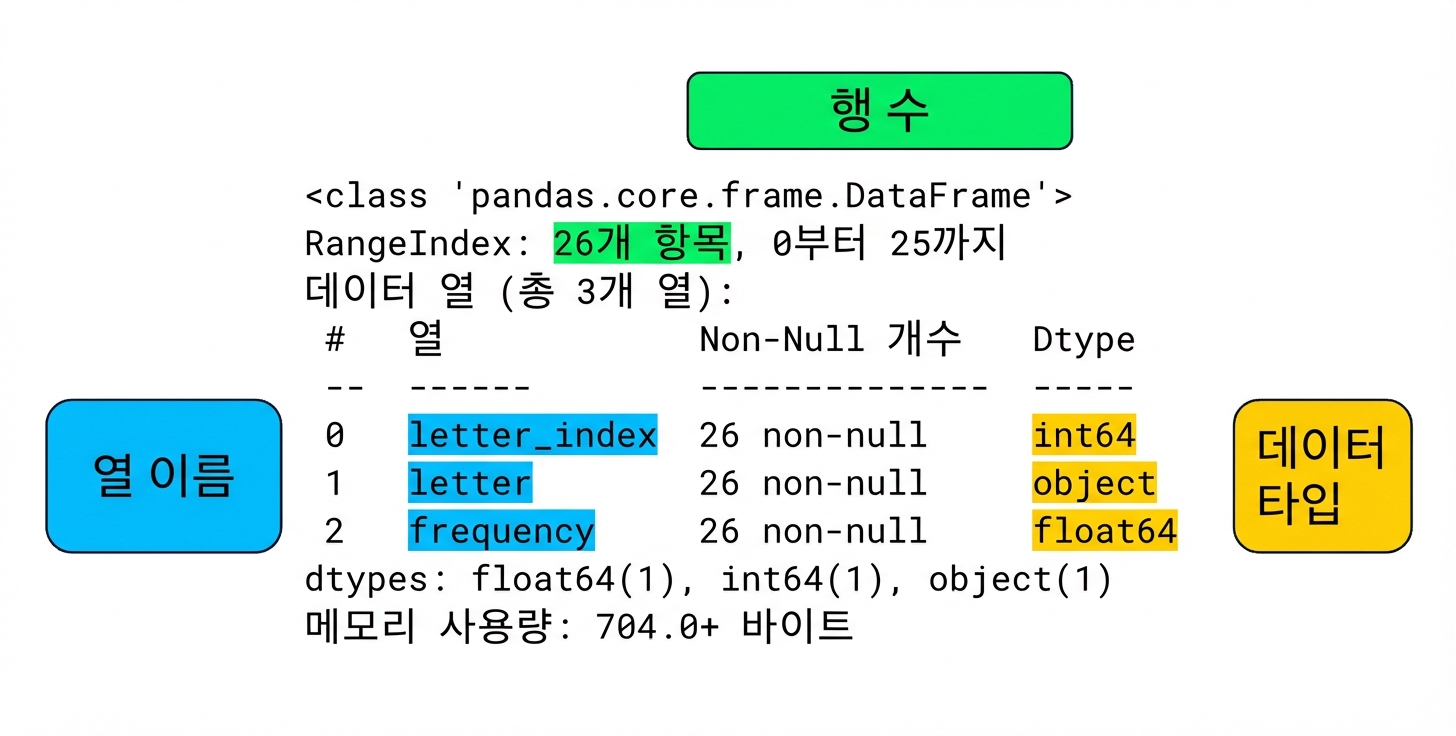
df.info()
print(df.info())
<class 'pandas.core.frame.DataFrame'>
RangeIndex: 26 entries, 0 to 25
Data columns (total 3 columns):
 #   Column        Non-Null Count  Dtype
 --  ------        --------------  -----
 0   letter_index  26 non-null     int64
 1   letter        26 non-null     object
 2   frequency     26 non-null     float64
dtypes: float64(1), int64(1), object(1)
memory usage: 704.0+ bytes
DataFrame 살펴보기
Ayo berlatih!
Python으로 시작하는 데이터 사이언스

