이상치, 레버리지, 영향력

Python에서 statsmodels로 살펴보는 회귀 소개

Maarten Van den Broeck

Content Developer at DataCamp

Roach 데이터셋
roach = fish[fish['species'] == "Roach"]
print(roach.head())
   species  mass_g  length_cm
35   Roach    40.0       12.9
36   Roach    69.0       16.5
37   Roach    78.0       17.5
38   Roach    87.0       18.2
39   Roach   120.0       18.6

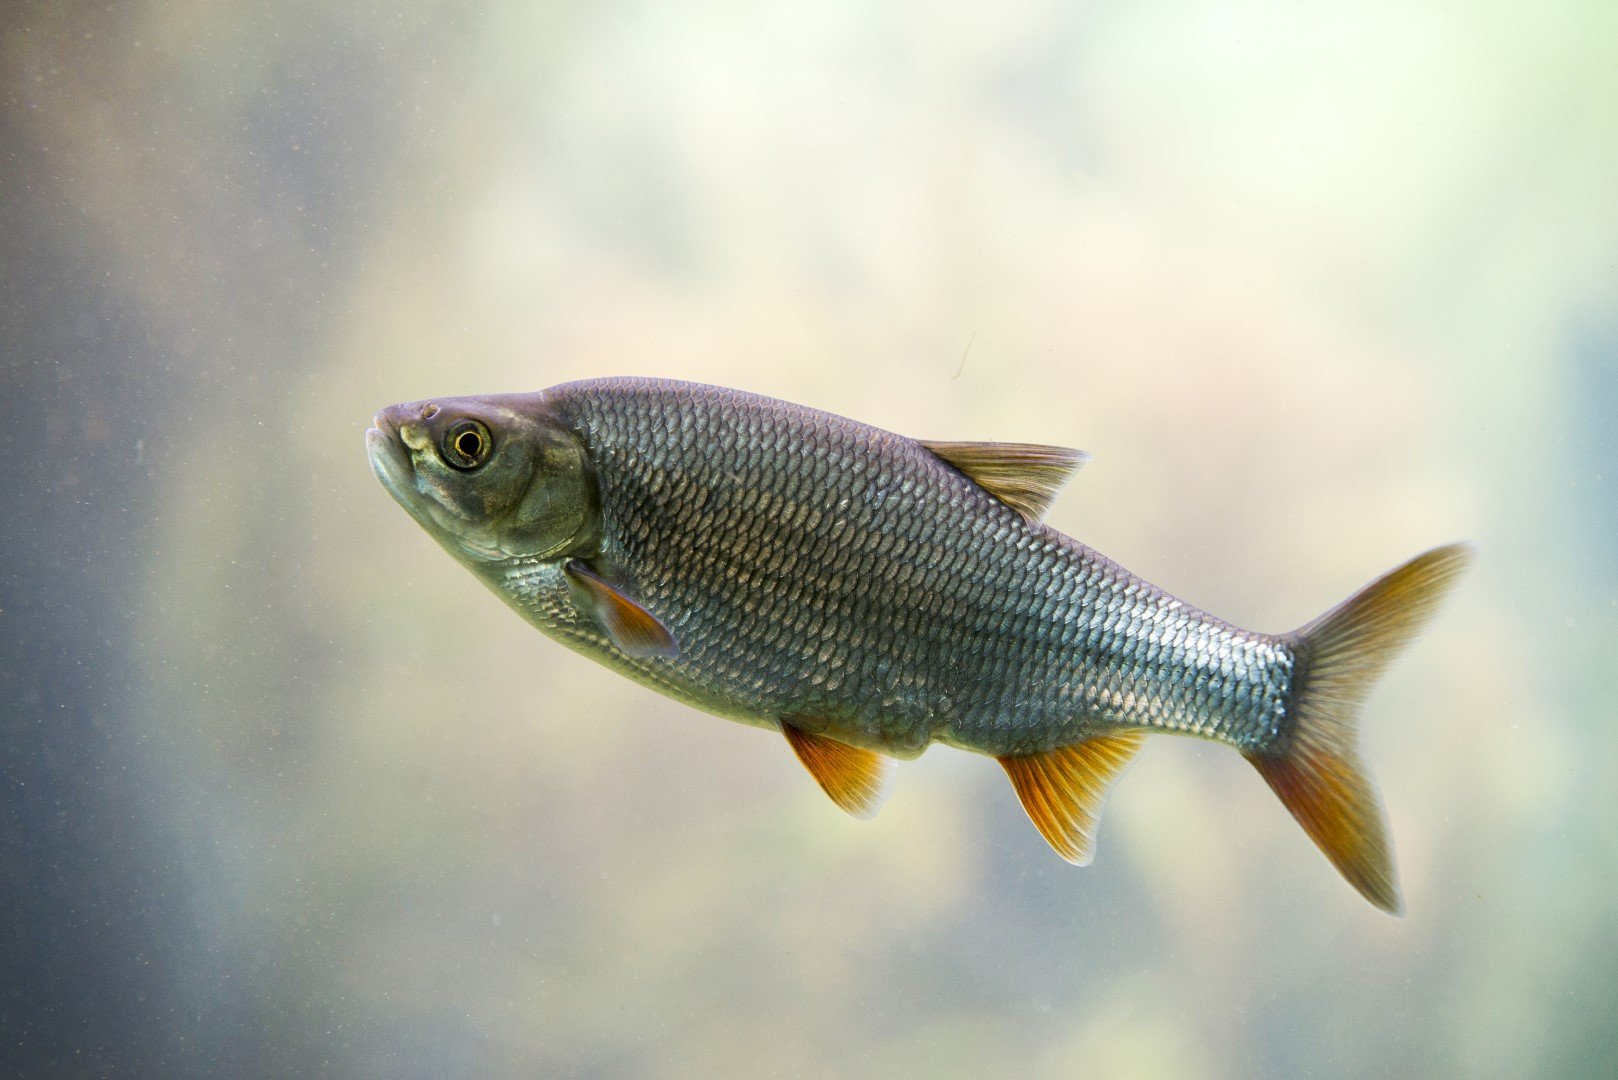
붕어 사진

Python에서 statsmodels로 살펴보는 회귀 소개

어떤 점이 이상치인가요?

sns.regplot(x="length_cm",
            y="mass_g",
            data=roach,
            ci=None)
plt.show()

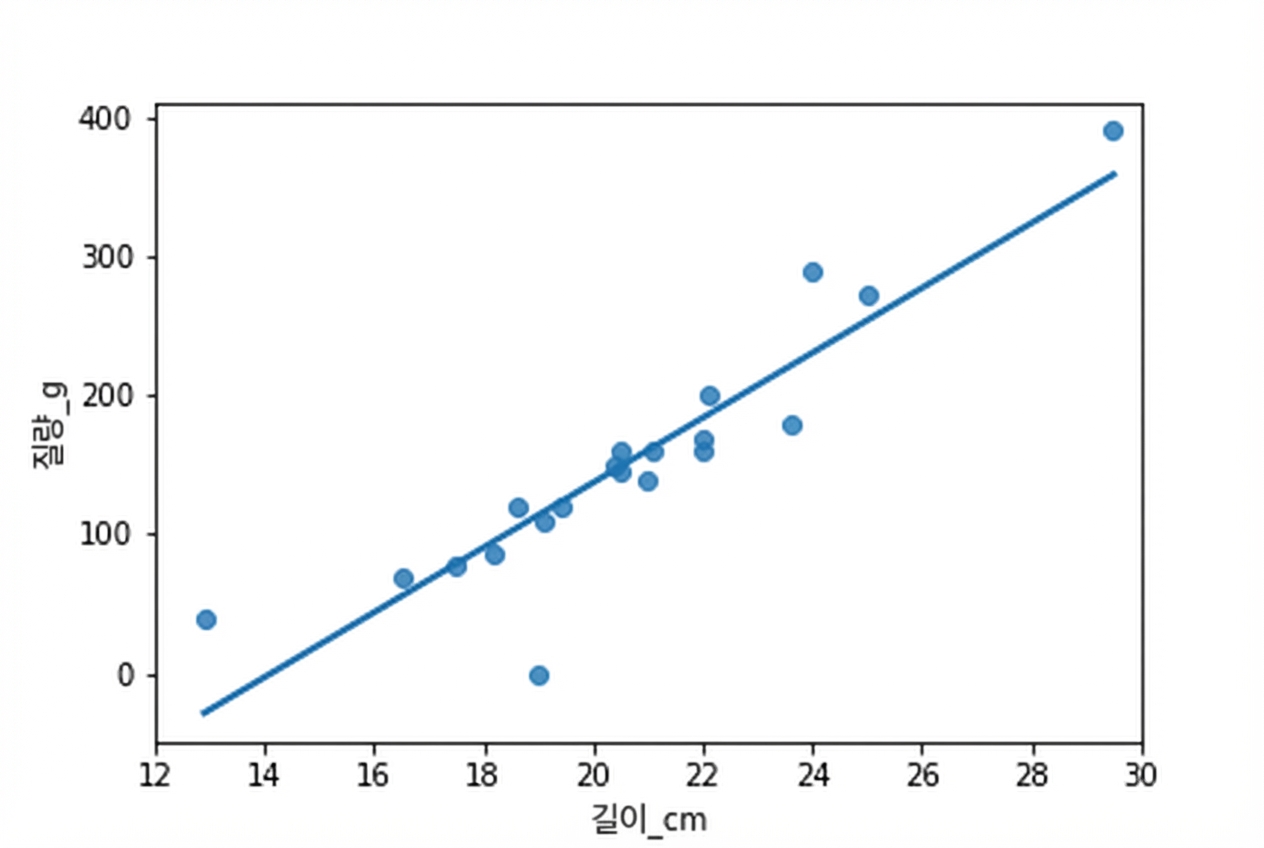
길이에 따른 바퀴벌레 질량 산점도와 추세선. 대부분의 점은 추세선을 잘 따릅니다.

Python에서 statsmodels로 살펴보는 회귀 소개

극단적 설명변수 값

roach["extreme_l"] = ((roach["length_cm"] < 15) |
                    (roach["length_cm"] > 26))

fig = plt.figure()
sns.regplot(x="length_cm",
            y="mass_g",
            data=roach,
            ci=None)

sns.scatterplot(x="length_cm",
                y="mass_g",
                hue="extreme_l",
                data=roach)

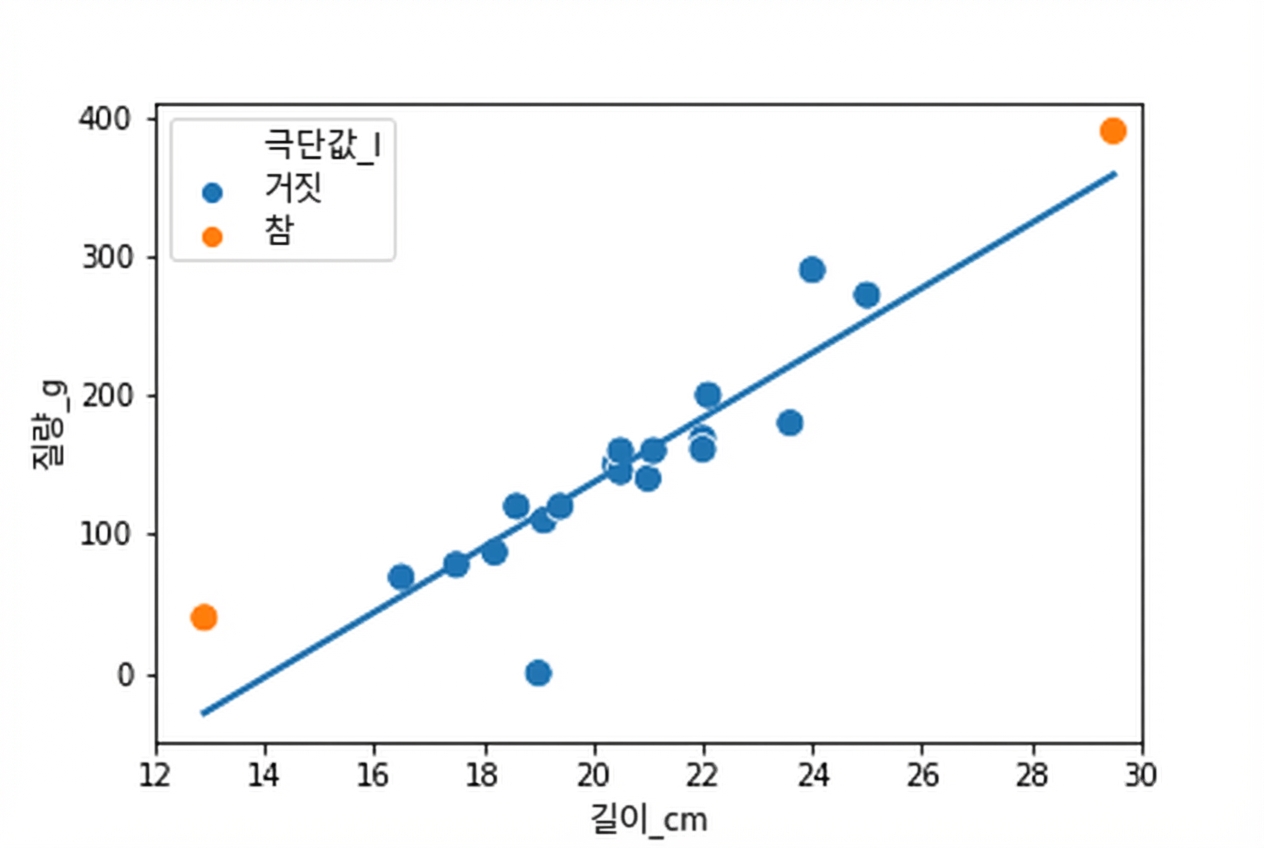
길이에 따른 바퀴벌레 질량 산점도와 추세선. 대부분의 점은 파란색이며, 매우 짧은 개체와 매우 긴 개체 두 점은 주황색입니다.

Python에서 statsmodels로 살펴보는 회귀 소개

회귀선에서 먼 반응값

roach["extreme_m"] = roach["mass_g"] < 1

fig = plt.figure()
sns.regplot(x="length_cm",
            y="mass_g",
            data=roach,
            ci=None)

sns.scatterplot(x="length_cm",
                y="mass_g",
                hue="extreme_l",
                style="extreme_m",
                data=roach)

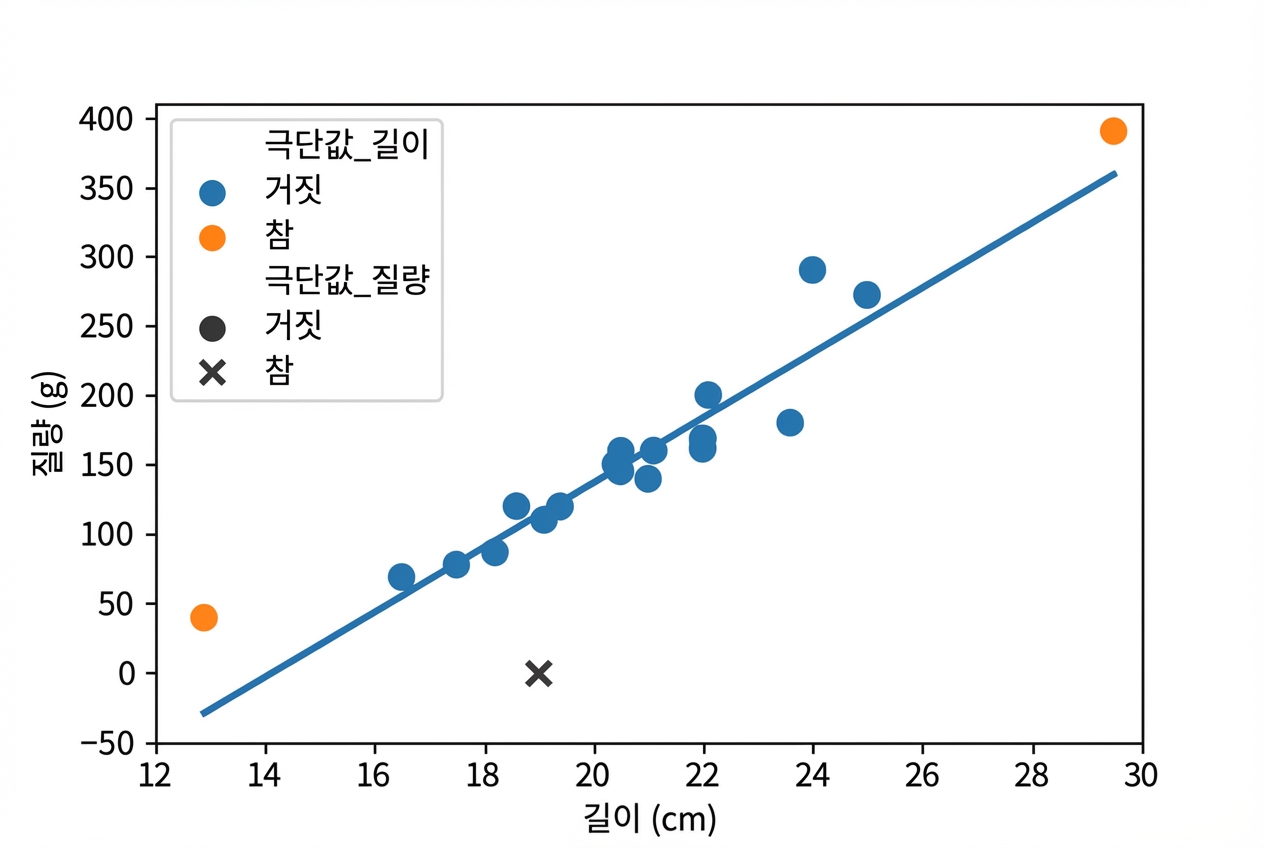
길이에 따른 바퀴벌레 질량 산점도와 추세선. 대부분의 점은 파란색이며, 매우 짧은 개체와 매우 긴 개체 두 점은 주황색입니다. 대부분의 점은 원이지만, 질량이 0으로 보이는 개체 하나는 십자 모양입니다.

Python에서 statsmodels로 살펴보는 회귀 소개

레버리지와 영향력

레버리지는 설명변수 값이 얼마나 극단적인지의 척도입니다.

영향력은 해당 관측치를 제외하고 적합했을 때 모델이 얼마나 달라지는지를 측정합니다.

렌치를 돌리는 사람

Python에서 statsmodels로 살펴보는 회귀 소개

.get_influence() 및 .summary_frame()

mdl_roach = ols("mass_g ~ length_cm", data=roach).fit()

summary_roach = mdl_roach.get_influence().summary_frame()
roach["leverage"] = summary_roach["hat_diag"] print(roach.head())
   species  mass_g  length_cm  leverage
35   Roach    40.0       12.9  0.313729
36   Roach    69.0       16.5  0.125538
37   Roach    78.0       17.5  0.093487
38   Roach    87.0       18.2  0.076283
39   Roach   120.0       18.6  0.068387
Python에서 statsmodels로 살펴보는 회귀 소개

Cook의 거리

Cook의 거리(Cook's distance)는 가장 일반적인 영향력 지표입니다.

roach["cooks_dist"] = summary_roach["cooks_d"]
print(roach.head())
   species  mass_g  length_cm  leverage  cooks_dist
35   Roach    40.0       12.9  0.313729    1.074015
36   Roach    69.0       16.5  0.125538    0.010429
37   Roach    78.0       17.5  0.093487    0.000020
38   Roach    87.0       18.2  0.076283    0.001980
39   Roach   120.0       18.6  0.068387    0.006610
Python에서 statsmodels로 살펴보는 회귀 소개

가장 영향력이 큰 관측치(roach)

print(roach.sort_values("cooks_dist", ascending = False))
   species  mass_g  length_cm  leverage  cooks_dist
35   Roach    40.0       12.9  0.313729    1.074015 # 매우 짧은 바퀴벌레
54   Roach   390.0       29.5  0.394740    0.365782 # 매우 긴 바퀴벌레
40   Roach     0.0       19.0  0.061897    0.311852 # 질량이 0인 바퀴벌레
52   Roach   290.0       24.0  0.099488    0.150064
51   Roach   180.0       23.6  0.088391    0.061209
..     ...     ...        ...       ...         ...
43   Roach   150.0       20.4  0.050264    0.000257
44   Roach   145.0       20.5  0.050092    0.000256
42   Roach   120.0       19.4  0.056815    0.000199
47   Roach   160.0       21.1  0.050910    0.000137
37   Roach    78.0       17.5  0.093487    0.000020
Python에서 statsmodels로 살펴보는 회귀 소개

가장 영향력 큰 관측치 제거하기

roach_not_short = roach[roach["length_cm"] != 12.9]

sns.regplot(x="length_cm",
            y="mass_g",
            data=roach,
            ci=None,
            line_kws={"color": "green"})

sns.regplot(x="length_cm",
            y="mass_g",
            data=roach_not_short,
            ci=None,
            line_kws={"color": "red"})

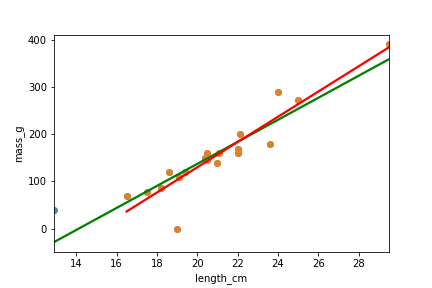
길이에 따른 바퀴벌레 질량 산점도와 두 개의 추세선. 하나는 전체 데이터, 다른 하나는 가장 짧은 개체를 제외. 두 번째 선의 기울기가 더 큽니다.

Python에서 statsmodels로 살펴보는 회귀 소개

Ayo berlatih!

Python에서 statsmodels로 살펴보는 회귀 소개

Preparing Video For Download...