표본 분포와 부트스트랩 분포 비교
Python으로 살펴보는 표본추출(Sampling)

James Chapman
Curriculum Manager, DataCamp
커피 중심 하위집합
coffee_sample = coffee_ratings[["variety", "country_of_origin", "flavor"]]\
    .reset_index().sample(n=500)
     index         variety       country_of_origin  flavor
132    132           Other              Costa Rica    7.58
51      51            None  United States (Hawaii)    8.17
42      42  Yellow Bourbon                  Brazil    7.92
569    569         Bourbon               Guatemala    7.67
..     ...             ...                     ...     ...
643    643          Catuai              Costa Rica    7.42
356    356         Caturra                Colombia    7.58
494    494            None               Indonesia    7.58
169    169            None                  Brazil    7.81

[500 rows x 4 columns]
커피 풍미 평균의 부트스트랩
import numpy as np
mean_flavors_5000 = []
for i in range(5000):
    mean_flavors_5000.append(
        np.mean(coffee_sample.sample(frac=1, replace=True)['flavor'])
    )
bootstrap_distn = mean_flavors_5000
풍미 평균의 부트스트랩 분포
import matplotlib.pyplot as plt
plt.hist(bootstrap_distn, bins=15)
plt.show()
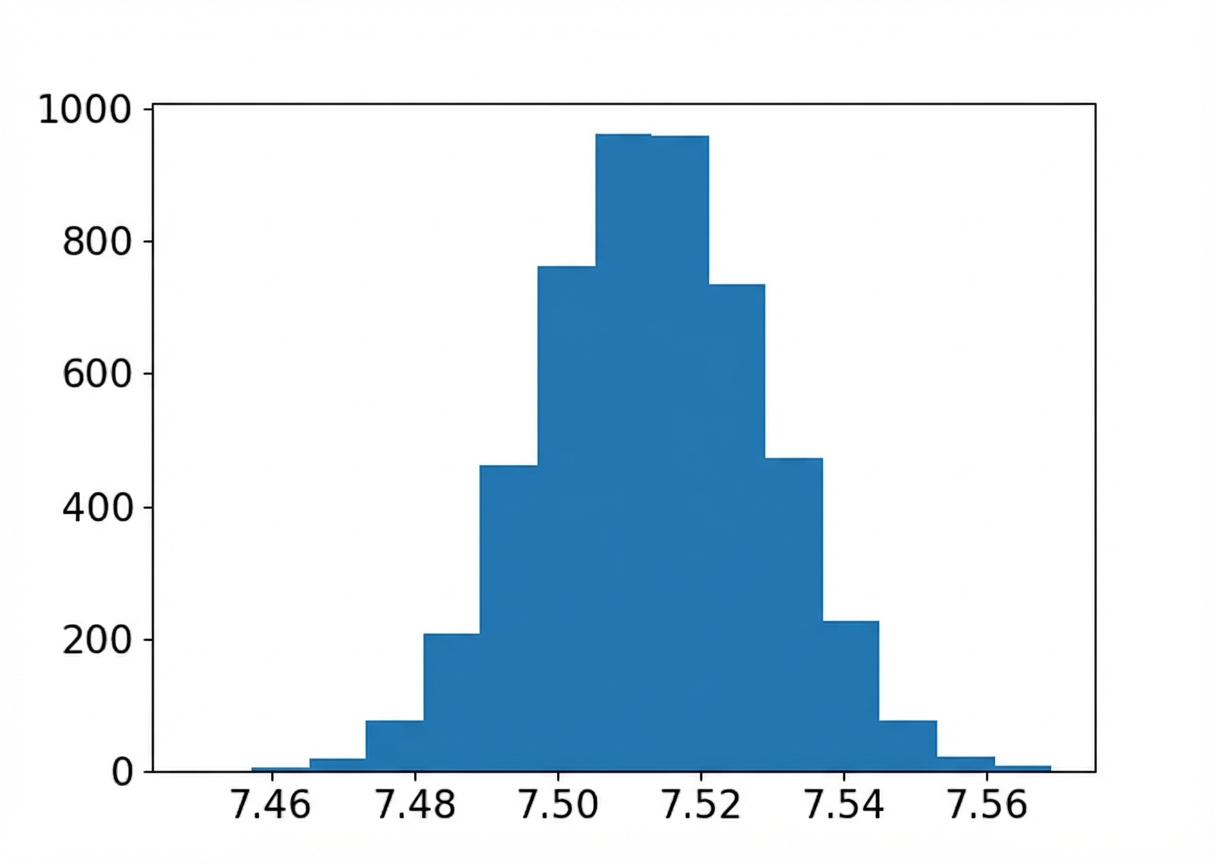
표본, 부트스트랩 분포, 모집단 평균
표본평균:
coffee_sample['flavor'].mean()
7.5132200000000005
모집단 평균의 추정값:
np.mean(bootstrap_distn)
7.513357731999999
진짜 모집단 평균:
coffee_ratings['flavor'].mean()
7.526046337817639
평균 해석
부트스트랩 분포의 평균:
- 보통 표본평균에 가까움
- 모집단 평균의 좋은 추정치가 아닐 수 있음
부트스트래핑은 표집 편향을 교정하지 못함
표본 sd vs. 부트스트랩 분포 sd
표본 표준편차:
coffee_sample['flavor'].std()
0.3540883911928703
모집단 표준편차의 추정값?
np.std(bootstrap_distn, ddof=1)
0.015768474367958217
표본, 부트스트랩 분포, 모집단 표준편차
표본 표준편차:
coffee_sample['flavor'].std()
0.3540883911928703
모집단 표준편차 추정:
standard_error = np.std(bootstrap_distn, ddof=1)
표준오차는 관심 통계량의 표준편차입니다
진짜 표준편차:
coffee_ratings['flavor'].std(ddof=0)
0.34125481224622645
standard_error * np.sqrt(500)
0.3525938058821761
표준오차 × 표본크기의 제곱근 ≈ 모집단 표준편차
표준오차 해석
- 추정 표준오차 → 표본 통계량에 대한 부트스트랩 분포의 표준편차
- $\text{모집단 표준편차} \approx \text{표준오차} \times \sqrt{\text{표본크기}}$
연습해 봅시다!
Python으로 살펴보는 표본추출(Sampling)

