Python으로 살펴보는 표본추출(Sampling)
James Chapman
Curriculum Manager, DataCamp
coffee_ratings.sample(n=30)['total_cup_points'].mean()
82.53066666666668
81.97566666666667
82.68
81.675
mean_cup_points_1000 = []

for i in range(1000):
    mean_cup_points_1000.append(
        coffee_ratings.sample(n=30)['total_cup_points'].mean()
    )

print(mean_cup_points_1000)
mean_cup_points_1000 = []
for i in range(1000): mean_cup_points_1000.append( coffee_ratings.sample(n=30)['total_cup_points'].mean() )
print(mean_cup_points_1000)
[82.11933333333333, 82.55300000000001, 82.07266666666668, 81.76966666666667,
...
 82.74166666666666, 82.45033333333335, 81.77199999999999, 82.8163333333333]
import matplotlib.pyplot as plt
plt.hist(mean_cup_points_1000, bins=30)
plt.show()
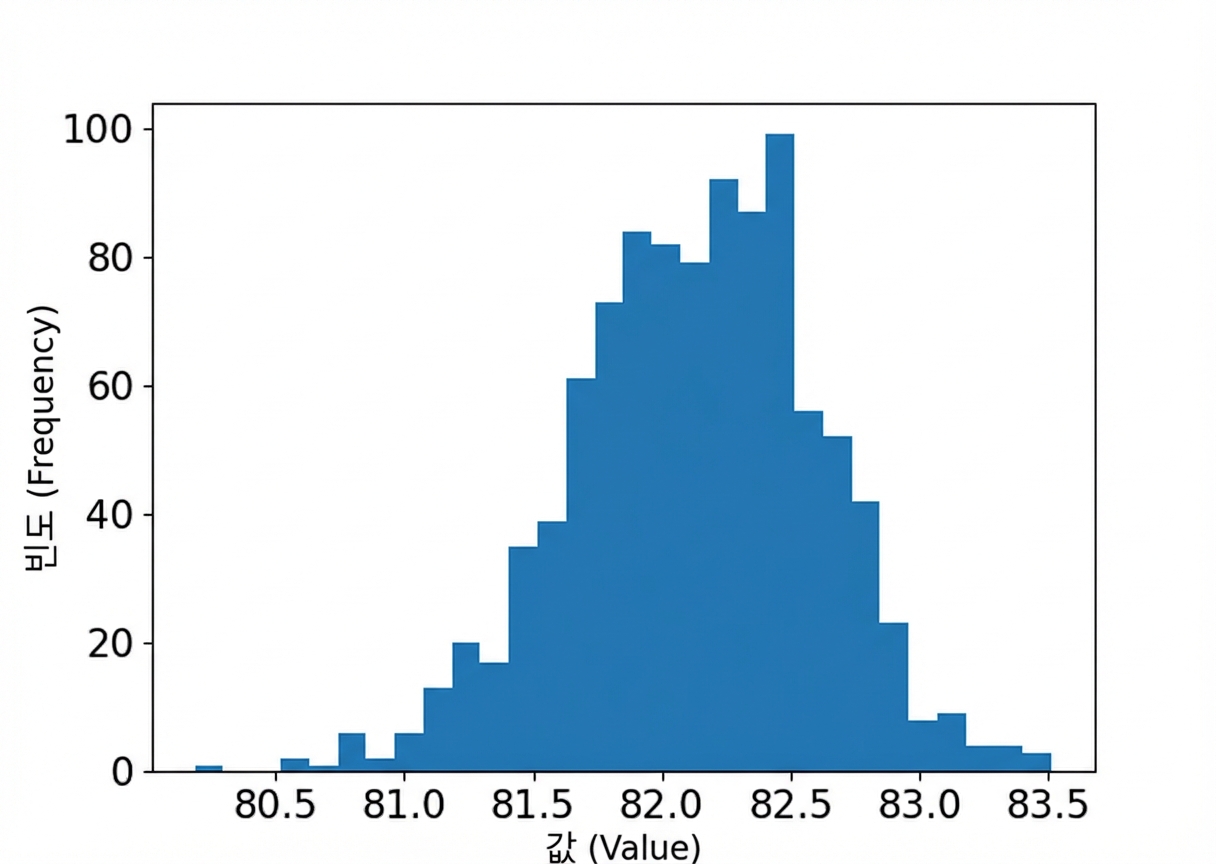
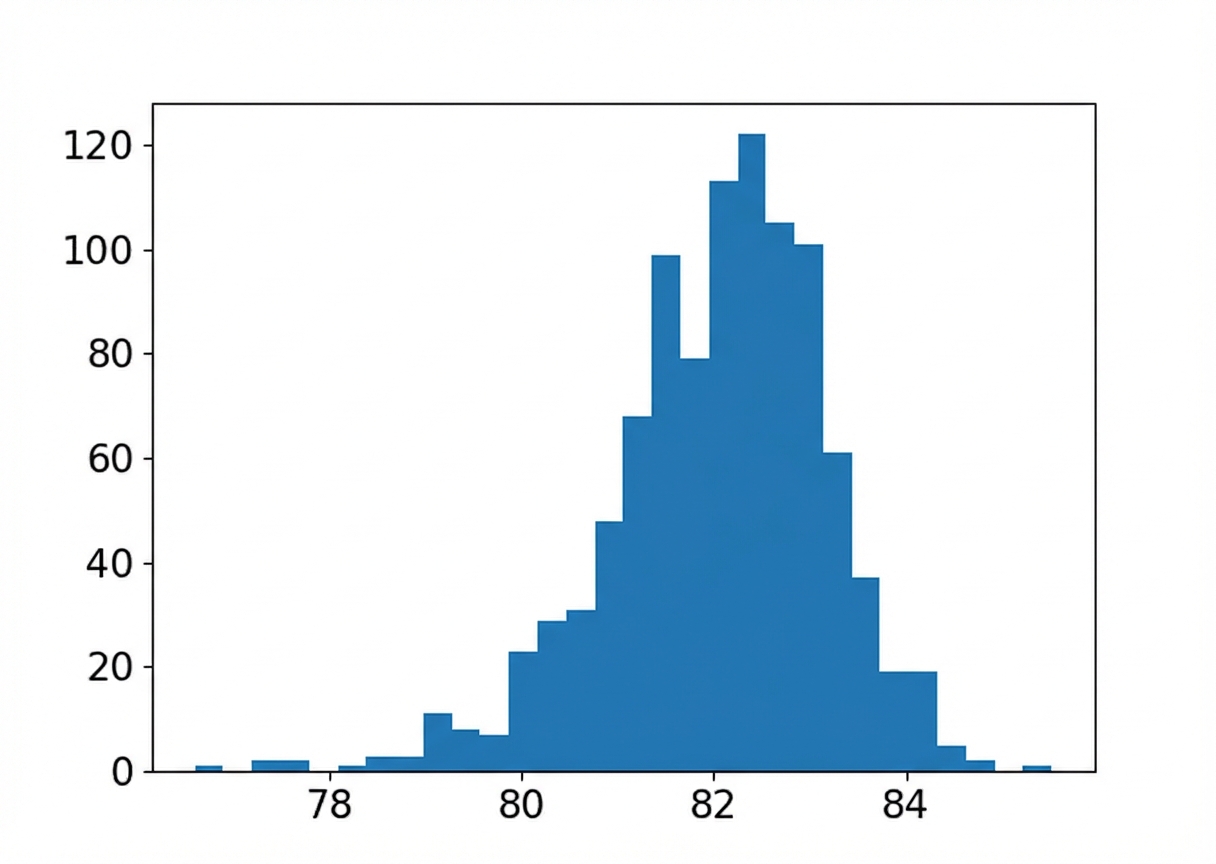
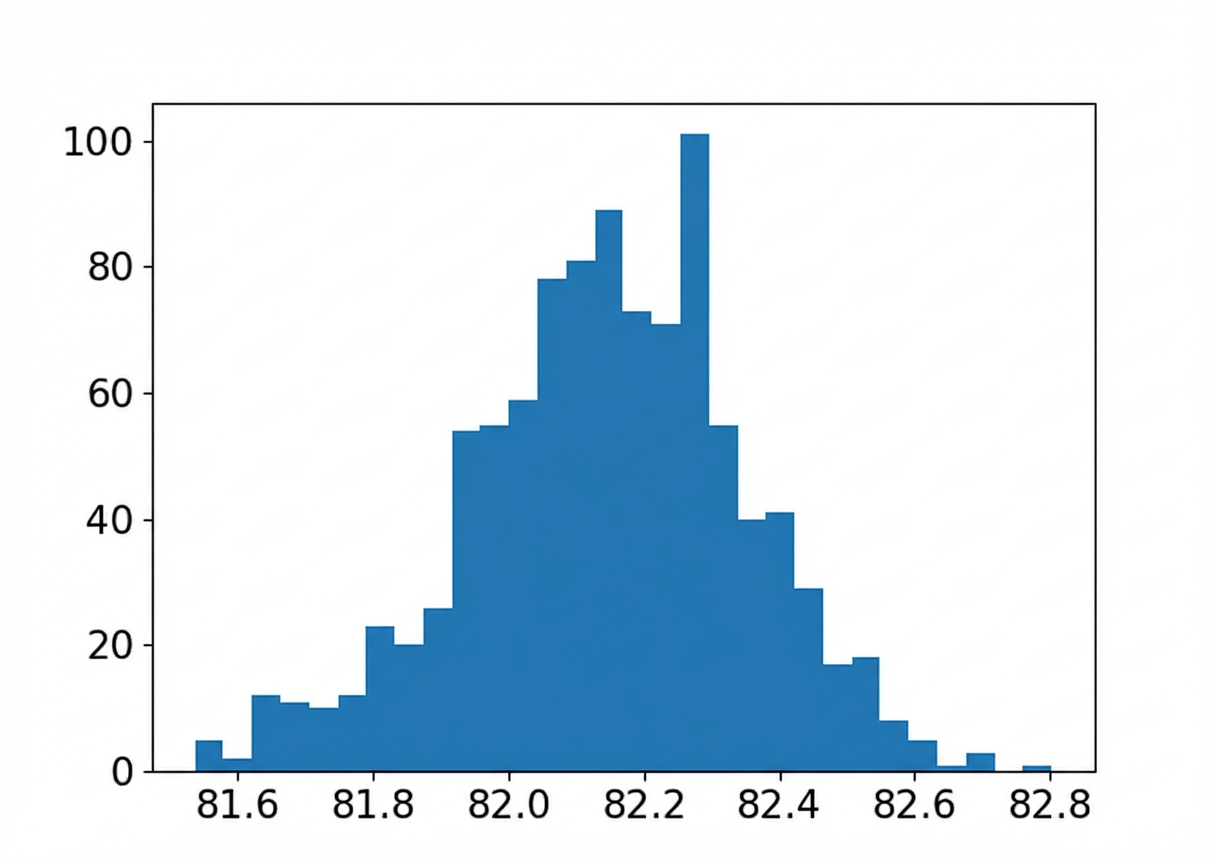
표본분포(sampling distribution)는 점추정치 복제본들의 분포입니다.
표본 크기: 6
표본 크기: 150