대응 t-검정
Python으로 배우는 가설 검정

James Chapman
Curriculum Manager, DataCamp
미국 공화당 대통령 선거 데이터셋
         state       county  repub_percent_08  repub_percent_12
0      Alabama         Hale         38.957877         37.139882
1     Arkansas       Nevada         56.726272         58.983452
2   California         Lake         38.896719         39.331367
3   California      Ventura         42.923190         45.250693
..         ...          ...               ...               ...
96   Wisconsin    La Crosse         37.490904         40.577038
97   Wisconsin    Lafayette         38.104967         41.675050
98     Wyoming       Weston         76.684241         83.983328
99      Alaska  District 34         77.063259         40.789626

[100 rows x 4 columns]
100개 행; 각 행은 대선의 군(county) 수준 득표 데이터를 나타냅니다.
1 https://dataverse.harvard.edu/dataset.xhtml?persistentId=doi:10.7910/DVN/VOQCHQ
가설
질문: 2008년 공화당 후보 득표율이 2012년보다 낮았는가?
$H_{0}$: $\mu_{2008} - \mu_{2012} = 0$
$H_{A}$: $\mu_{2008} - \mu_{2012} < 0$
유의수준 $\alpha = 0.05$ 설정.
- 데이터는 대응 형태 → 각 득표율은 동일한 군(county)을 나타냄
- 모델에서 투표 패턴 포착 필요
두 표본에서 하나로
sample_data = repub_votes_potus_08_12
sample_data['diff'] = sample_data['repub_percent_08'] - sample_data['repub_percent_12']
import matplotlib.pyplot as plt
sample_data['diff'].hist(bins=20)
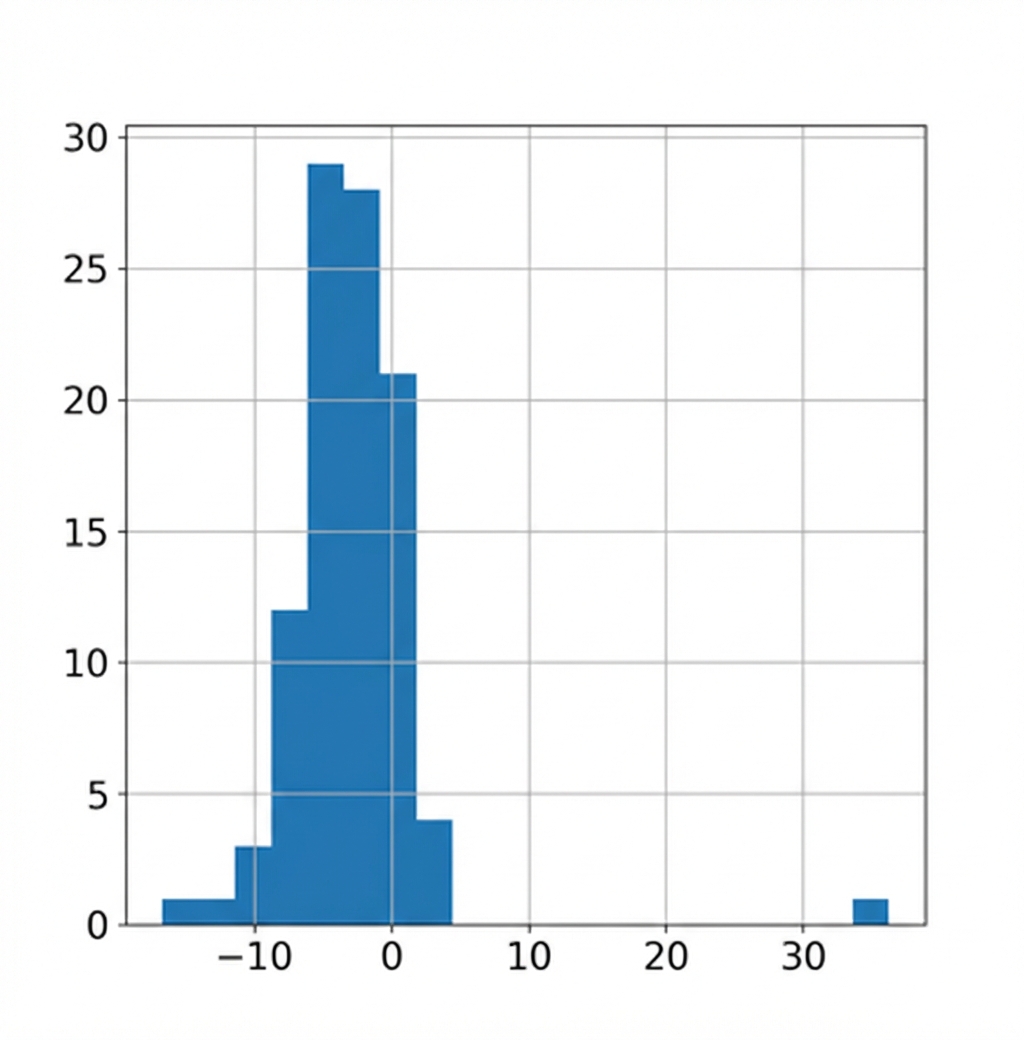
차이의 표본 통계량 계산
xbar_diff = sample_data['diff'].mean()
-2.877109041242944
수정된 가설
기존 가설:
$H_{0}$: $\mu_{2008} - \mu_{2012} = 0$
$H_{A}$: $\mu_{2008} - \mu_{2012} < 0$
새로운 가설:
$H_{0}$: $\mu_{\text{diff}} = 0$
$H_{A}$: $ \mu_{\text{diff}} < 0$
$t = \dfrac{\bar{x}_{\text{diff}} - \mu_{\text{diff}}}{\sqrt{\dfrac{s_{diff}^2}{n_{\text{diff}}}}}$
$df = n_{diff} - 1$
p-값 계산
n_diff = len(sample_data)
100
s_diff = sample_data['diff'].std()
t_stat = (xbar_diff-0) / np.sqrt(s_diff**2/n_diff)
-5.601043121928489
degrees_of_freedom = n_diff - 1
99
$t = \dfrac{\bar{x}_{\text{diff}} - \mu_{\text{diff}}}{\sqrt{\dfrac{s_{\text{diff}}^2}{n_{\text{diff}}}}}$
$df = n_{\text{diff}} - 1$
from scipy.stats import t
p_value = t.cdf(t_stat, df=n_diff-1)
9.572537285272411e-08
ttest()를 이용한 두 평균 차이 검정
import pingouinpingouin.ttest(x=sample_data['diff'],y=0,alternative="less")
               T  dof alternative         p-val          CI95%   cohen-d  \
T-test -5.601043   99        less  9.572537e-08  [-inf, -2.02]  0.560104

             BF10  power
T-test  1.323e+05    1.0
1 pingouin.ttest()의 반환값에 대한 자세한 내용은 pingouin API 문서(https://pingouin-stats.org/generated/pingouin.ttest.html#pingouin.ttest)에서 확인할 수 있습니다.
paired=True를 사용한 ttest()
pingouin.ttest(x=sample_data['repub_percent_08'],
               y=sample_data['repub_percent_12'],
               paired=True,
               alternative="less")
               T  dof alternative         p-val          CI95%   cohen-d  \
T-test -5.601043   99        less  9.572537e-08  [-inf, -2.02]  0.217364

             BF10     power
T-test  1.323e+05  0.696338
비대응 ttest()
pingouin.ttest(x=sample_data['repub_percent_08'],
               y=sample_data['repub_percent_12'],
               paired=False, # The default
               alternative="less")
               T  dof alternative     p-val         CI95%   cohen-d   BF10  \
T-test -1.536997  198        less  0.062945  [-inf, 0.22]  0.217364  0.927

           power
T-test  0.454972
- 대응 데이터에 비대응 t-검정을 적용하면 위음성 오류 가능성이 높아집니다
연습해 봅시다!
Python으로 배우는 가설 검정

