Python으로 배우는 가설 검정
James Chapman
Curriculum Manager, DataCamp

대조군:

처리군:

import pandas as pd
print(stack_overflow)
respondent age_1st_code ... age hobbyist
0 36.0 30.0 ... 34.0 Yes
1 47.0 10.0 ... 53.0 Yes
2 69.0 12.0 ... 25.0 Yes
3 125.0 30.0 ... 41.0 Yes
4 147.0 15.0 ... 28.0 No
... ... ... ... ... ...
2259 62867.0 13.0 ... 33.0 Yes
2260 62882.0 13.0 ... 28.0 Yes
[2261 rows x 8 columns]
가설:
데이터 과학자 모집단의 평균 연간 보상은 $110,000이다
점 추정값(표본 통계량):
mean_comp_samp = stack_overflow['converted_comp'].mean()
119574.71738168952
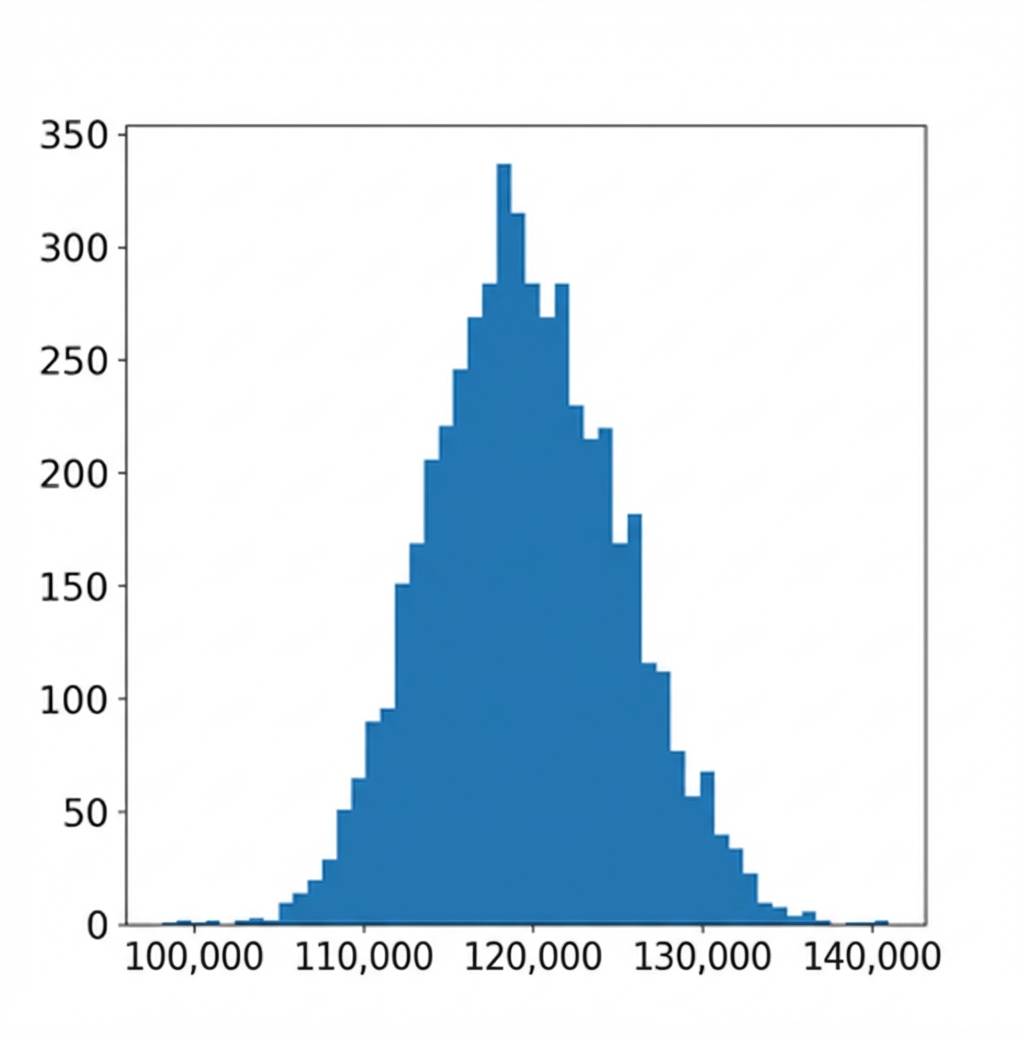
import numpy as np# Step 3. Repeat steps 1 & 2 many times, appending to a list so_boot_distn = [] for i in range(5000): so_boot_distn.append(# Step 2. Calculate point estimate np.mean(# Step 1. Resample stack_overflow.sample(frac=1, replace=True)['converted_comp']))
import matplotlib.pyplot as plt
plt.hist(so_boot_distn, bins=50)
plt.show()

std_error = np.std(so_boot_distn, ddof=1)
5607.997577378606
$\text{표준화 값} = \dfrac{\text{값} - \text{평균}}{\text{표준편차}}$
$z = \dfrac{\text{표본 통계량} - \text{가설 모수값}}{\text{표준 오차}}$
stack_overflow['converted_comp'].mean()
119574.71738168952
mean_comp_hyp = 110000
std_error
5607.997577378606
z_score = (mean_comp_samp - mean_comp_hyp) / std_error
1.7073326529796957
표본 통계량이 기대값(또는 "가설값")에 가까운지 또는 먼지 판단합니다
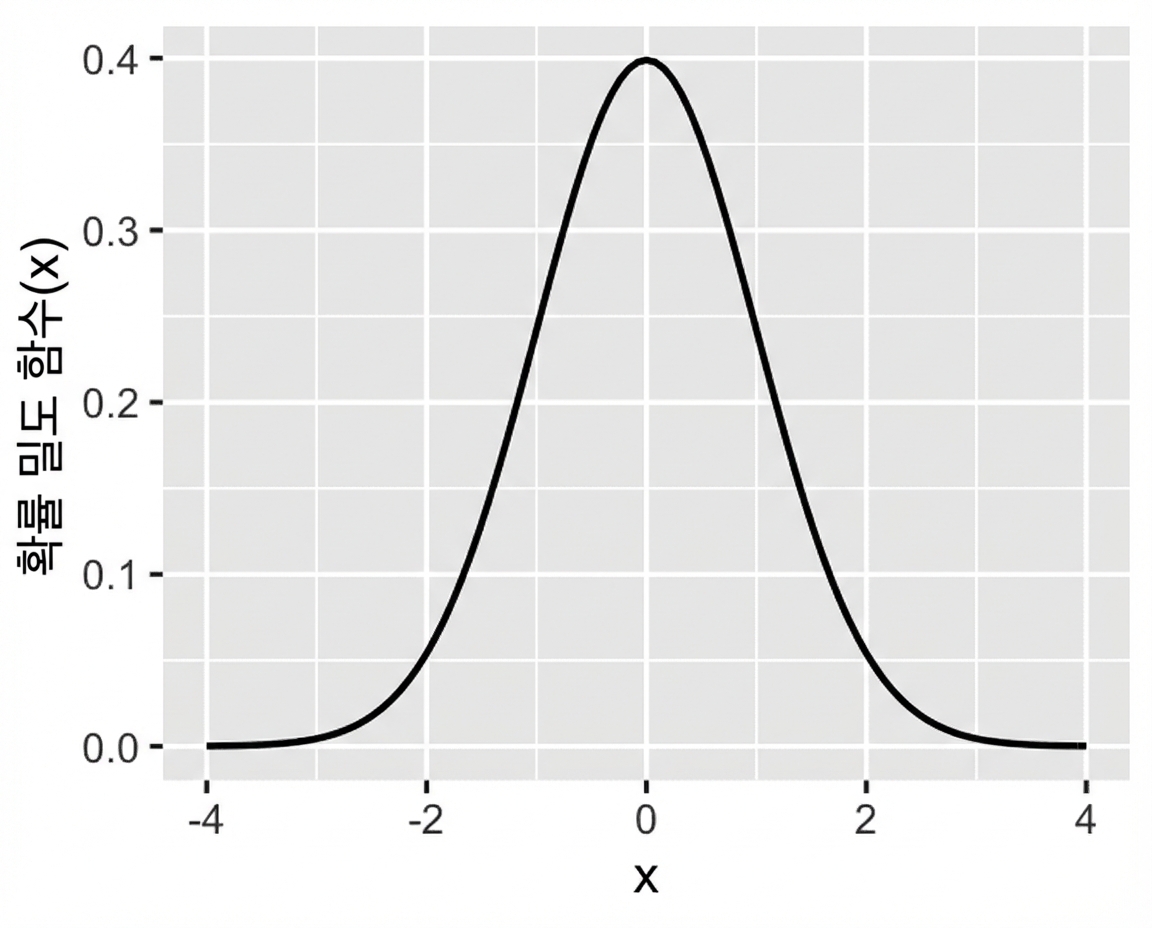
표준 정규 분포: 평균 = 0, 표준편차 = 1인 정규 분포

Python으로 배우는 가설 검정