카이제곱 적합도 검정
Python으로 배우는 가설 검정

James Chapman
Curriculum Manager, DataCamp
퍼플 링크
최상단 리소스를 이미 방문했다는 걸 알면 어떤 기분이 드시나요?
purple_link_counts = stack_overflow['purple_link'].value_counts()
purple_link_counts = purple_link_counts.rename_axis('purple_link')\
                                       .reset_index(name='n')\
                                       .sort_values('purple_link')
         purple_link     n
2             Amused   368
3            Annoyed   263
0  Hello, old friend  1225
1        Indifferent   405
가설 설정
hypothesized = pd.DataFrame({
  'purple_link': ['Amused', 'Annoyed', 'Hello, old friend', 'Indifferent'],
  'prop': [1/6, 1/6, 1/2, 1/6]})
         purple_link      prop
0             Amused  0.166667
1            Annoyed  0.166667
2  Hello, old friend  0.500000
3        Indifferent  0.166667
$H_{0}$: 표본은 가설 분포와 일치함
$H_{A}$: 표본은 가설 분포와 일치하지 않음
$\chi^{2}$는 각 범주에서 관측치가 기대값과 얼마나 다른지 측정합니다
alpha = 0.01
범주별 가설 도수
n_total = len(stack_overflow)
hypothesized["n"] = hypothesized["prop"] * n_total
         purple_link      prop            n
0             Amused  0.166667   376.833333
1            Annoyed  0.166667   376.833333
2  Hello, old friend  0.500000  1130.500000
3        Indifferent  0.166667   376.833333
도수 시각화
import matplotlib.pyplot as plt plt.bar(purple_link_counts['purple_link'], purple_link_counts['n'], color='red', label='Observed')plt.bar(hypothesized['purple_link'], hypothesized['n'], alpha=0.5, color='blue', label='Hypothesized') plt.legend() plt.show()
도수 시각화
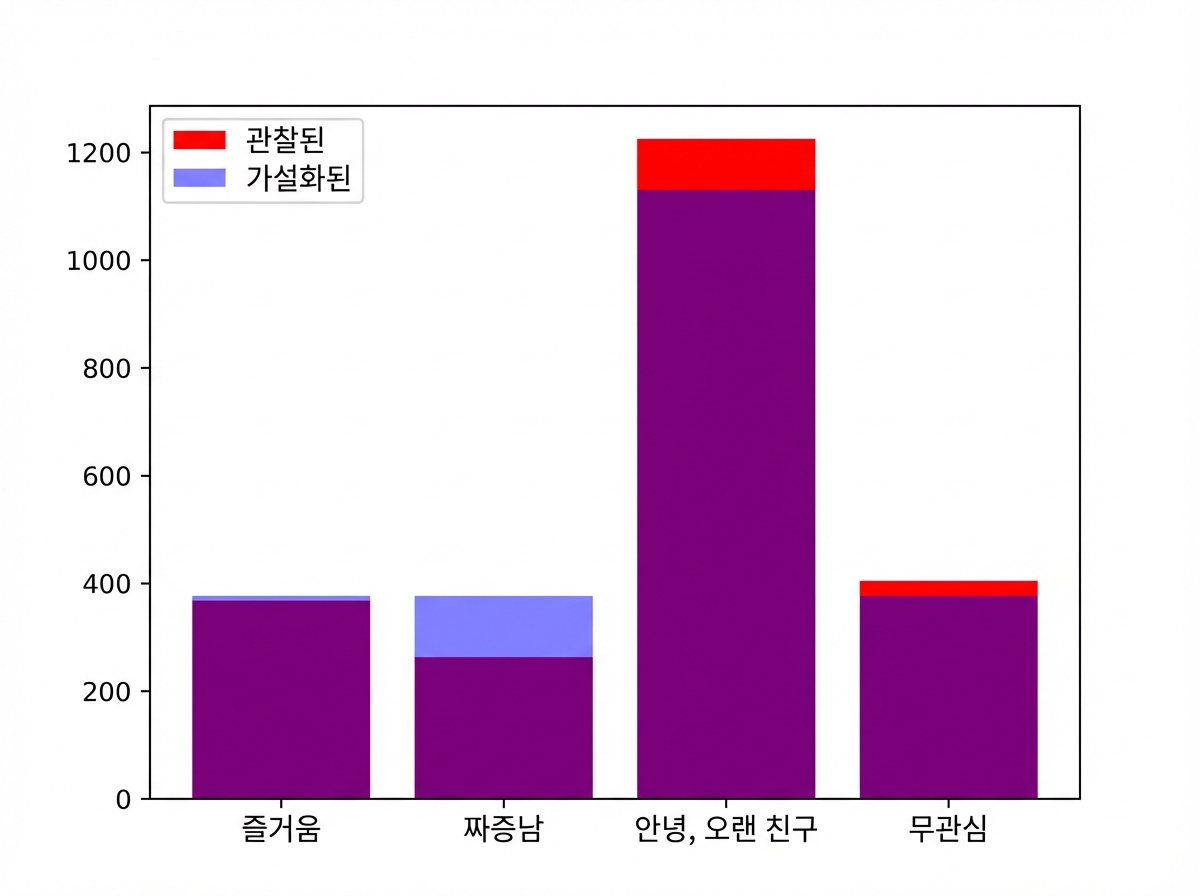
카이제곱 적합도 검정
print(hypothesized)
         purple_link      prop            n
0             Amused  0.166667   376.833333
1            Annoyed  0.166667   376.833333
2  Hello, old friend  0.500000  1130.500000
3        Indifferent  0.166667   376.833333
from scipy.stats import chisquare
chisquare(f_obs=purple_link_counts['n'], f_exp=hypothesized['n'])
Power_divergenceResult(statistic=44.59840778416629, pvalue=1.1261810719413759e-09)
연습해 봅시다!
Python으로 배우는 가설 검정

