단일 변수의 분포
R로 하는 탐색적 데이터 분석

Andrew Bray
Assistant Professor, Reed College
주변 분포 vs. 조건부 분포
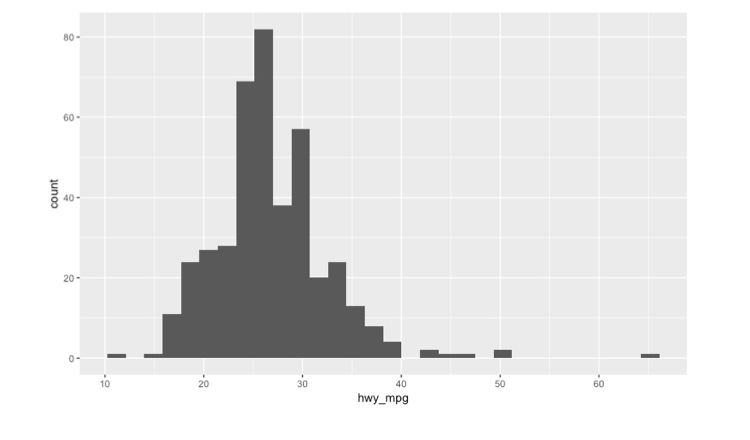
ggplot(cars, aes(x = hwy_mpg)) +
  geom_histogram()
`stat_bin()` using `bins = 30`. Pick better value with `binwidth`.
Warning message:
Removed 14 rows containing non-finite values (stat_bin).
주변 분포 vs. 조건부 분포
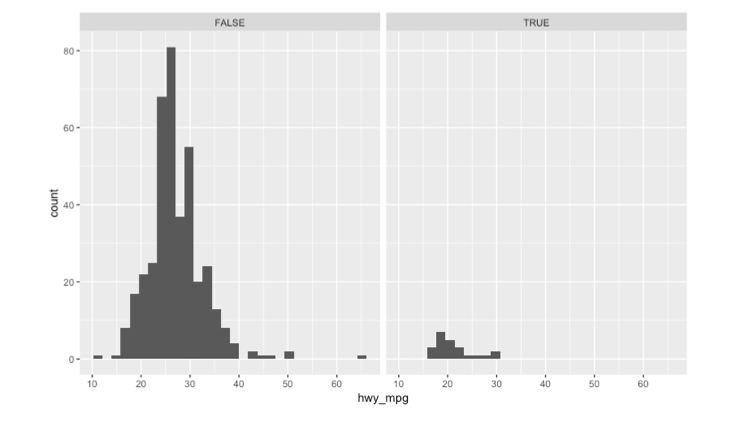
ggplot(cars, aes(x = hwy_mpg)) +
  geom_histogram() +
  facet_wrap(~pickup)
`stat_bin()` using `bins = 30`. Pick better value with `binwidth`.
Warning message:
Removed 14 rows containing non-finite values (stat_bin).
필터링·패싯 히스토그램
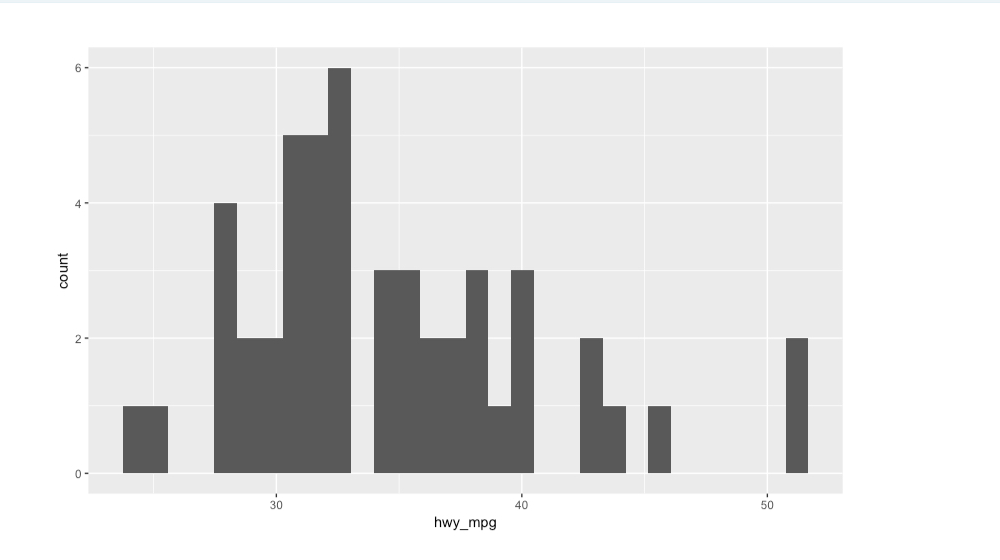
cars %>%
  filter(eng_size < 2.0) %>%
  ggplot(aes(x = hwy_mpg)) +
  geom_histogram()
`stat_bin()` using `bins = 30`. Pick better value with `binwidth`.
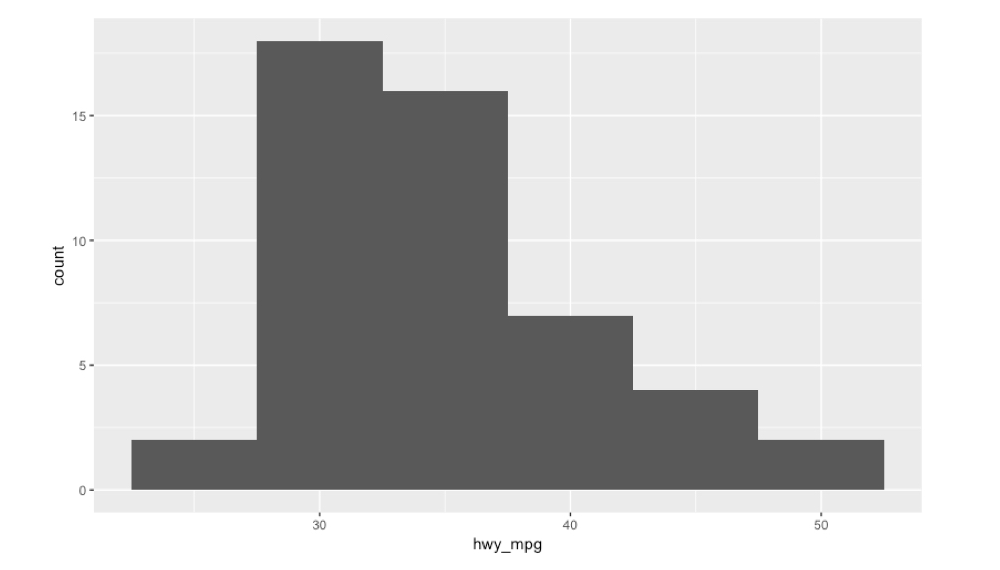
넓은 구간 너비
cars %>%
  filter(eng_size < 2.0) %>%
  ggplot(aes(x = hwy_mpg)) +
  geom_histogram(binwidth = 5)
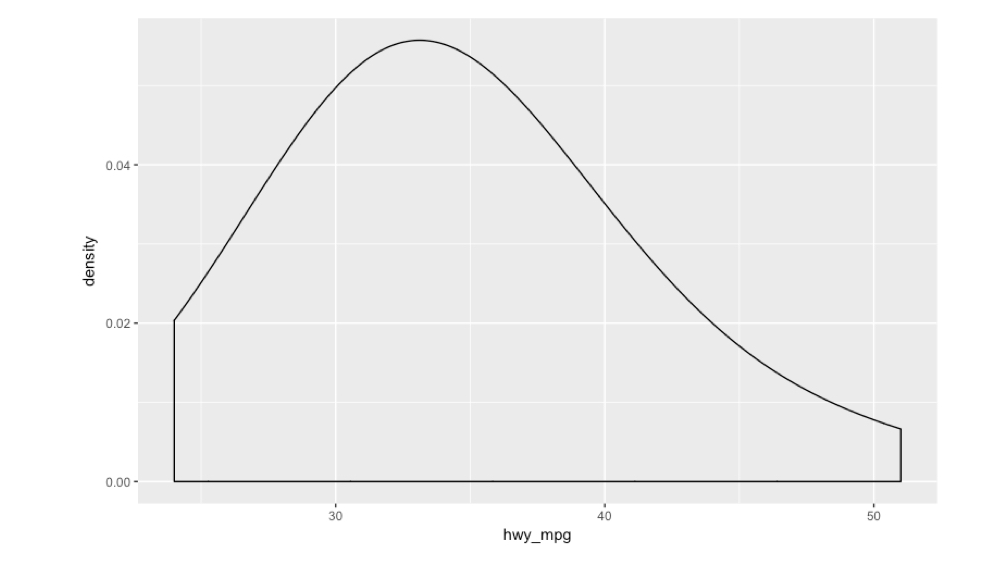
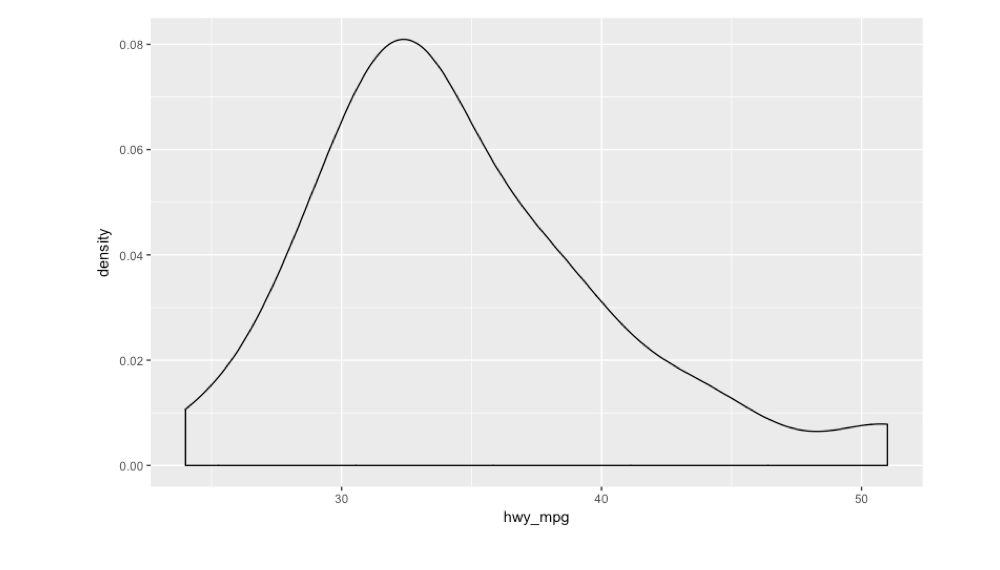
밀도 그래프
cars %>%
  filter(eng_size < 2.0) %>%
  ggplot(aes(x = hwy_mpg)) +
  geom_density()
넓은 대역폭
cars %>%
  filter(eng_size < 2.0) %>%
  ggplot(aes(x = hwy_mpg)) +
  geom_density(bw = 5)