고차원 시각화

R로 하는 탐색적 데이터 분석

Andrew Bray

Assistant Professor, Reed College

변수 3개의 플롯

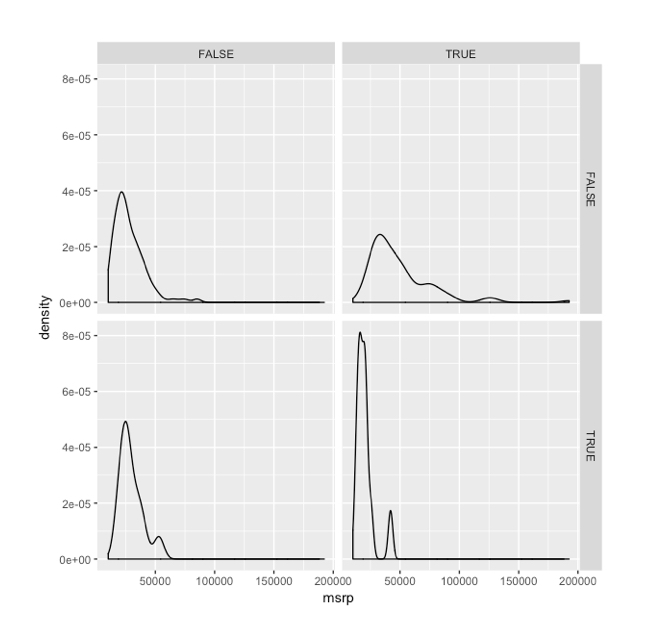
ggplot(cars, aes(x = msrp)) +
  geom_density() +
  facet_grid(pickup ~ rear_wheel)
ch2_4.005.png

R로 하는 탐색적 데이터 분석

변수 3개의 플롯

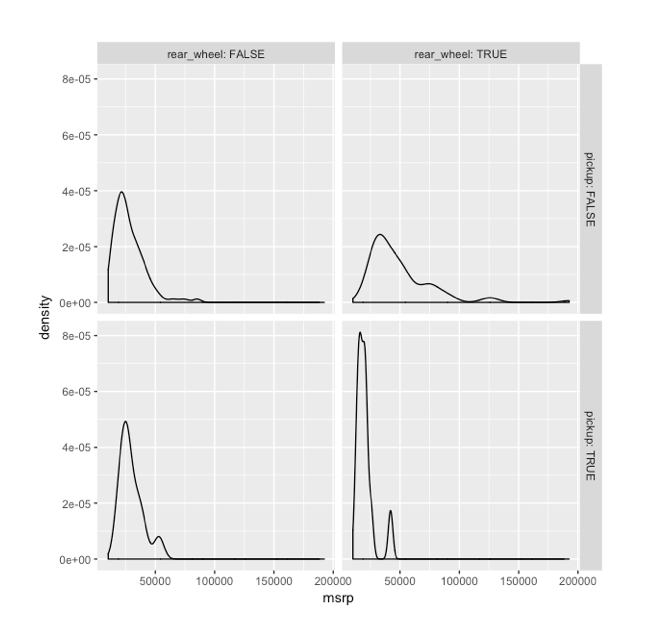
ggplot(cars, aes(x = msrp)) +
  geom_density() +
  facet_grid(pickup ~ rear_wheel, labeller = label_both)
ch2_4.008.png

R로 하는 탐색적 데이터 분석

변수 3개의 플롯

ggplot(cars, aes(x = msrp)) +
  geom_density() +
  facet_grid(pickup ~ rear_wheel, labeller = label_both)
table(cars$rear_wheel, cars$pickup)
      FALSE TRUE
FALSE   306   12
TRUE     98   12
R로 하는 탐색적 데이터 분석

고차원 플롯

  • 모양

  • 크기

  • 색상

  • 패턴

  • 움직임

  • x좌표

  • y좌표

R로 하는 탐색적 데이터 분석

연습해 봅시다!

R로 하는 탐색적 데이터 분석

Preparing Video For Download...