데이터 소개

R로 하는 탐색적 데이터 분석

Andrew Bray

Assistant Professor, Reed College

이메일 데이터셋

email
# A tibble: 3,921 × 21
       spam to_multiple  from    cc sent_email                time image
     <fct>       <dbl> <dbl> <int>      <dbl>              <dttm> <dbl>
1  not-spam           0     1     0          0 2012-01-01 01:16:41     0
2  not-spam           0     1     0          0 2012-01-01 02:03:59     0
3  not-spam           0     1     0          0 2012-01-01 11:00:32     0
4  not-spam           0     1     0          0 2012-01-01 04:09:49     0
5  not-spam           0     1     0          0 2012-01-01 05:00:01     0
6  not-spam           0     1     0          0 2012-01-01 05:04:46     0
7  not-spam           1     1     0          1 2012-01-01 12:55:06     0
8  not-spam           1     1     1          1 2012-01-01 13:45:21     1
9  not-spam           0     1     0          0 2012-01-01 16:08:59     0
10 not-spam           0     1     0          0 2012-01-01 13:12:00     0
# ... with 3,911 more rows, and 14 more variables: attach <dbl>,
#   dollar <dbl>, winner <fct>, inherit <dbl>, viagra <dbl>,
#   password <dbl>, num_char <dbl>, line_breaks <int>, format <dbl>,
#   re_subj <dbl>, exclaim_subj <dbl>, urgent_subj <dbl>,
#   exclaim_mess <dbl>, number <fct>
R로 하는 탐색적 데이터 분석

히스토그램

ggplot(data, aes(x = var1)) +
  geom_histogram()
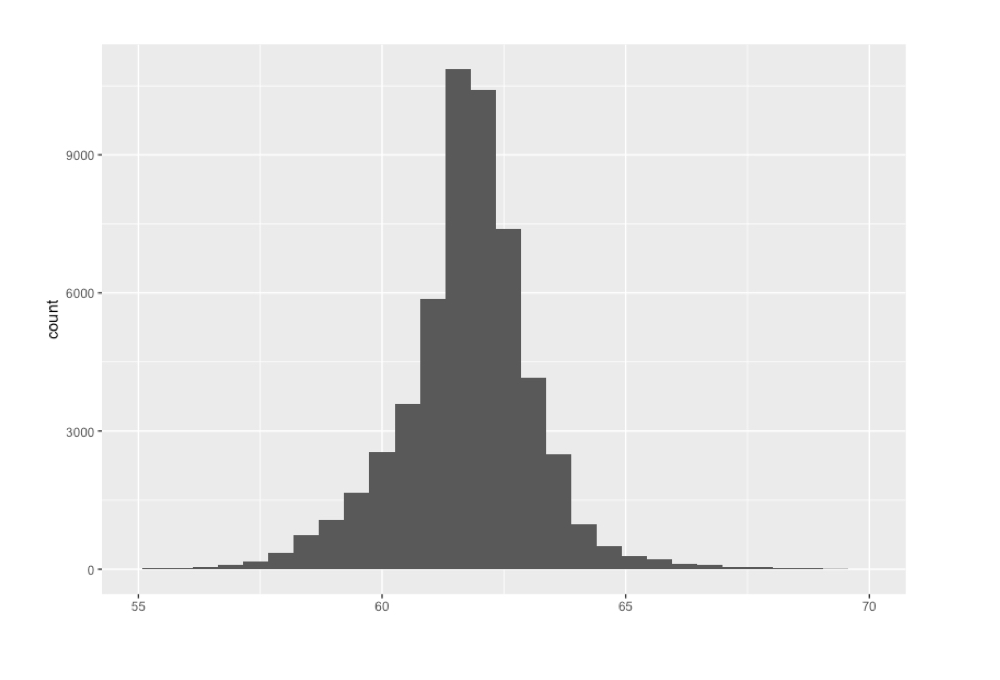
히스토그램

R로 하는 탐색적 데이터 분석

히스토그램

ggplot(data, aes(x = var1)) +
  geom_histogram() +
  facet_wrap(~var2)
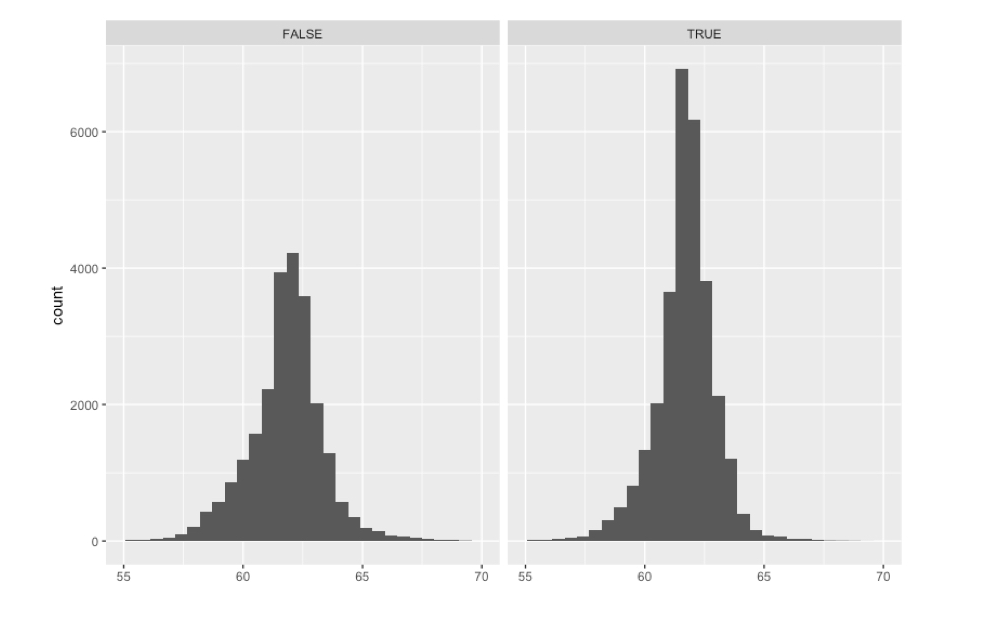
히스토그램

R로 하는 탐색적 데이터 분석

상자그림

ggplot(data, aes(x = var2, y = var1)) +
  geom_boxplot()
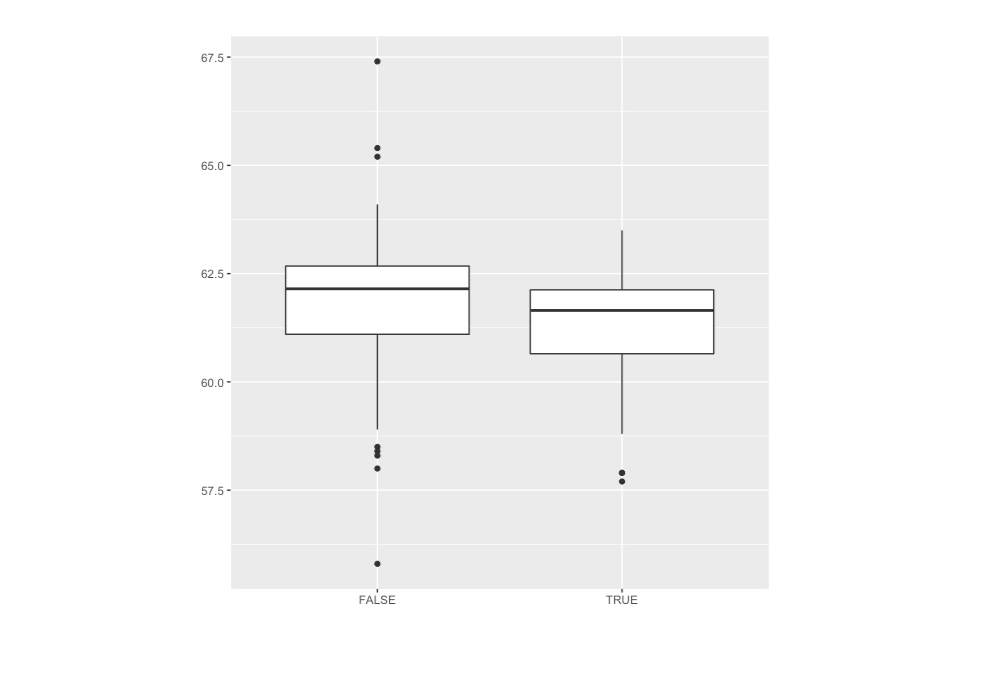
상자그림

R로 하는 탐색적 데이터 분석

상자그림

ggplot(data, aes(x = 1, y = var1)) +
  geom_boxplot()
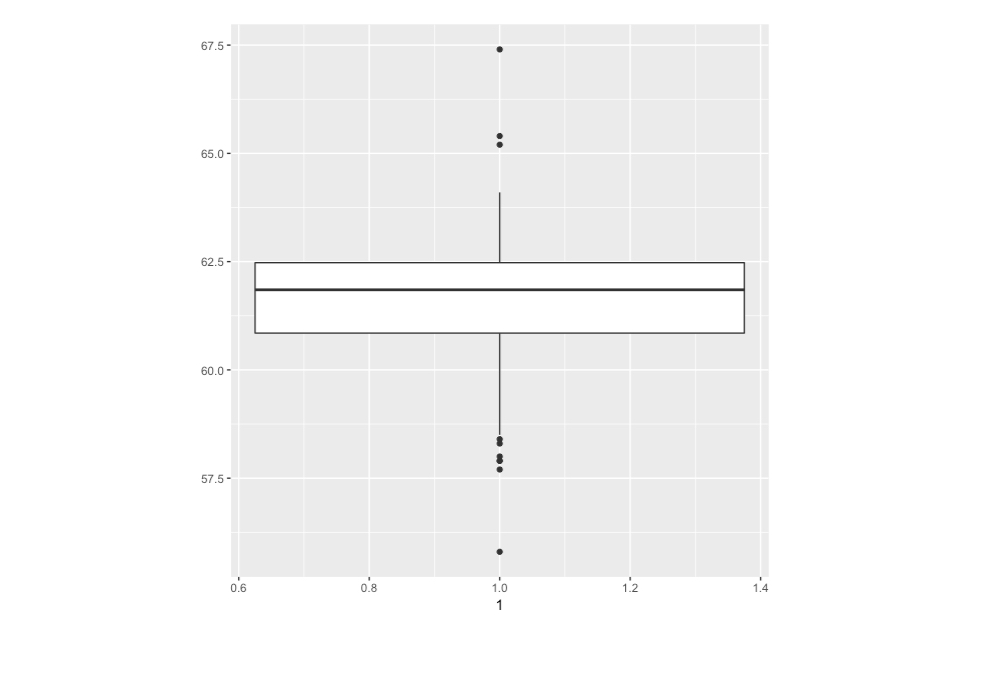
상자그림

R로 하는 탐색적 데이터 분석

밀도 그래프

ggplot(data, aes(x = var1)) +
  geom_density()
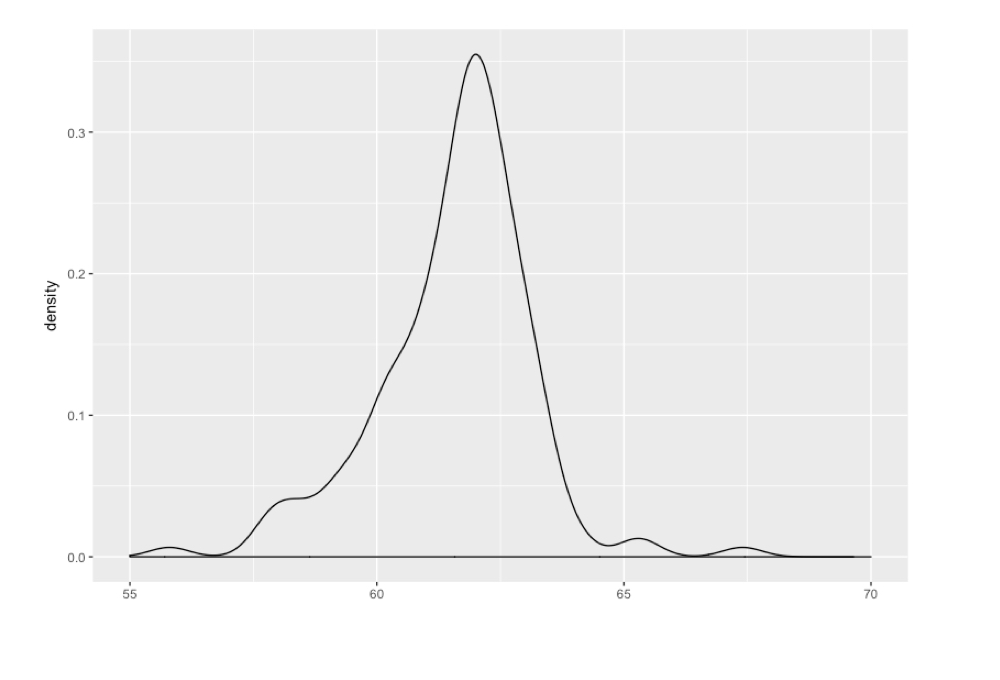
밀도 그래프

R로 하는 탐색적 데이터 분석

밀도 그래프

ggplot(data, aes(x = var1, fill = var2)) +
  geom_density(alpha = .3)
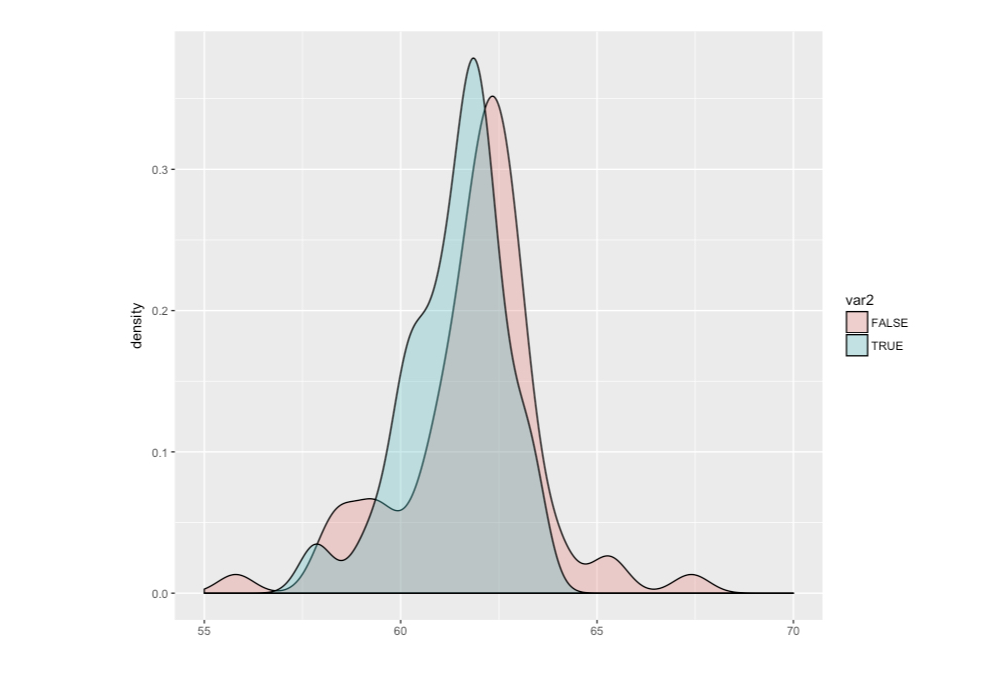
밀도 그래프

R로 하는 탐색적 데이터 분석

연습해 봅시다!

R로 하는 탐색적 데이터 분석

Preparing Video For Download...