Seaborn 막대 그래프

Python으로 범주형 데이터 다루기

Kasey Jones

Research Data Scientist

전통적 막대 그래프

# Code provided for clarity
reviews["Traveler type"].value_counts().plot.bar()
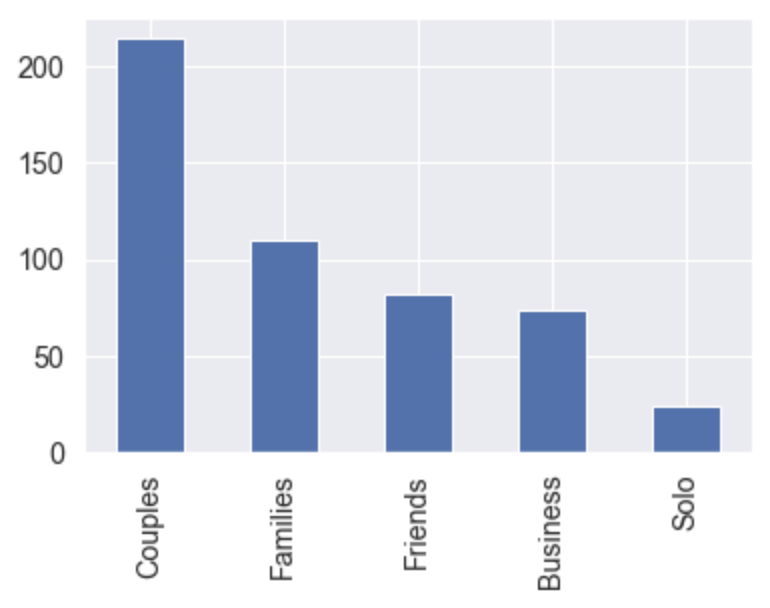
여행자 유형별 리뷰 수를 집계한 막대 그래프.

Python으로 범주형 데이터 다루기

문법

sns.set(font_scale=1.3)
sns.set_style("darkgrid")

sns.catplot(x="Traveler type", y="Score", data=reviews, kind="bar")
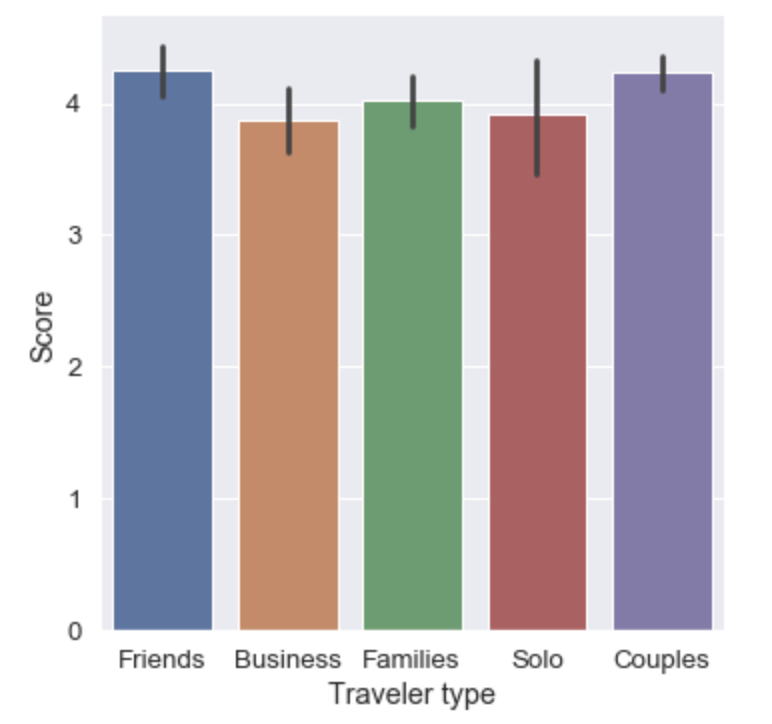
리뷰어의 여행자 유형별 호텔 리뷰를 보여주는 Seaborn 범주형 막대 그래프.

Python으로 범주형 데이터 다루기

범주 순서 지정

reviews["Traveler type"] = reviews["Traveler type"].astype("category")
reviews["Traveler type"].cat.categories
Index(['Business', 'Couples', 'Families', 'Friends', 'Solo'], dtype='object')
Python으로 범주형 데이터 다루기

업데이트된 시각화

sns.catplot(x="Traveler type", y="Score", data=reviews, kind="bar")
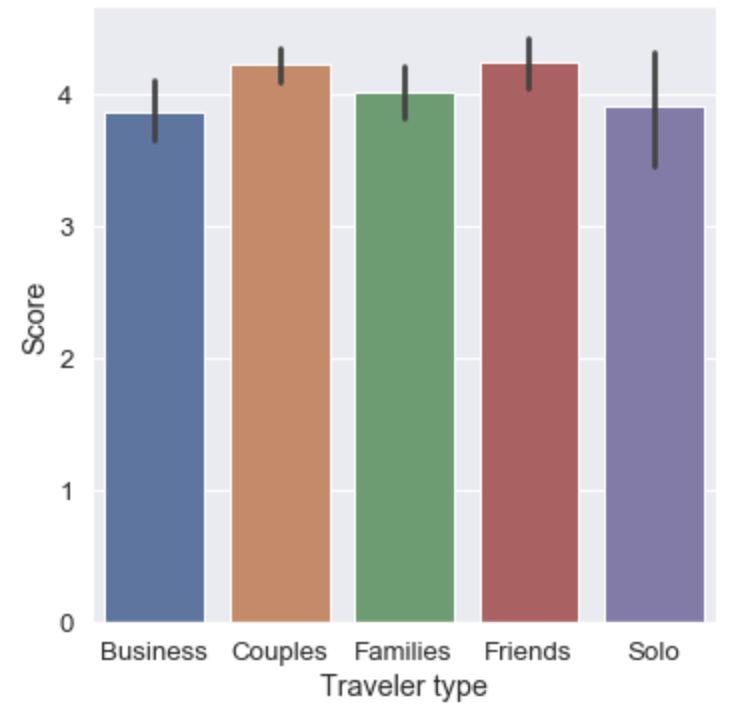
  • 참고: catplot()에는 order 매개변수가 있습니다
Python으로 범주형 데이터 다루기

hue 매개변수

  • hue:
    • data에 있는 변수 이름
    • 두 번째 범주로 데이터를 나눕니다
    • 색상 구분에 사용됩니다
sns.set(font_scale=1.2)
sns.set_style("darkgrid")
sns.catplot(x="Traveler type", y="Score", data=reviews, kind="bar",
            hue="Tennis court")  # <--- new parameter
Python으로 범주형 데이터 다루기

두 변수 간 막대 그래프

Python으로 범주형 데이터 다루기

막대 그래프 실습

Python으로 범주형 데이터 다루기

Preparing Video For Download...