ggplot2로 하는 중급 데이터 시각화
Rick Scavetta
Founder, Scavetta Academy
coord_coord_cartesian()coord_cartesian(xlim = ...)scale_x_continuous(limits = ...)xlim(...)iris.smooth <- ggplot(
iris,
aes(x = Sepal.Length,
y = Sepal.Width,
color = Species)
) +
geom_point(alpha = 0.7) +
geom_smooth()
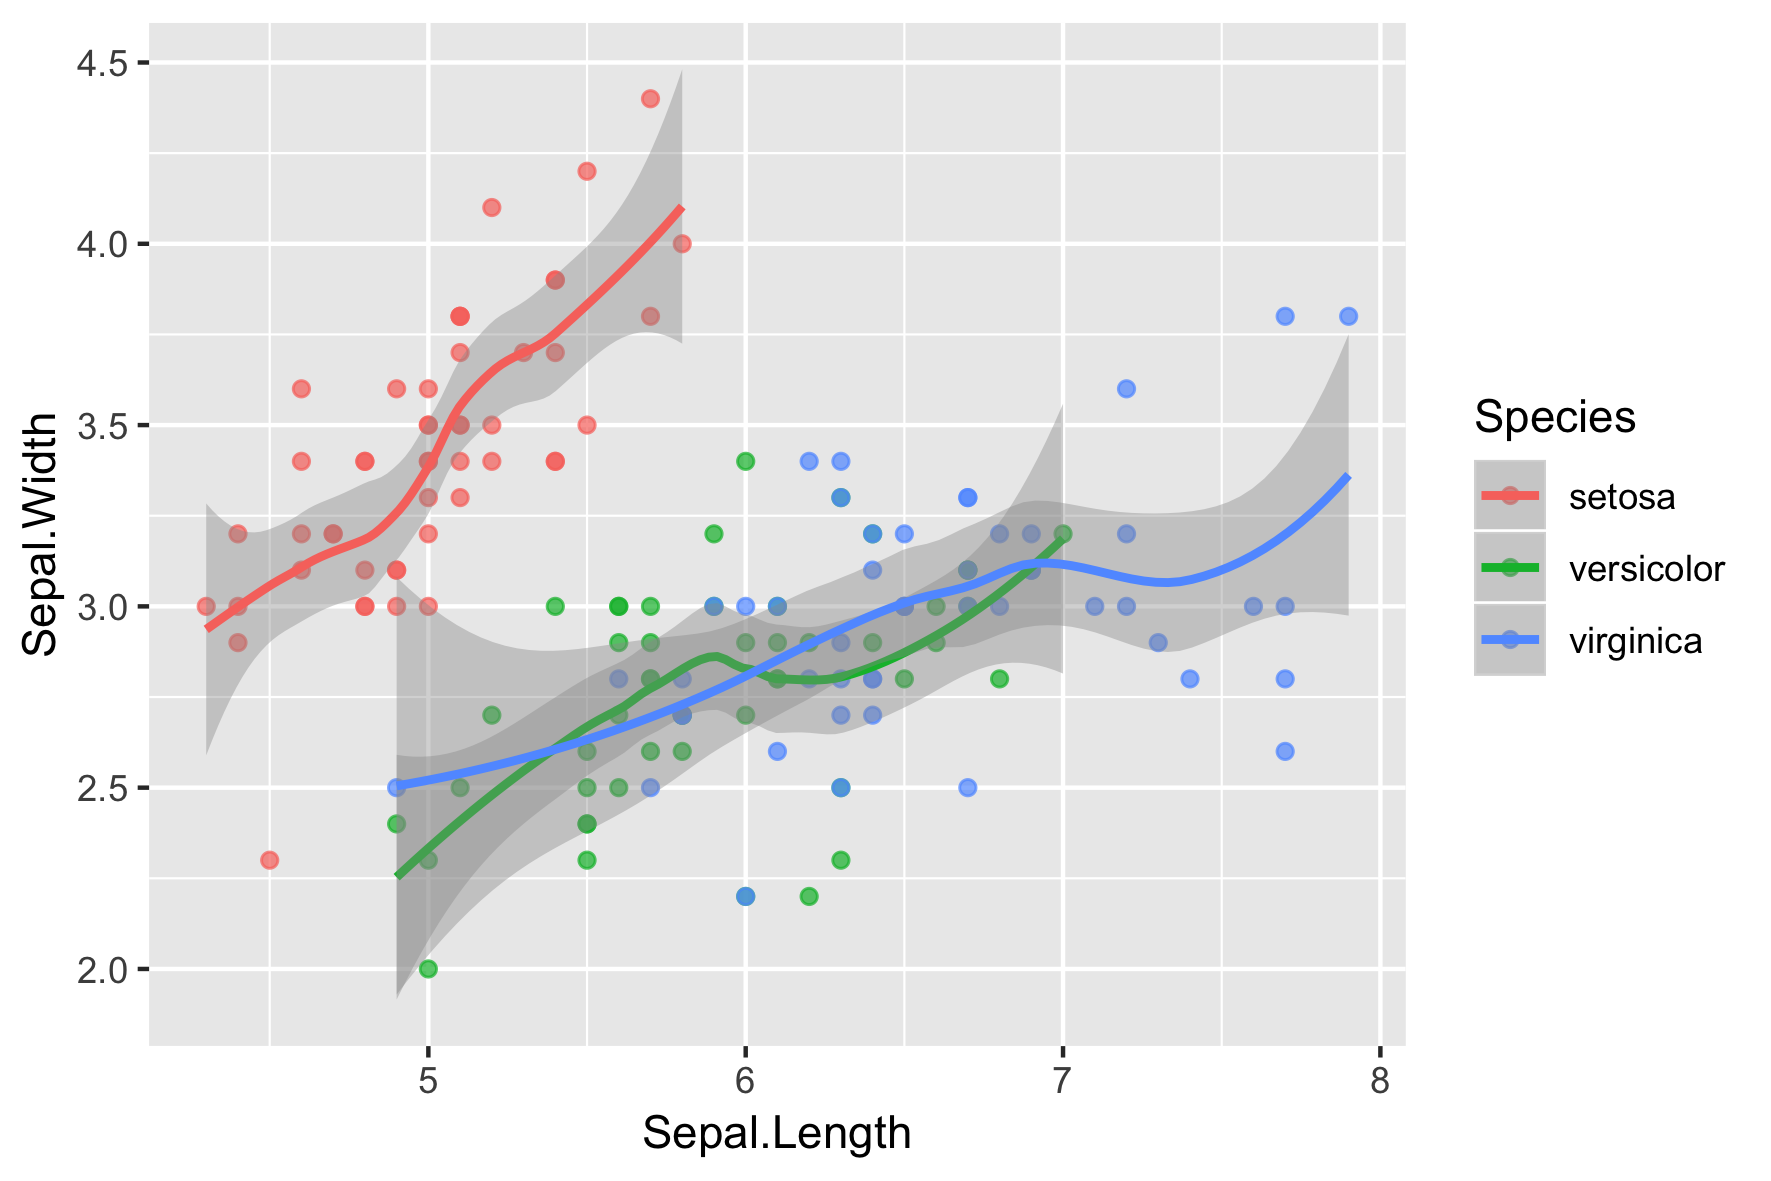
iris.smooth

iris.smooth +
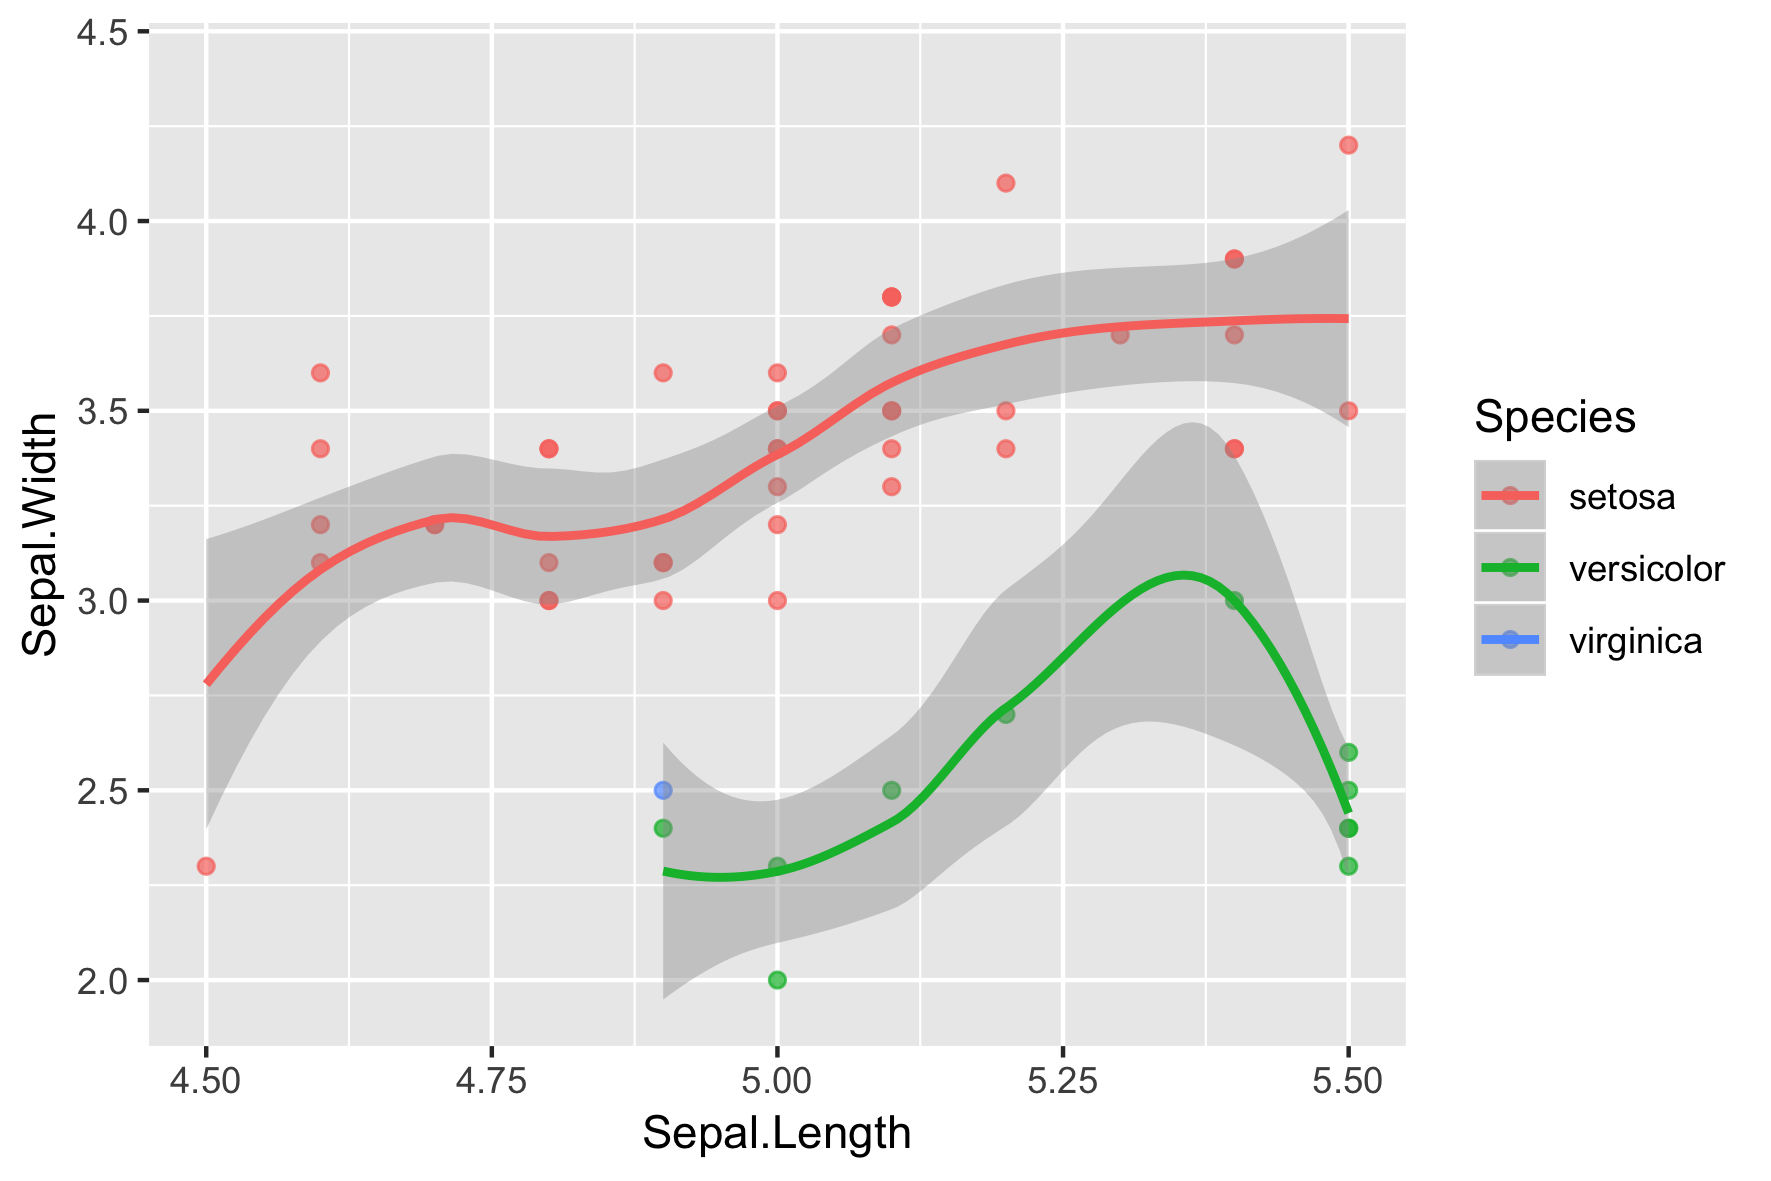
scale_x_continuous(limits = c(4.5, 5.5))
결측/비유한 값이 포함된 95개 행이 제거되었습니다
(stat_smooth).
결측값이 포함된 95개 행이 제거되었습니다
(geom_point).

원본 플롯

scale_x_continuous()로 확대

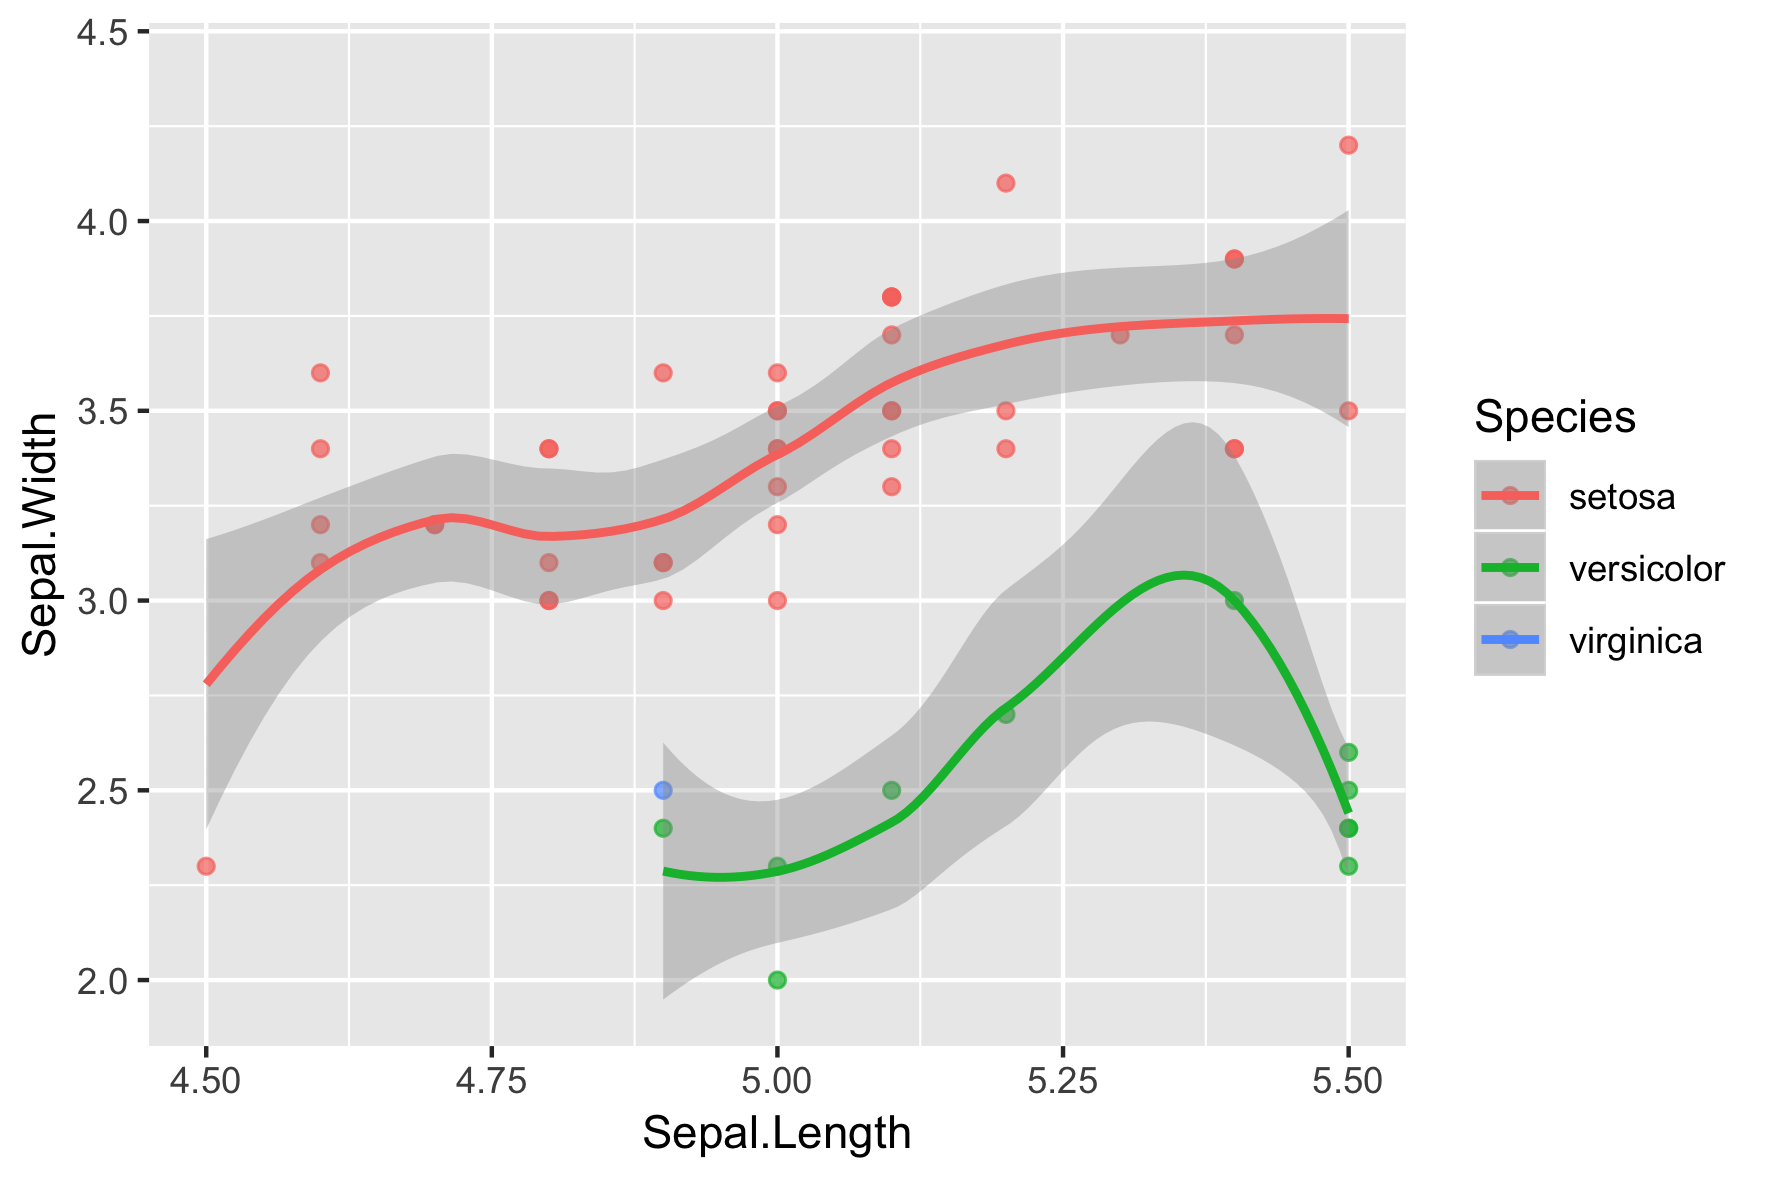
원본 데이터의 일부가 필터링됩니다!
iris.smooth +
xlim(c(4.5, 5.5))
결측/비유한 값이 포함된 95개 행이 제거되었습니다
(stat_smooth).
결측값이 포함된 95개 행이 제거되었습니다
(geom_point).

iris.smooth +
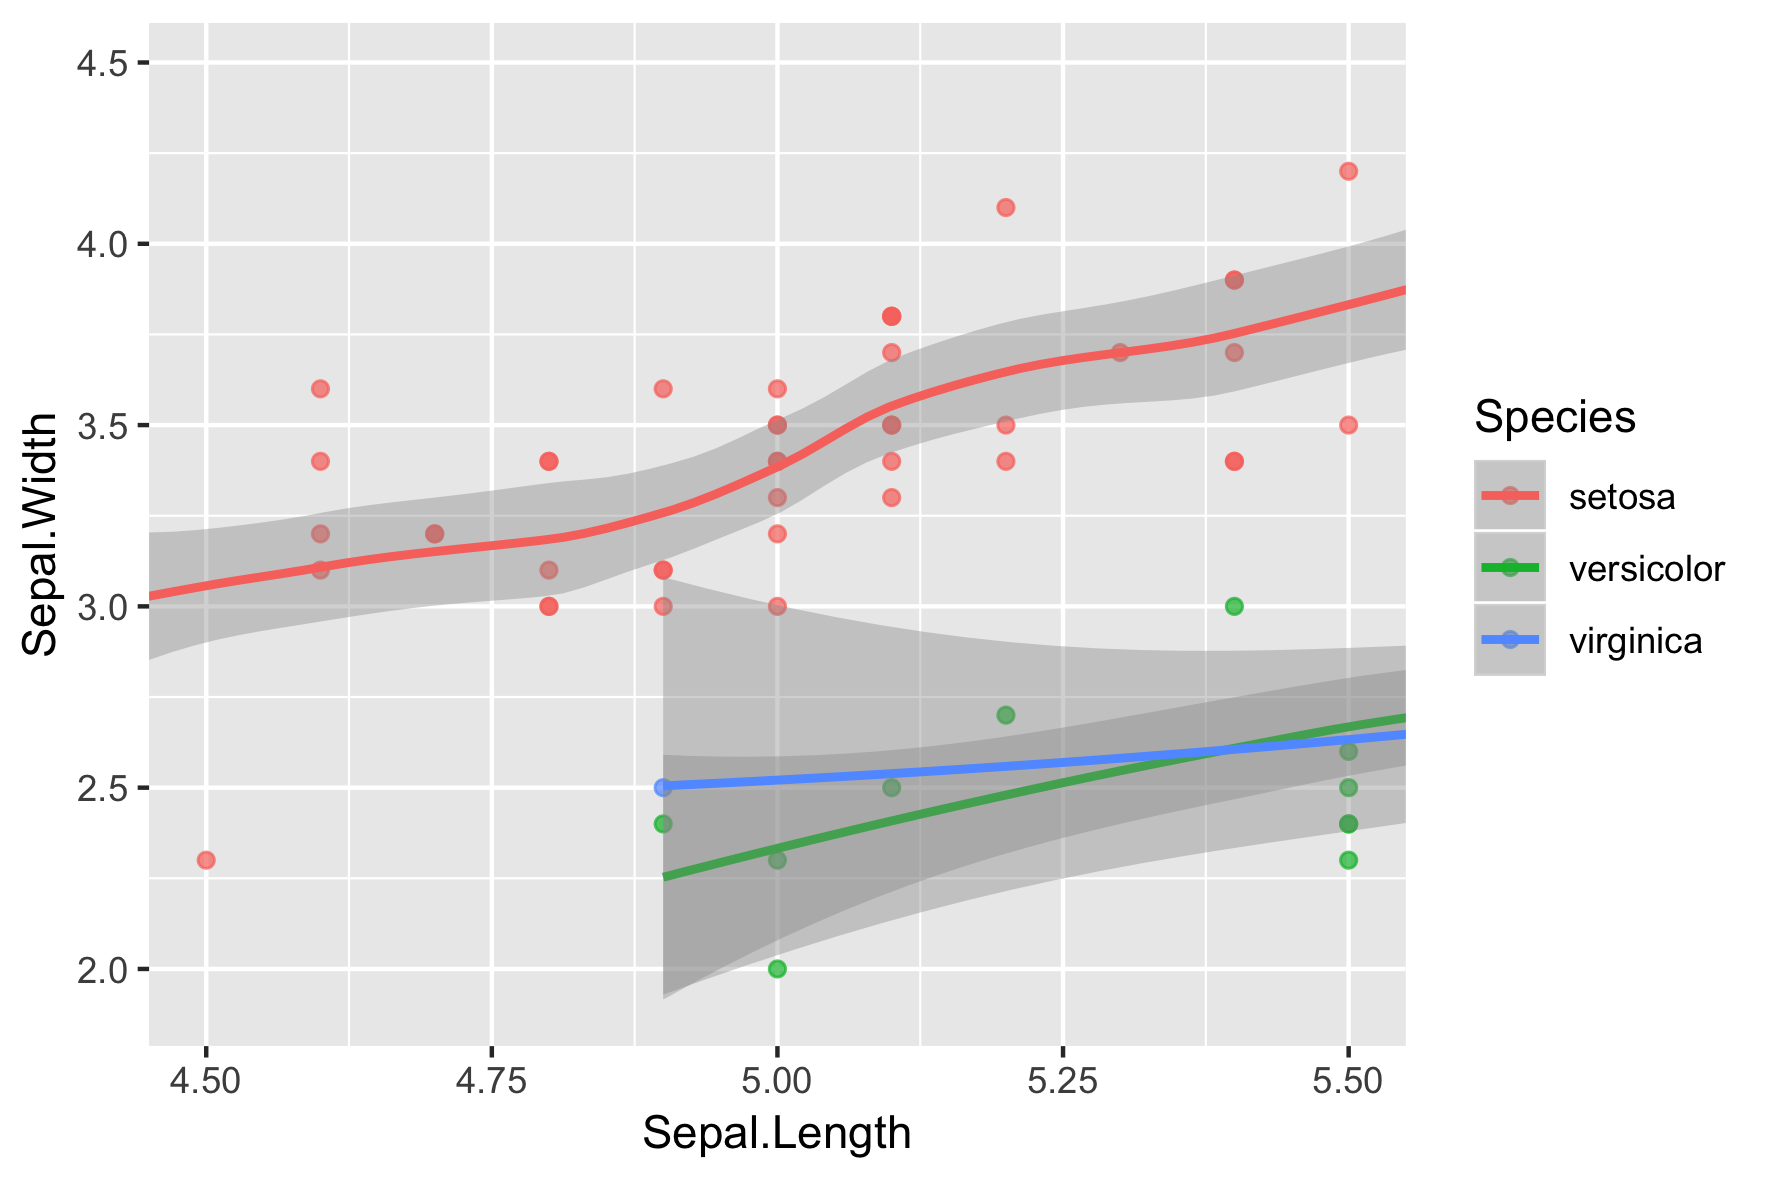
coord_cartesian(xlim = c(4.5, 5.5))

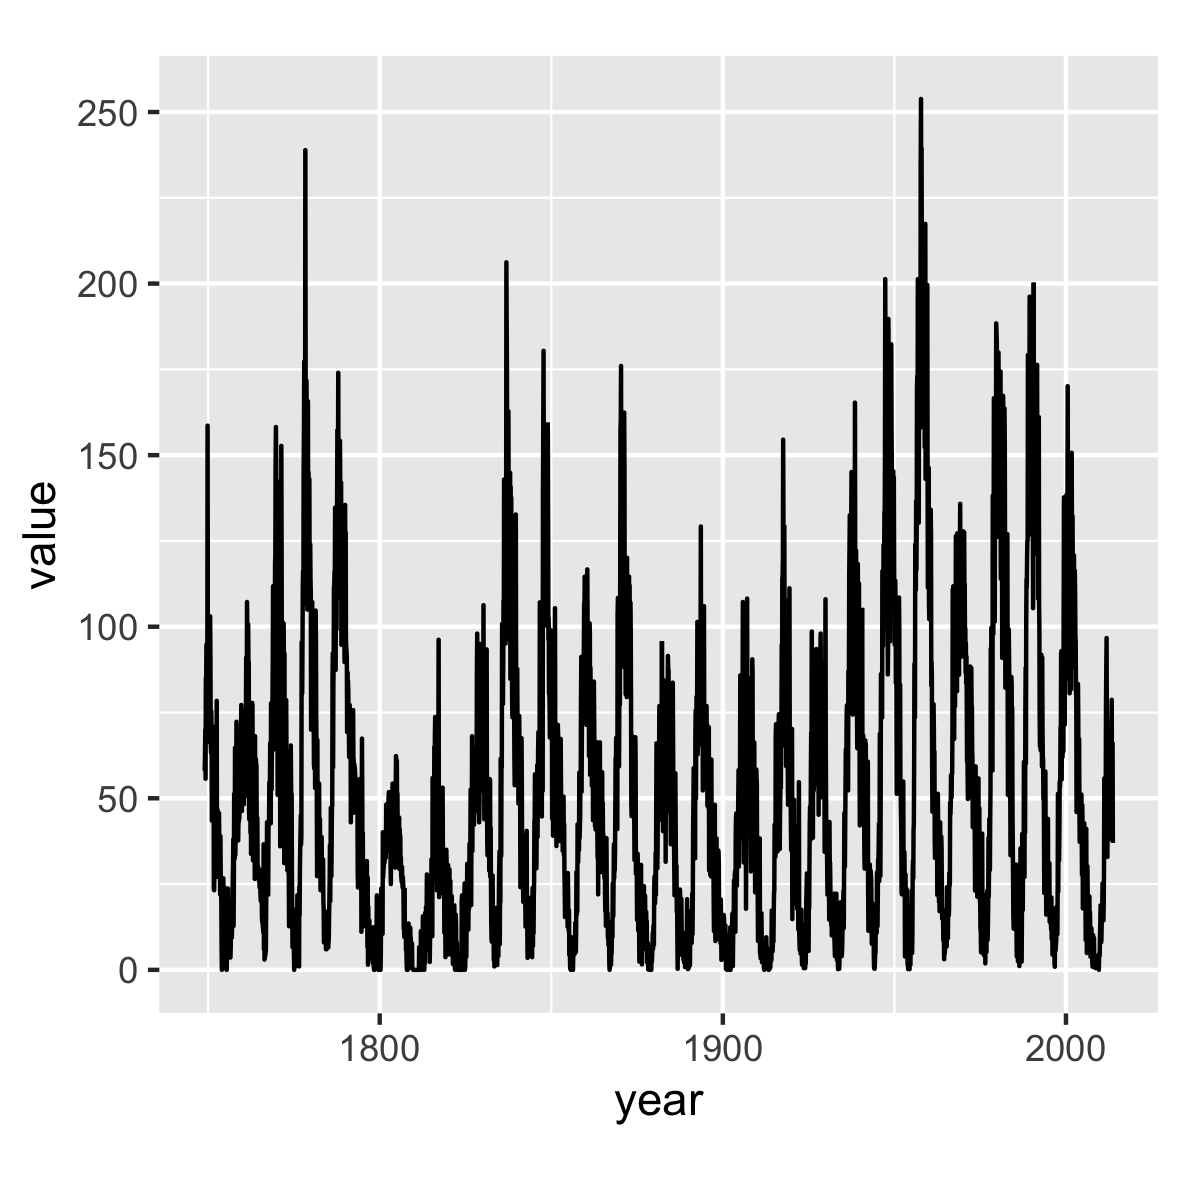
library(zoo)
sunspots.m <- data.frame(
year = index(sunspot.month),
value = reshape2::melt(sunspot.month)$value)
)
ggplot(sunspots.m, aes(x = year, y = value)) +
geom_line() +
coord_fixed() # 기본 1:1 종횡비

ggplot(sunspots.m, aes(x = year, y = value)) +
geom_line() +
coord_fixed(0.055)

ggplot2로 하는 중급 데이터 시각화