패싯 레이어

ggplot2로 하는 중급 데이터 시각화

Rick Scavetta

Founder, Scavetta Academy
패싯

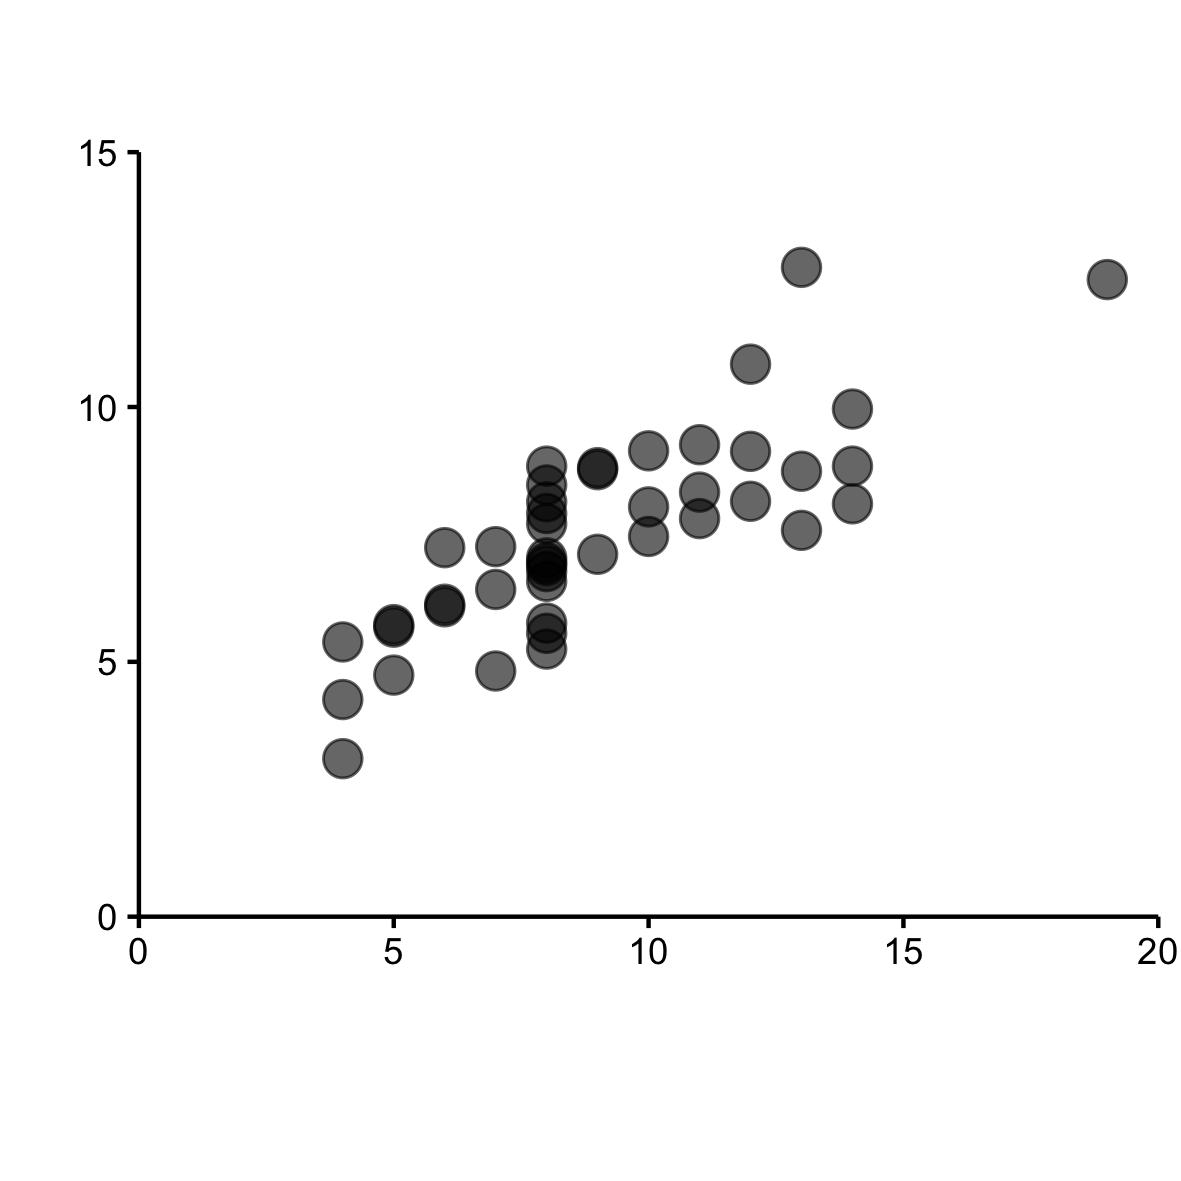
  • 단순하지만 유용함
  • 스몰 멀티플 개념
    • 에드워드 터프티가 대중화
    • Visualization of Quantitative Information, 1983
ggplot2로 하는 중급 데이터 시각화

ggplot2로 하는 중급 데이터 시각화

ggplot2로 하는 중급 데이터 시각화

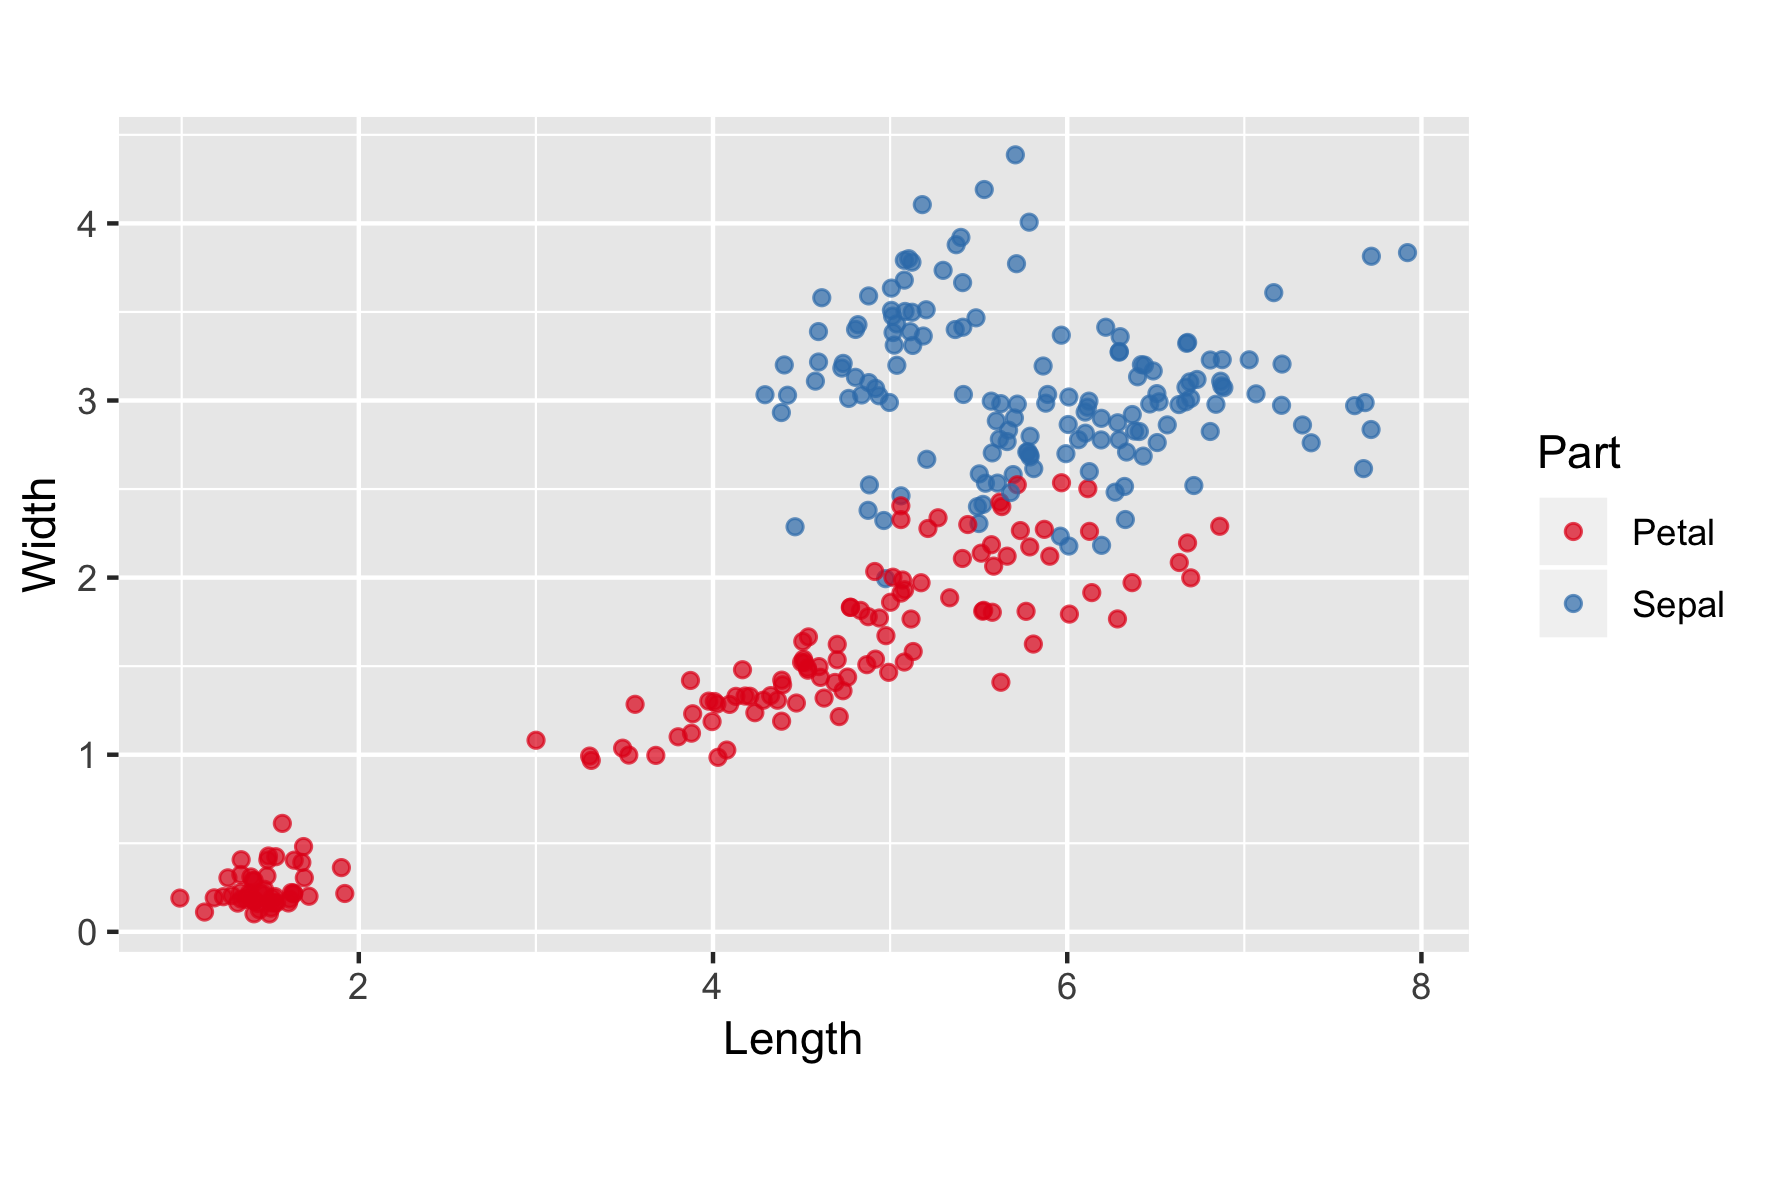
iris.wide

p <- ggplot(iris.wide, aes(x = Length, 
                           y = Width, 
                           ccolorol = Part)) +
  geom_jitter(alpha = 0.7) +
  scale_color_brewer(palette = "Set1") +
  coord_fixed()

p

ggplot2로 하는 중급 데이터 시각화

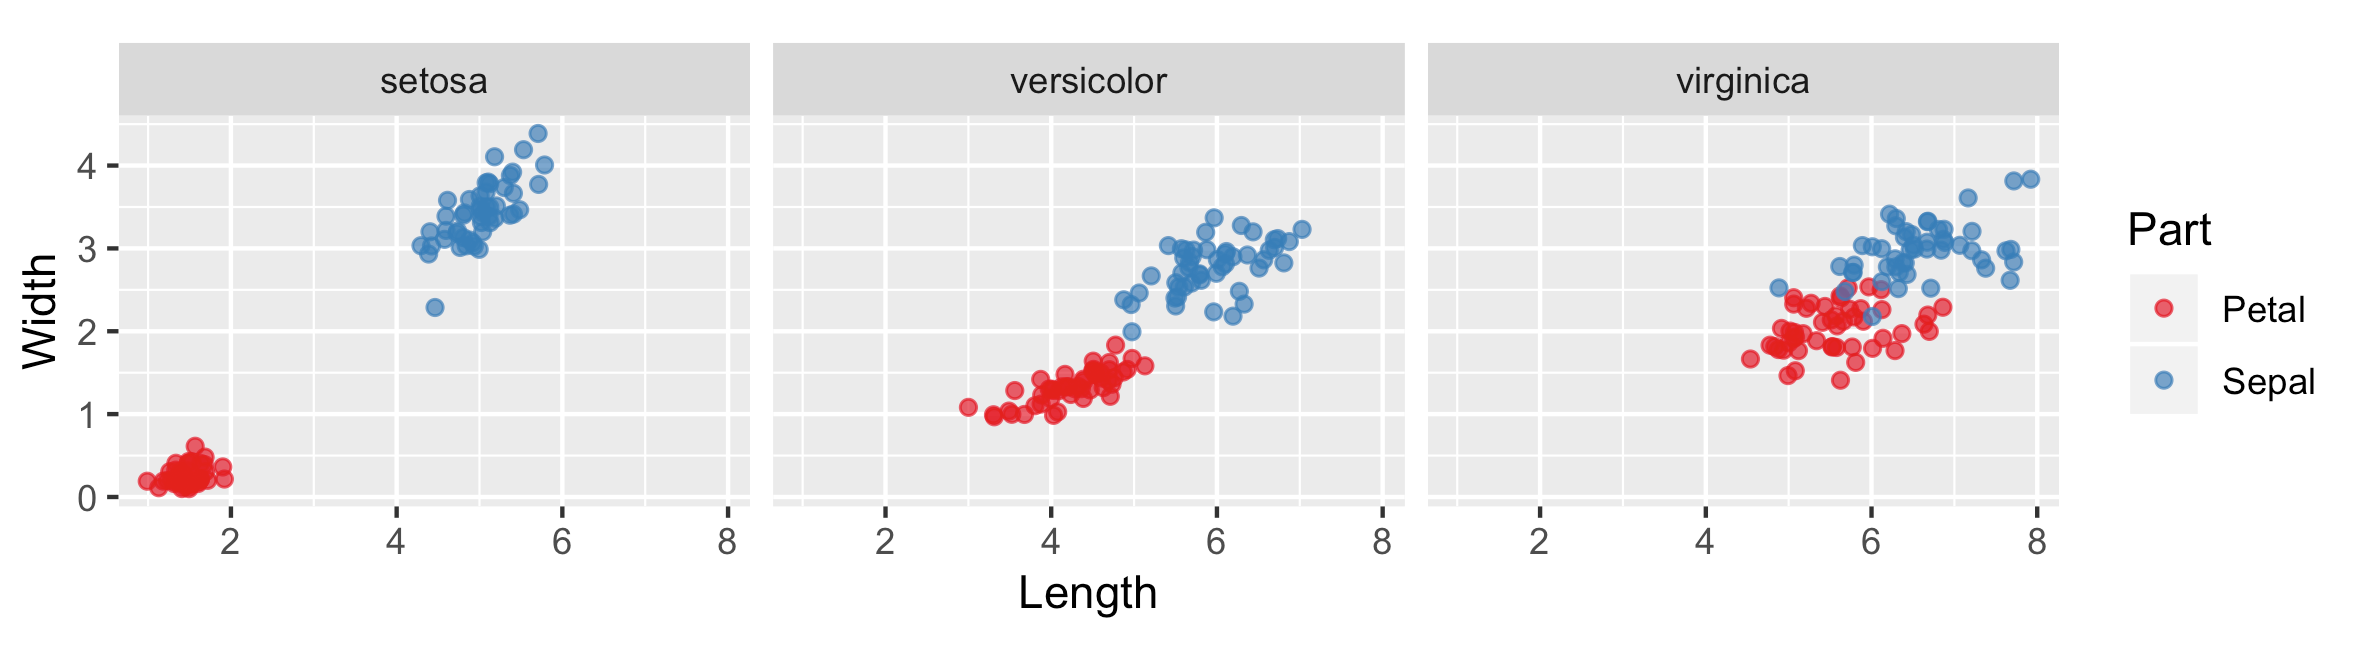
iris.wide & facet_grid()

p <- ggplot(iris.wide, aes(x = Length, y = Width, color = Part)) +
  geom_jitter(alpha = 0.7) +
  scale_color_brewer(palette = "Set1") +
  coord_fixed()
p + facet_grid(cols = vars(Species))
ggplot2로 하는 중급 데이터 시각화

수식 표기법

p <- ggplot(iris.wide, aes(x = Length, y = Width, color = Part)) +
  geom_jitter(alpha = 0.7) +
  scale_color_brewer(palette = "Set1") +
  coord_fixed()
p + facet_grid(. ~ Species)

ggplot2로 하는 중급 데이터 시각화

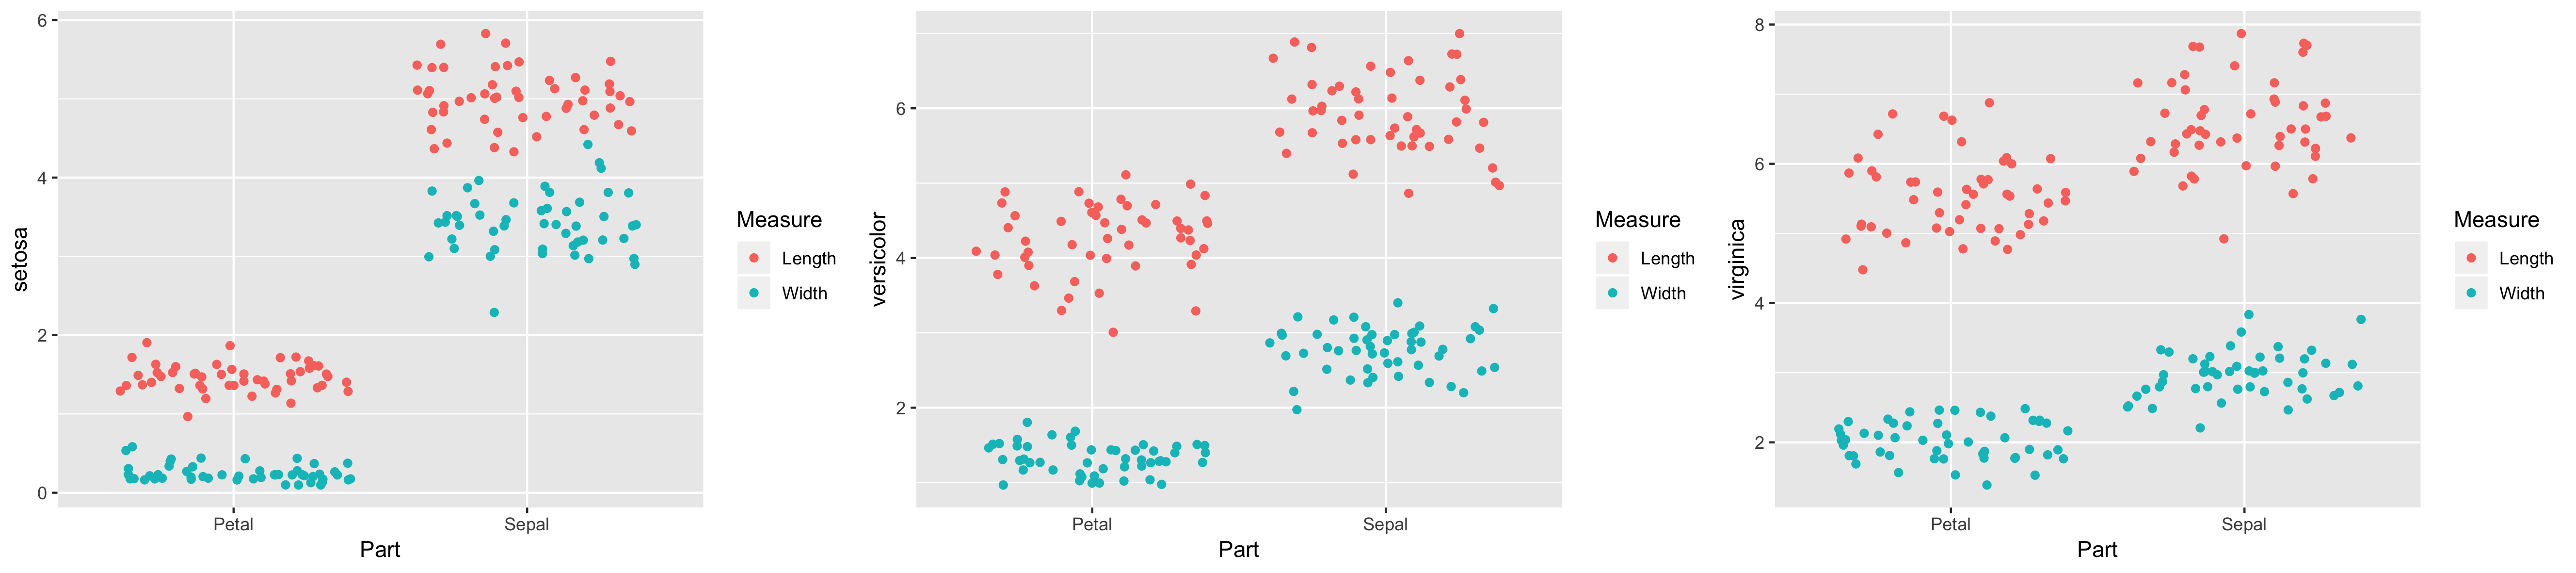
iris.wide2

ggplot(iris.wide2, aes(x = Part, y = setosa, color = Measure)) +
  geom_jitter()
ggplot(iris.wide2, aes(x = Part, y = versicolor, color = Measure)) +
  geom_jitter()  
ggplot(iris.wide2, aes(x = Part, y = virginica, color = Measure)) +
  geom_jitter()

ggplot2로 하는 중급 데이터 시각화

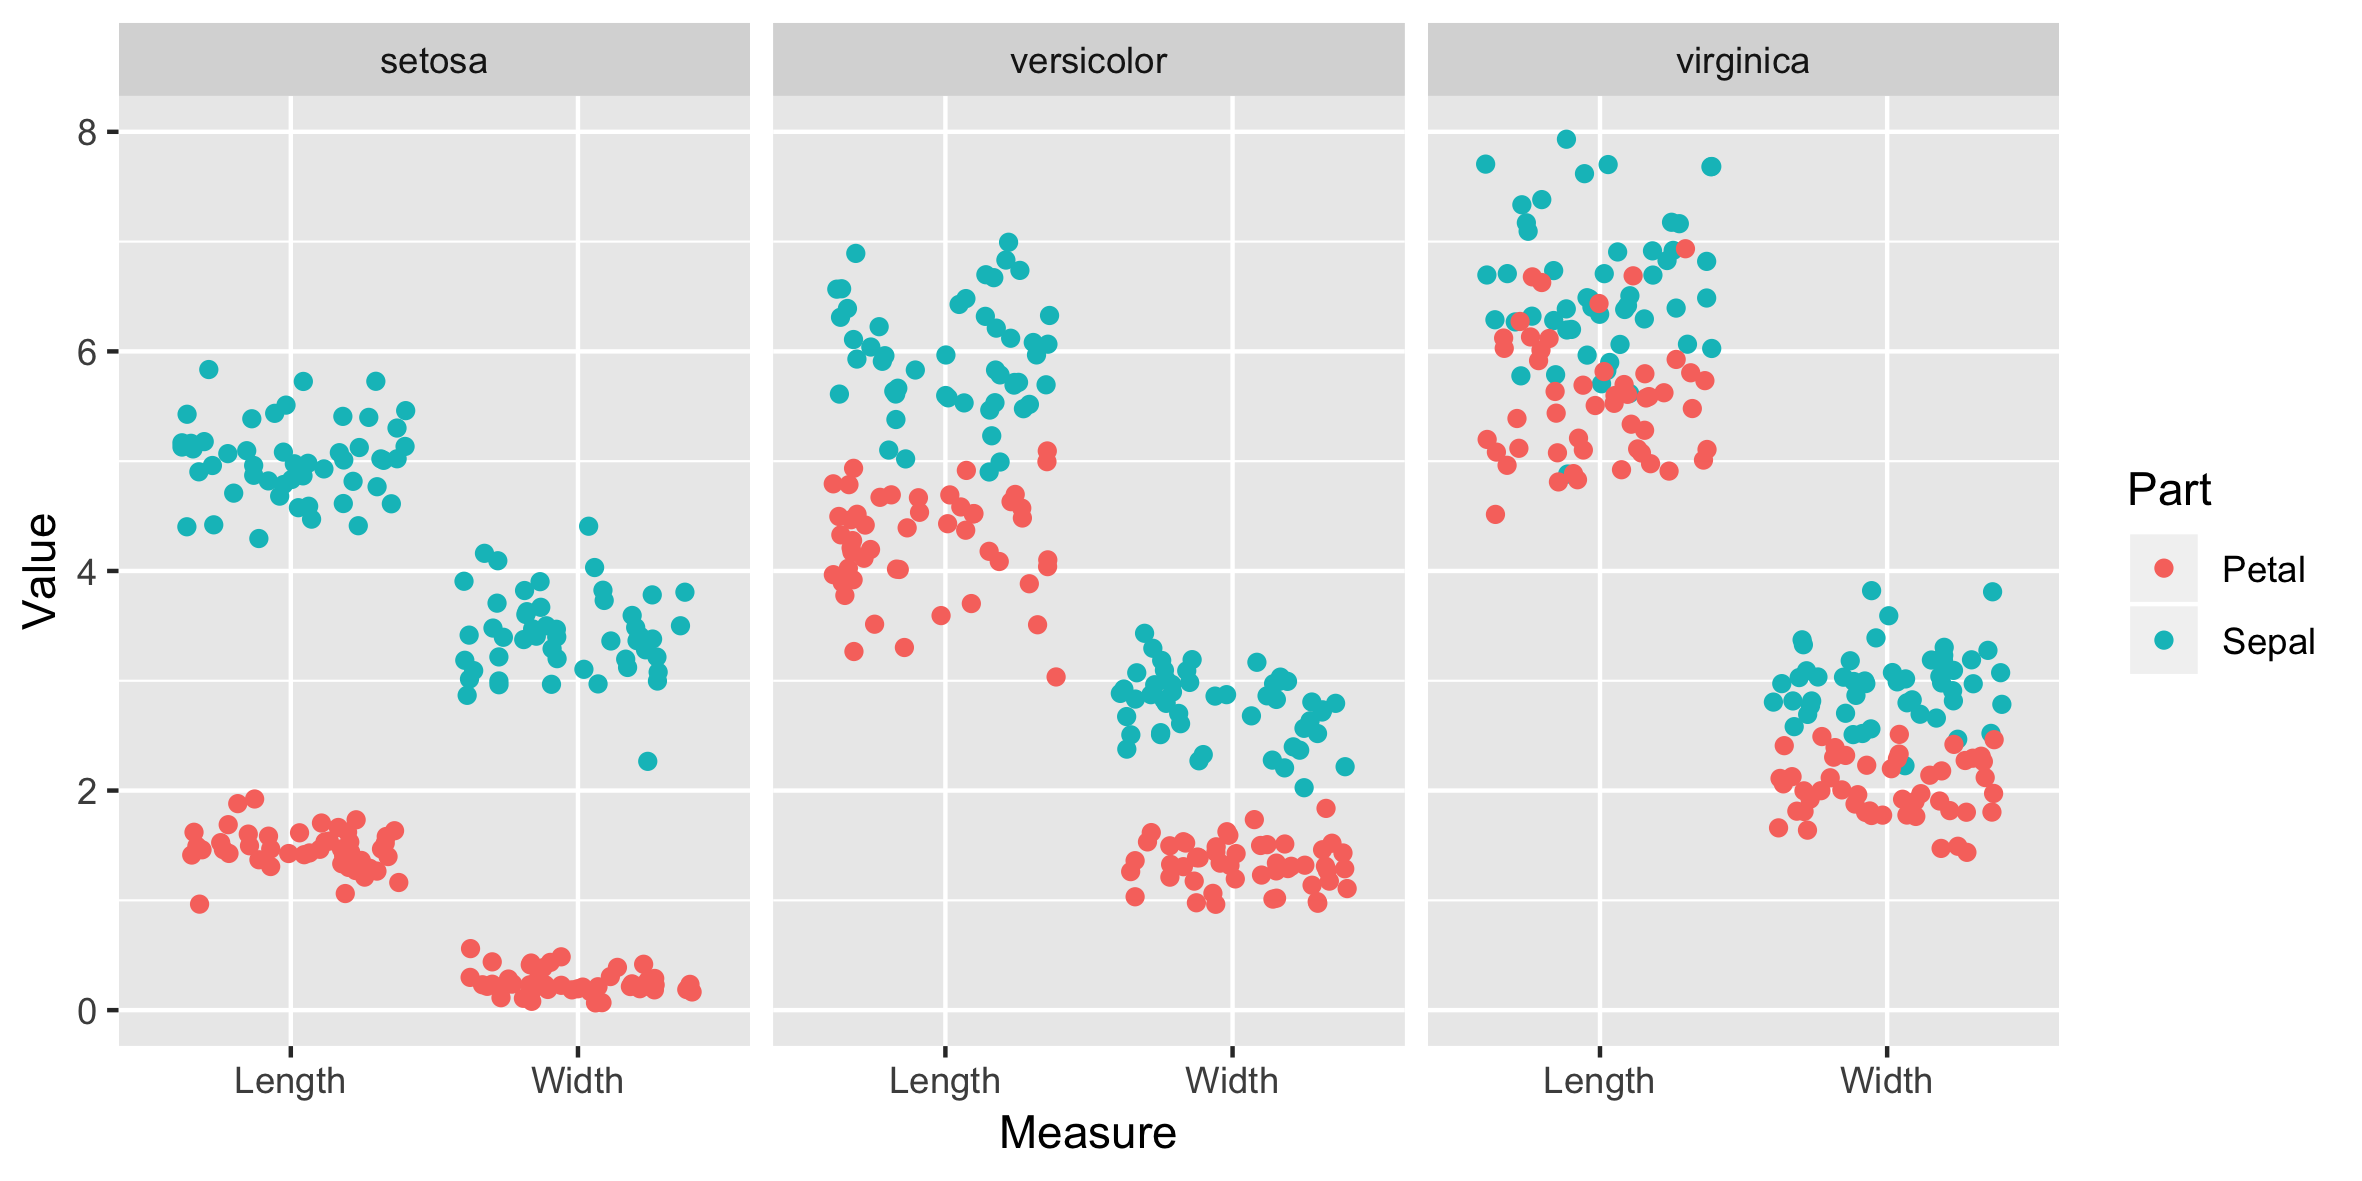
iris.tidy

ggplot(iris.tidy, aes(x = Measure, y = Value, color = Part)) +
  geom_jitter() +
  facet_grid(cols = vars(Species))
ggplot2로 하는 중급 데이터 시각화

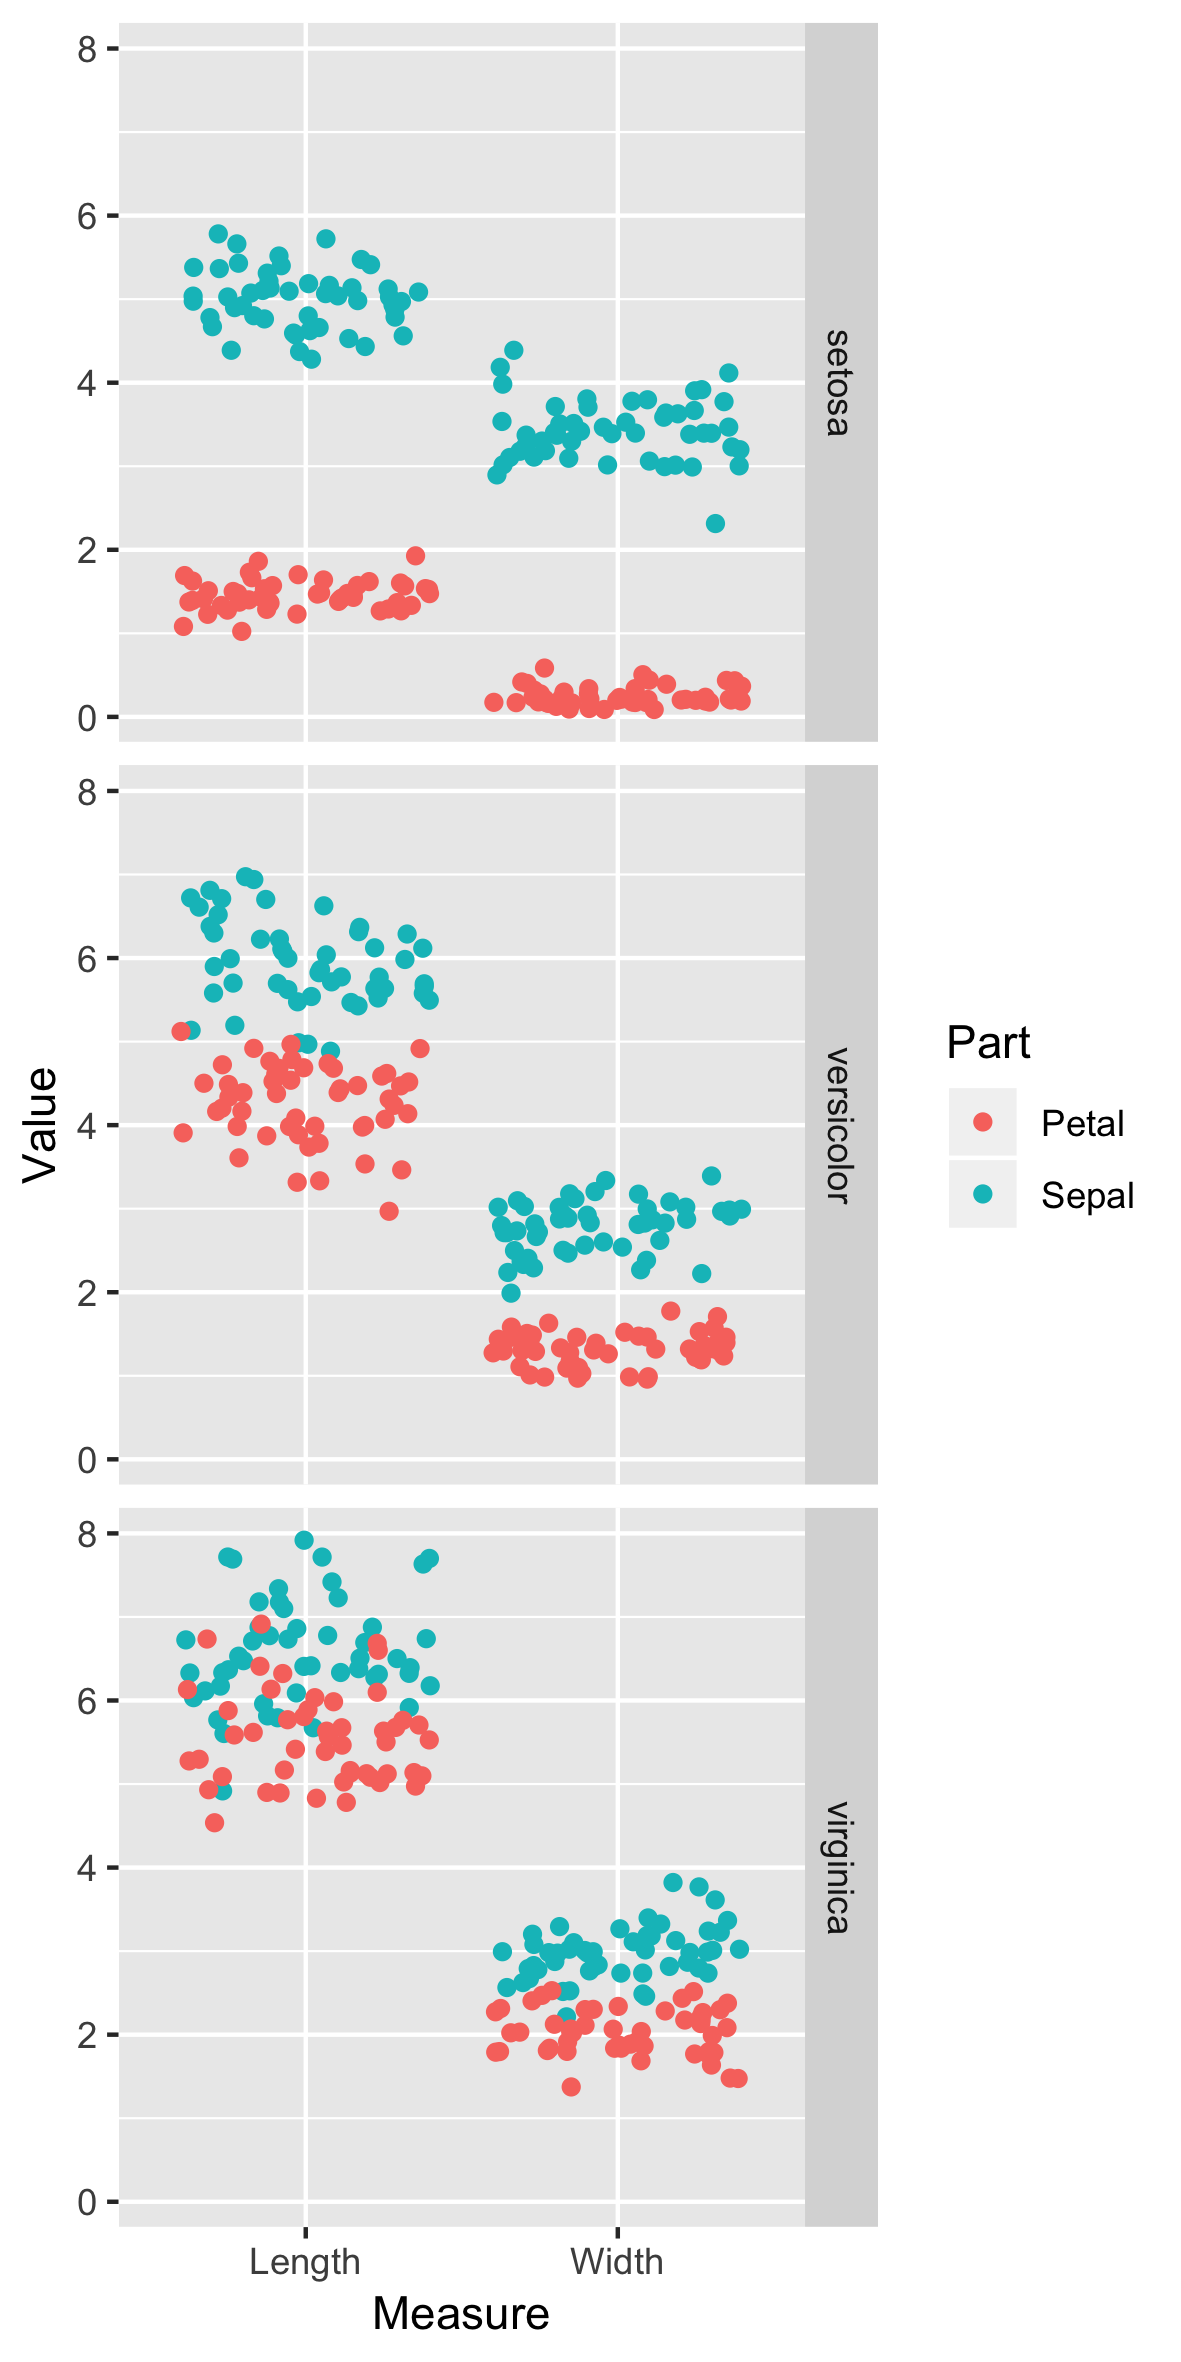
iris.tidy의 잘못된 패싯팅:

ggplot(iris.tidy, aes(x = Measure, 
                      y = Value, 
                      color = Part)) +
  geom_jitter() +
  facet_grid(rows = vars(Species))

ggplot2로 하는 중급 데이터 시각화

기타 옵션

  • 행·열 기준으로 분할 가능
ggplot2로 하는 중급 데이터 시각화

연습해 봅시다!

ggplot2로 하는 중급 데이터 시각화

Preparing Video For Download...