ggplot2로 하는 중급 데이터 시각화
Rick Scavetta
Founder, Scavetta Academy
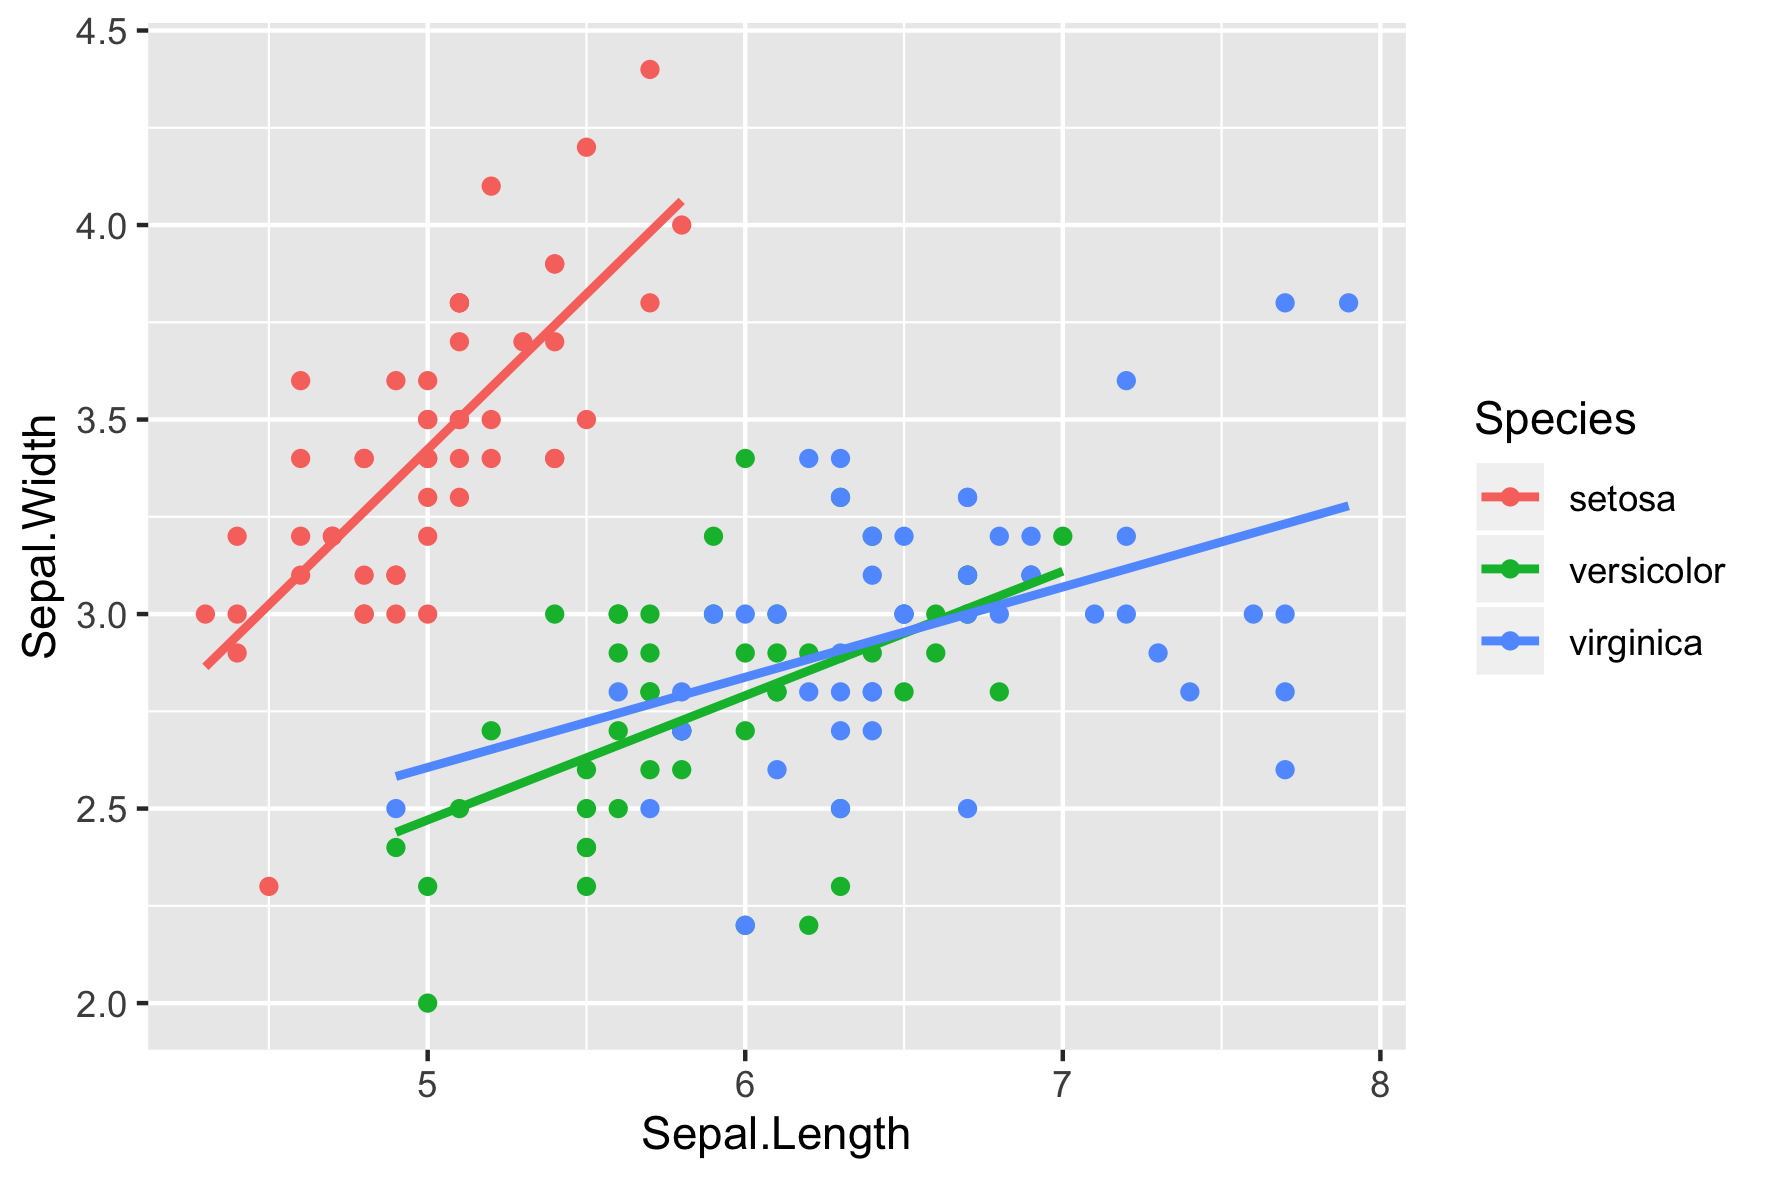
ggplot(iris, aes(x = Sepal.Length,
                 y = Sepal.Width,
                 color = Species)) +
  geom_point() +
  geom_smooth(method = "lm",
              se = FALSE)
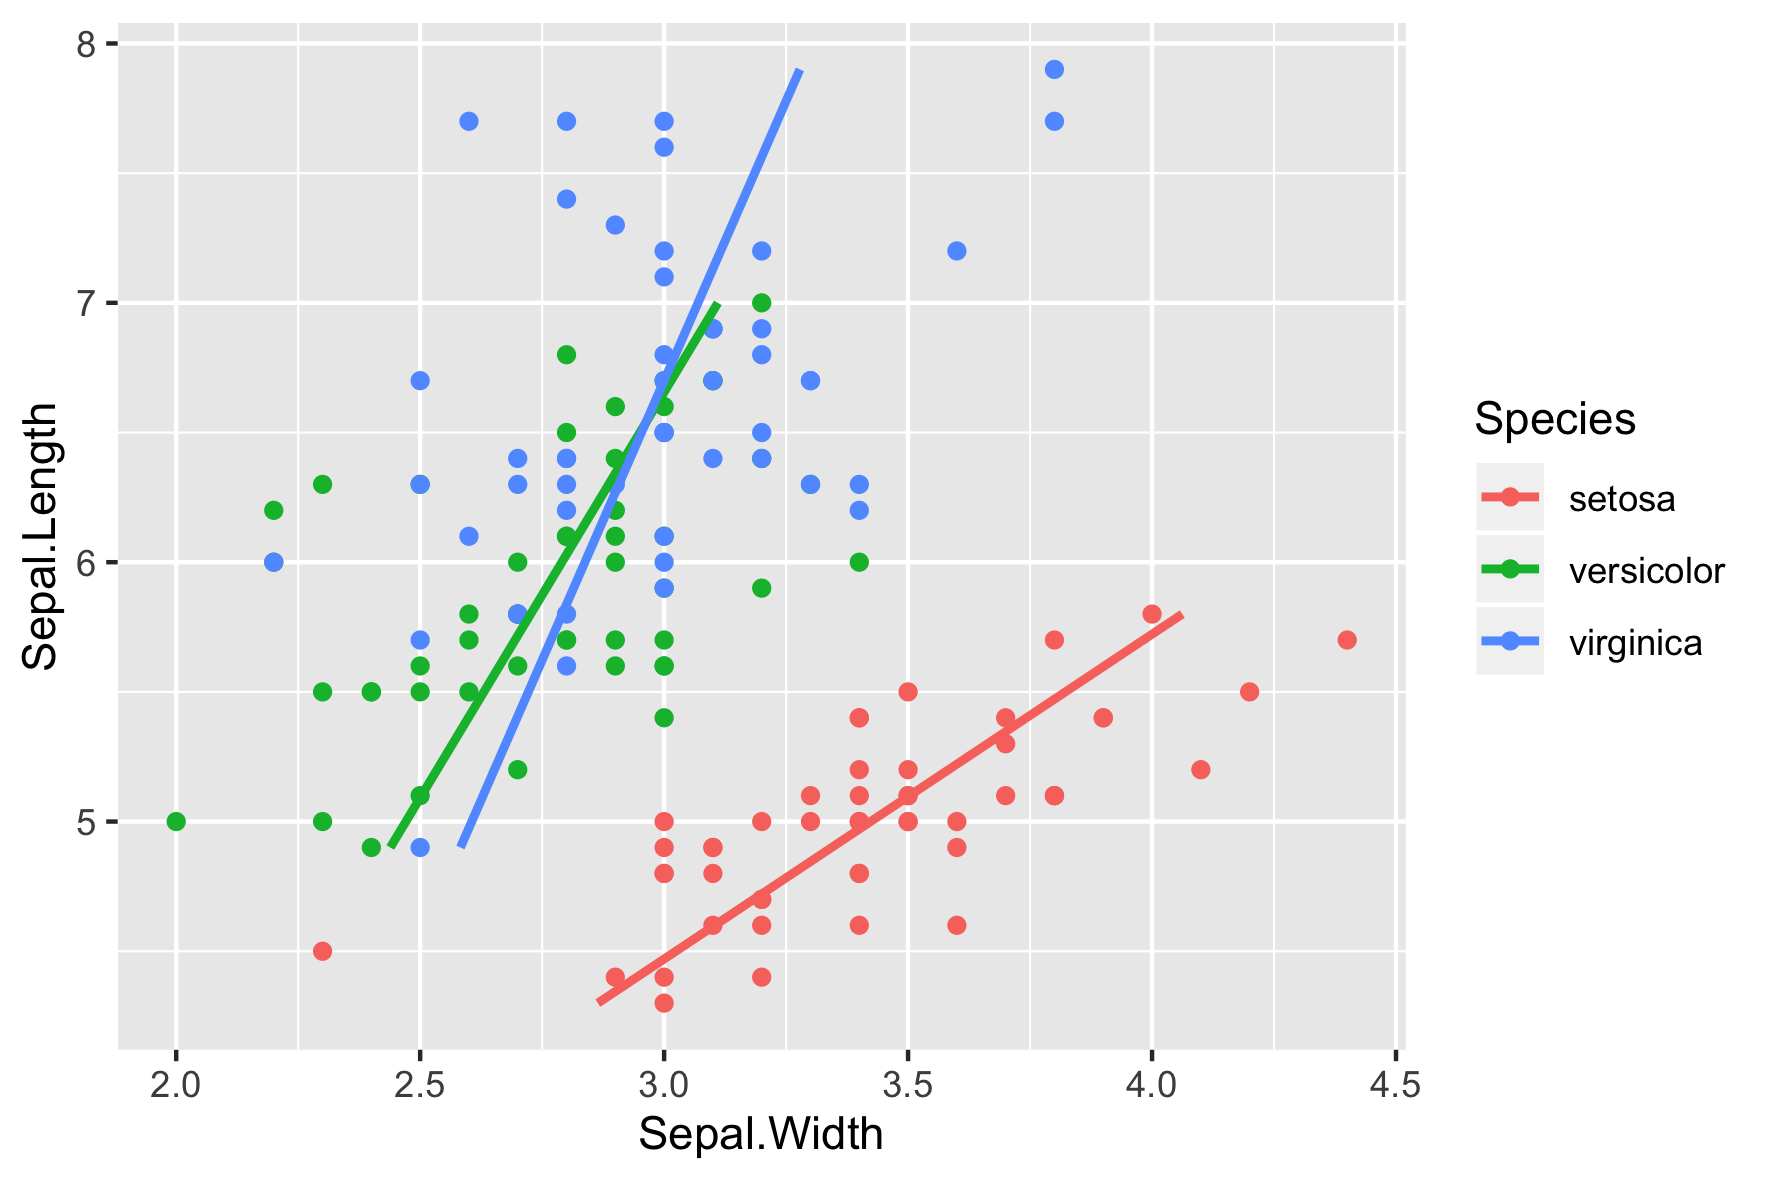
ggplot(iris, aes(x = Sepal.Length,
                 y = Sepal.Width,
                 color = Species)) +
  geom_point() +
  geom_smooth(method = "lm",
              se = FALSE) +
  coord_flip()