Python nâng cao
Hugo Bowne-Anderson
Data Scientist at DataCamp
Nhiều lựa chọn
Nhiều loại biểu đồ
Nhiều cách tùy chỉnh
Tùy chọn phụ thuộc vào
Dữ liệu
Câu chuyện bạn muốn kể
population.py
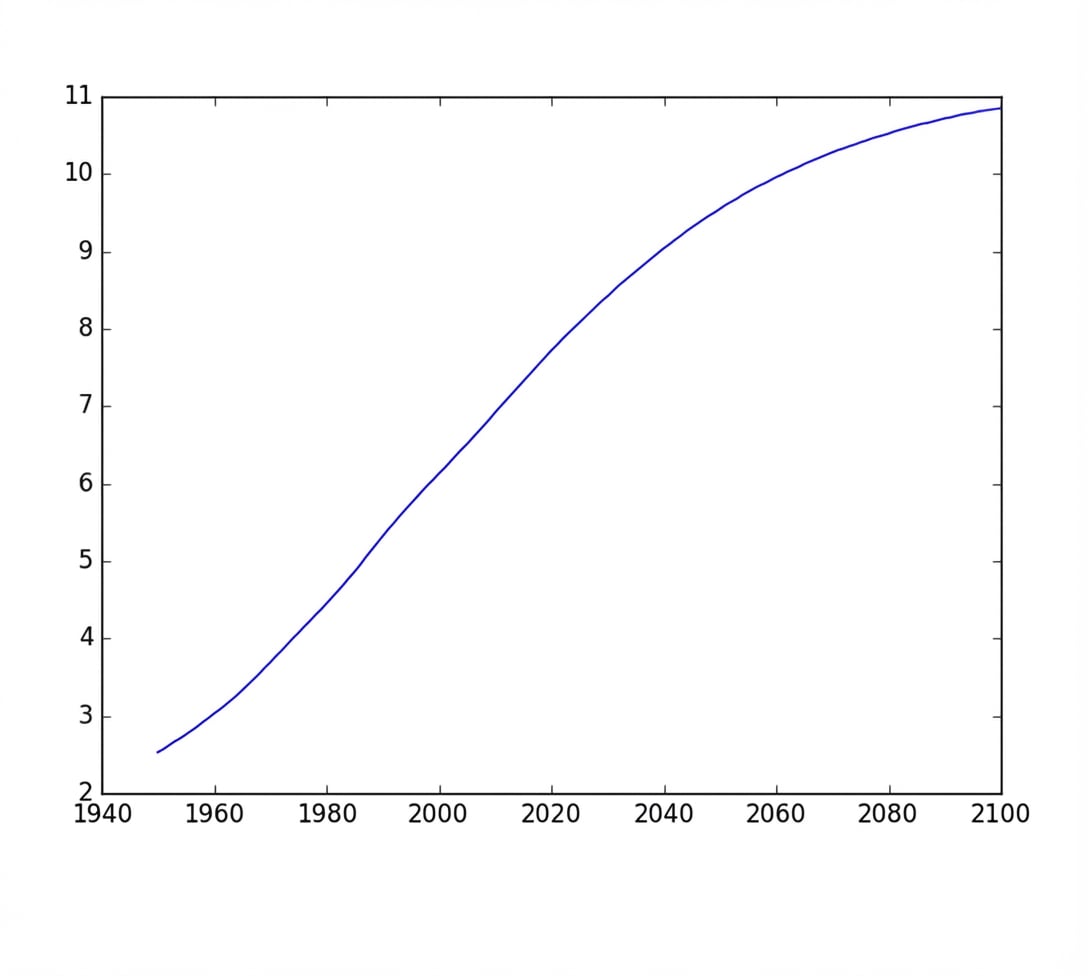
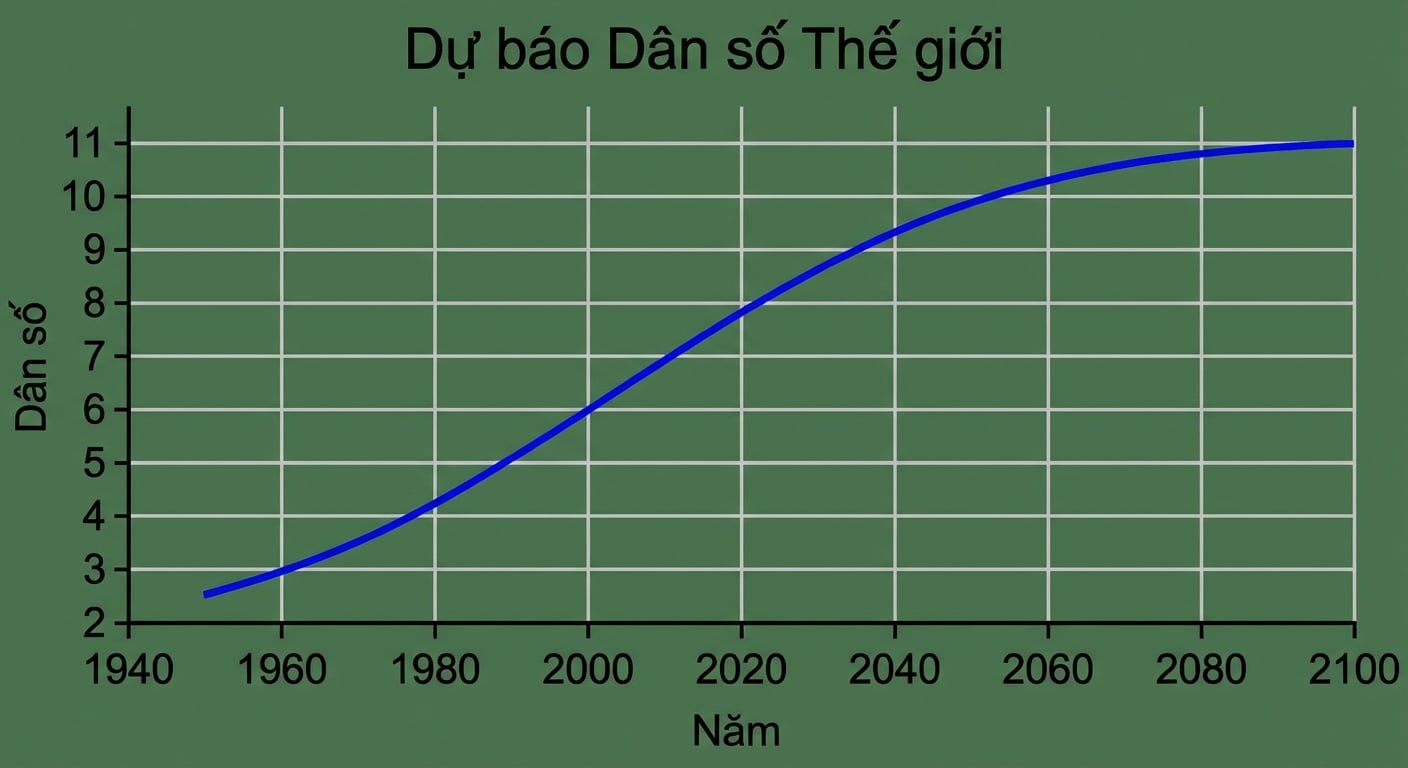
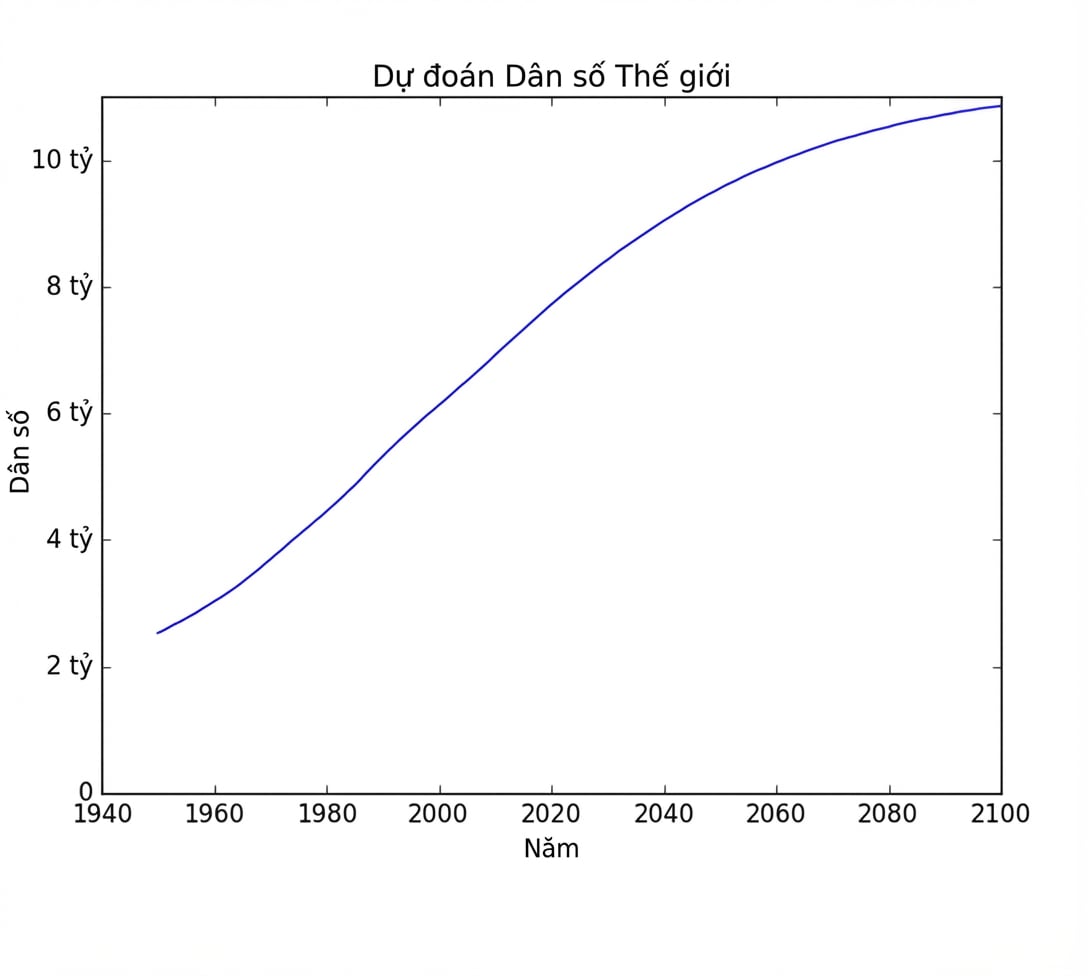
import matplotlib.pyplot as plt
year = [1950, 1951, 1952, ..., 2100]
pop = [2.538, 2.57, 2.62, ..., 10.85]
plt.plot(year, pop)
plt.show()

population.py
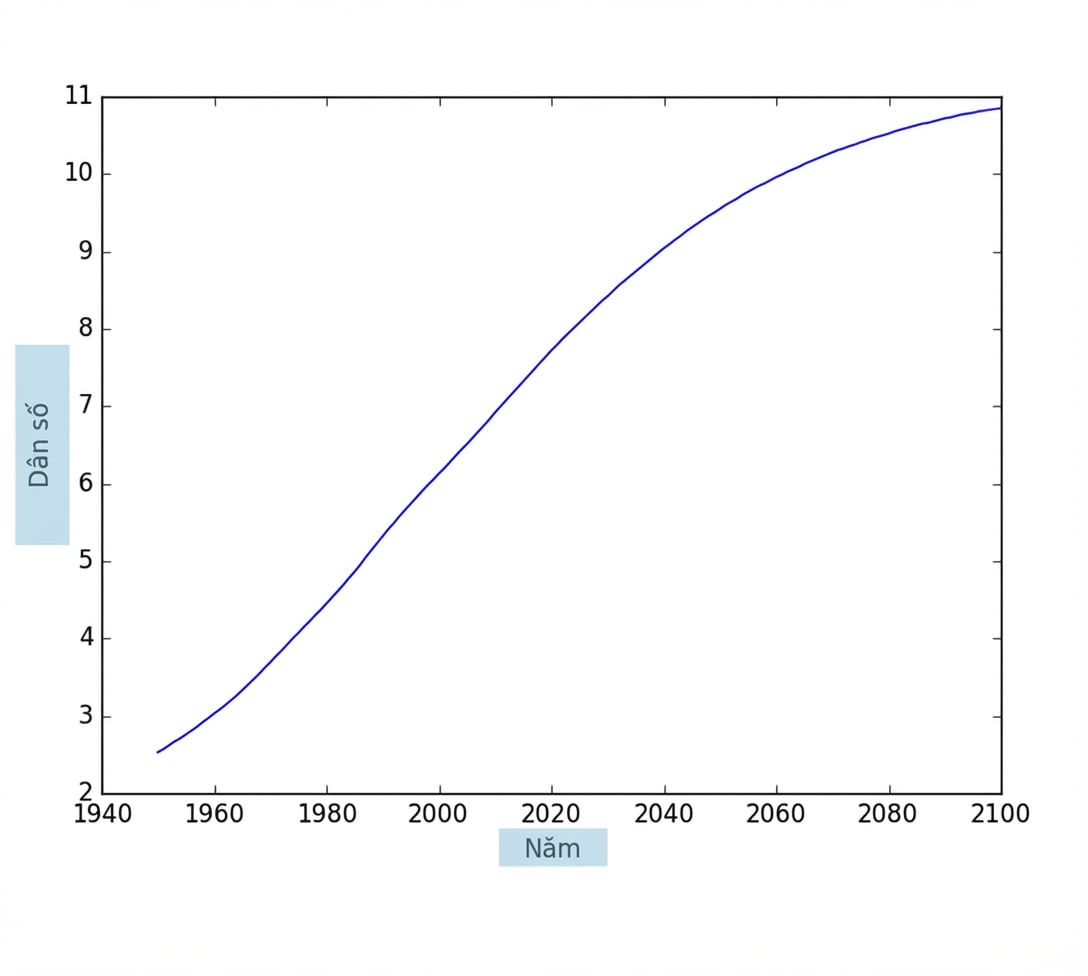
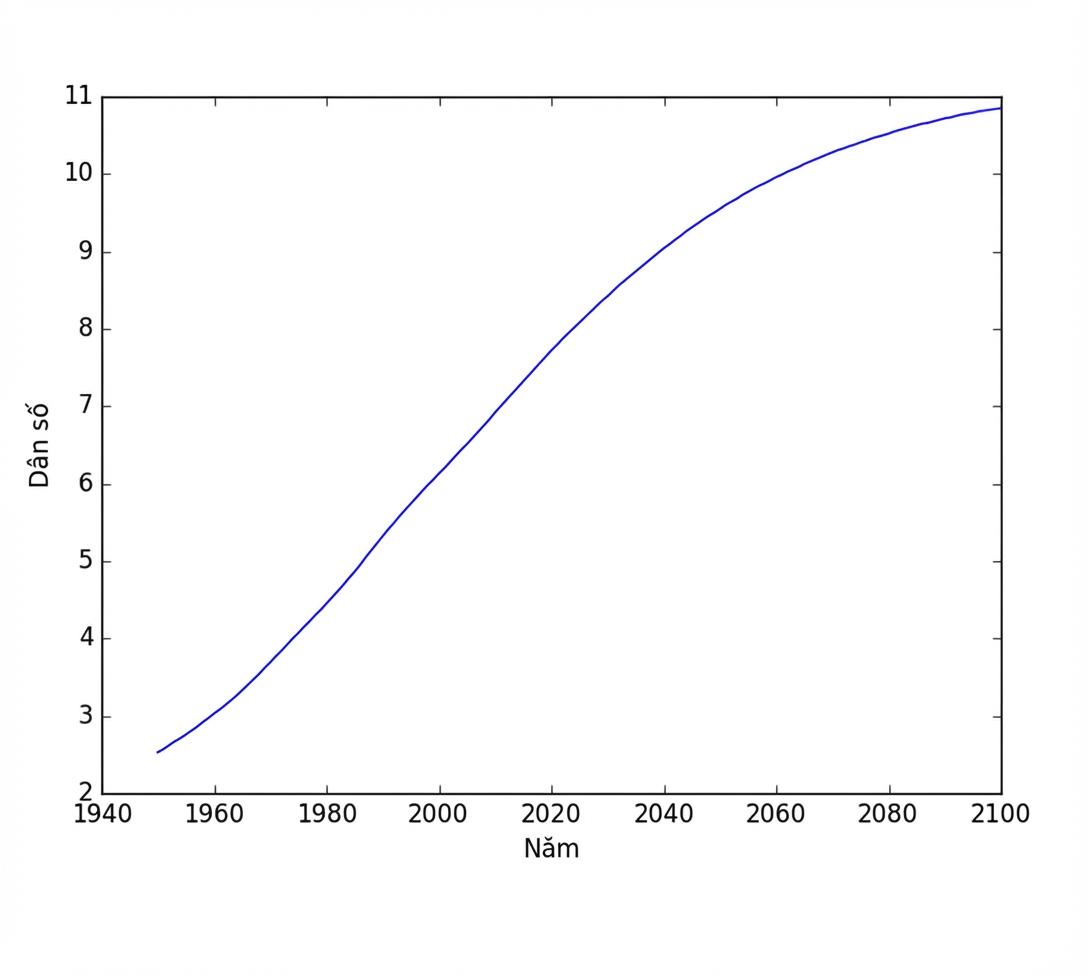
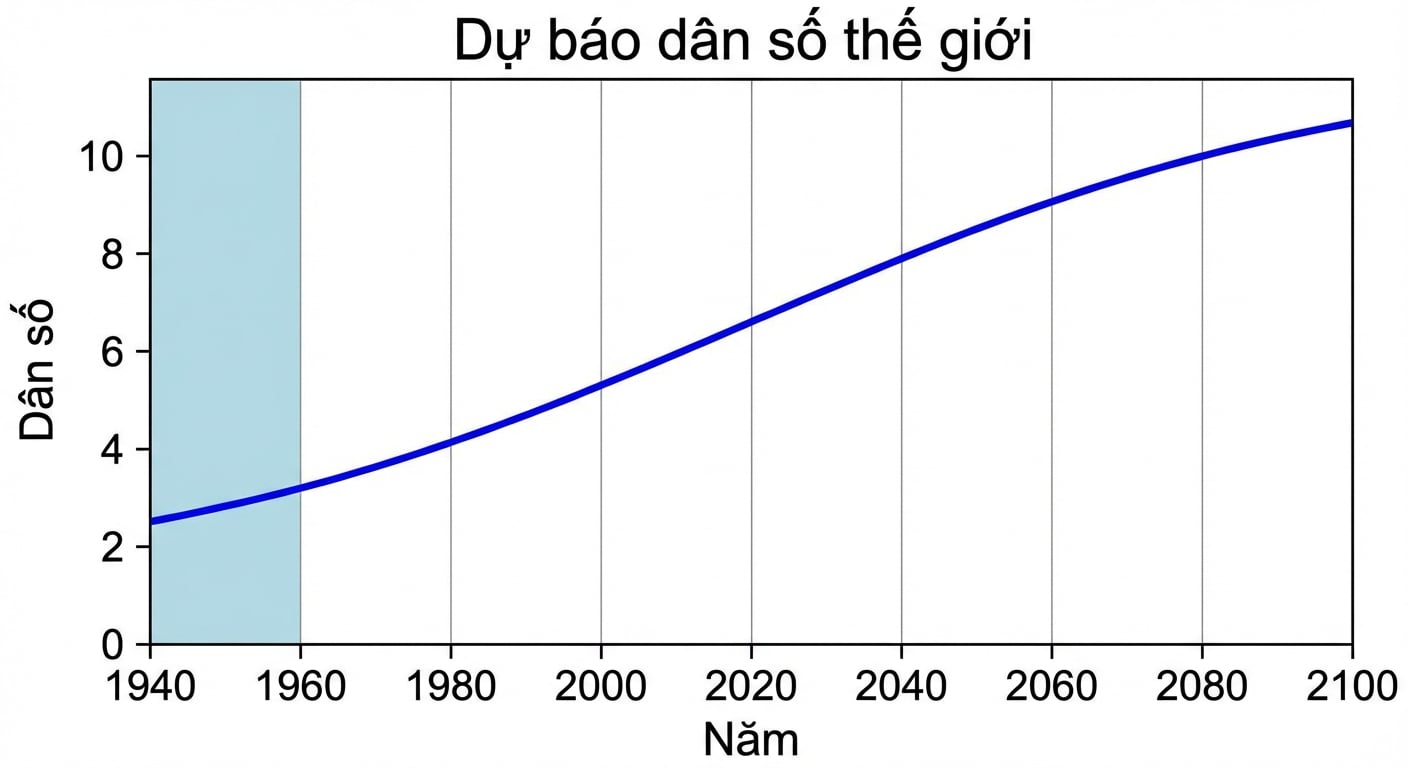
import matplotlib.pyplot as plt year = [1950, 1951, 1952, ..., 2100] pop = [2.538, 2.57, 2.62, ..., 10.85] plt.plot(year, pop)plt.xlabel('Năm') plt.ylabel('Dân số')plt.show()

population.py
import matplotlib.pyplot as plt year = [1950, 1951, 1952, ..., 2100] pop = [2.538, 2.57, 2.62, ..., 10.85] plt.plot(year, pop)plt.xlabel('Năm') plt.ylabel('Dân số')plt.show()

population.py
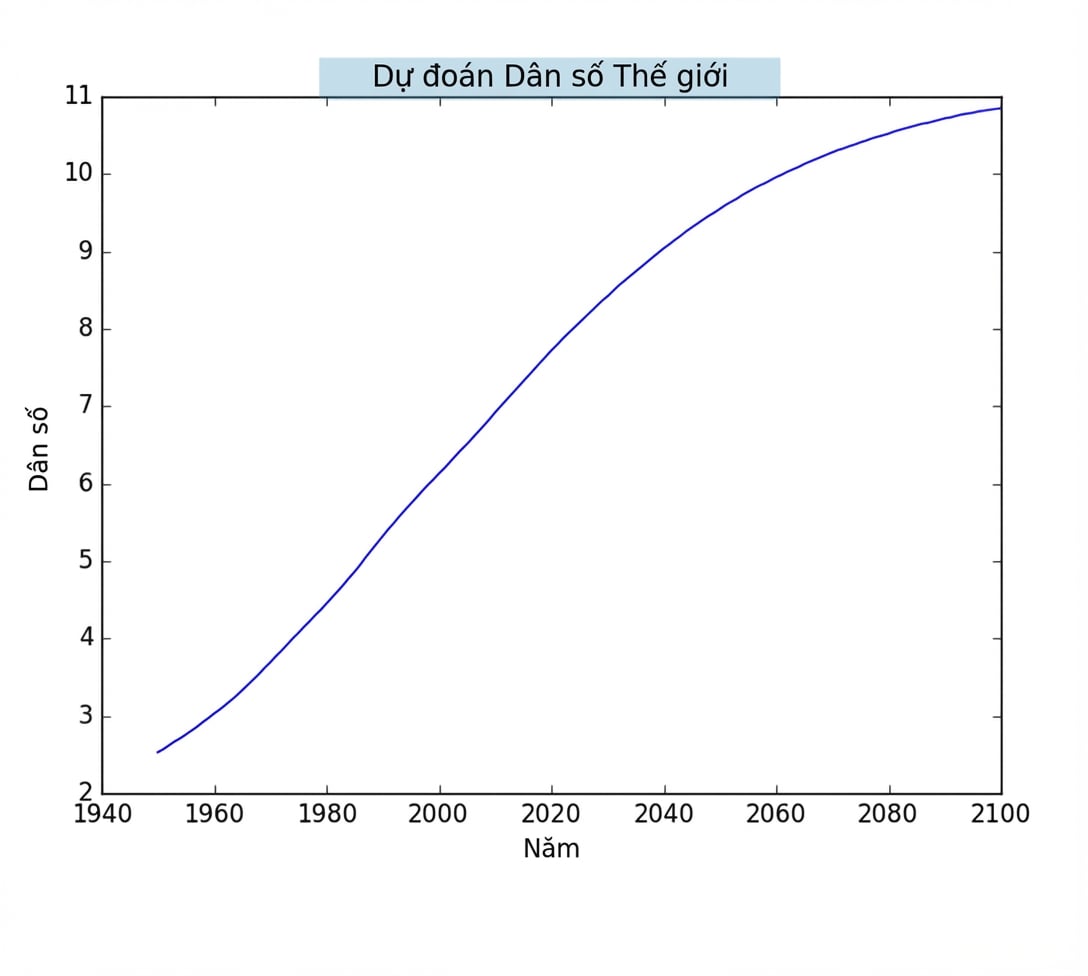
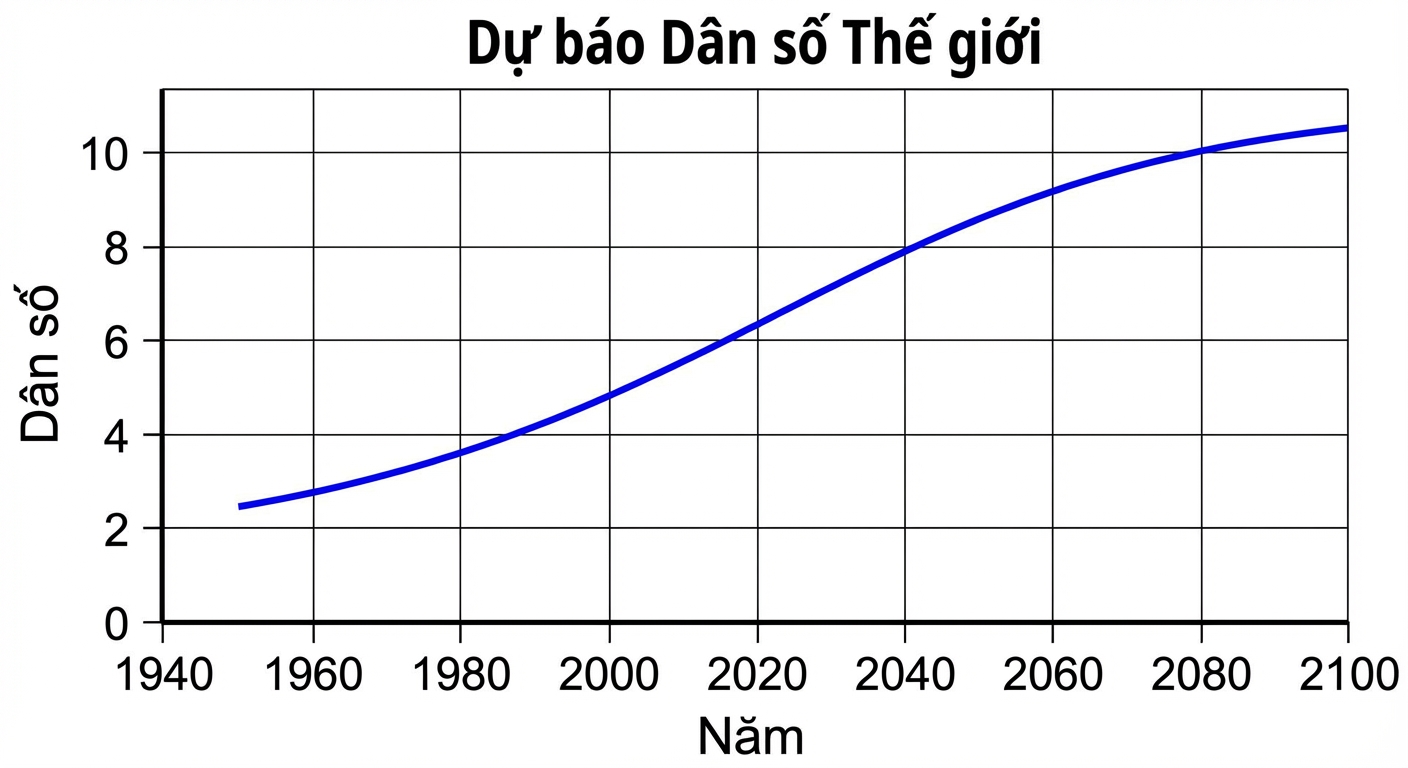
import matplotlib.pyplot as plt year = [1950, 1951, 1952, ..., 2100] pop = [2.538, 2.57, 2.62, ..., 10.85] plt.plot(year, pop)plt.xlabel('Năm') plt.ylabel('Dân số')plt.title('Dự báo dân số thế giới')plt.show()

population.py
import matplotlib.pyplot as plt year = [1950, 1951, 1952, ..., 2100] pop = [2.538, 2.57, 2.62, ..., 10.85] plt.plot(year, pop)plt.xlabel('Năm') plt.ylabel('Dân số')plt.title('Dự báo dân số thế giới')plt.show()

population.py
import matplotlib.pyplot as plt year = [1950, 1951, 1952, ..., 2100] pop = [2.538, 2.57, 2.62, ..., 10.85] plt.plot(year, pop)plt.xlabel('Năm') plt.ylabel('Dân số')plt.title('Dự báo dân số thế giới')plt.yticks([0, 2, 4, 6, 8, 10])plt.show()

population.py
import matplotlib.pyplot as plt year = [1950, 1951, 1952, ..., 2100] pop = [2.538, 2.57, 2.62, ..., 10.85] plt.plot(year, pop)plt.xlabel('Năm') plt.ylabel('Dân số')plt.title('Dự báo dân số thế giới')plt.yticks([0, 2, 4, 6, 8, 10])plt.show()

population.py
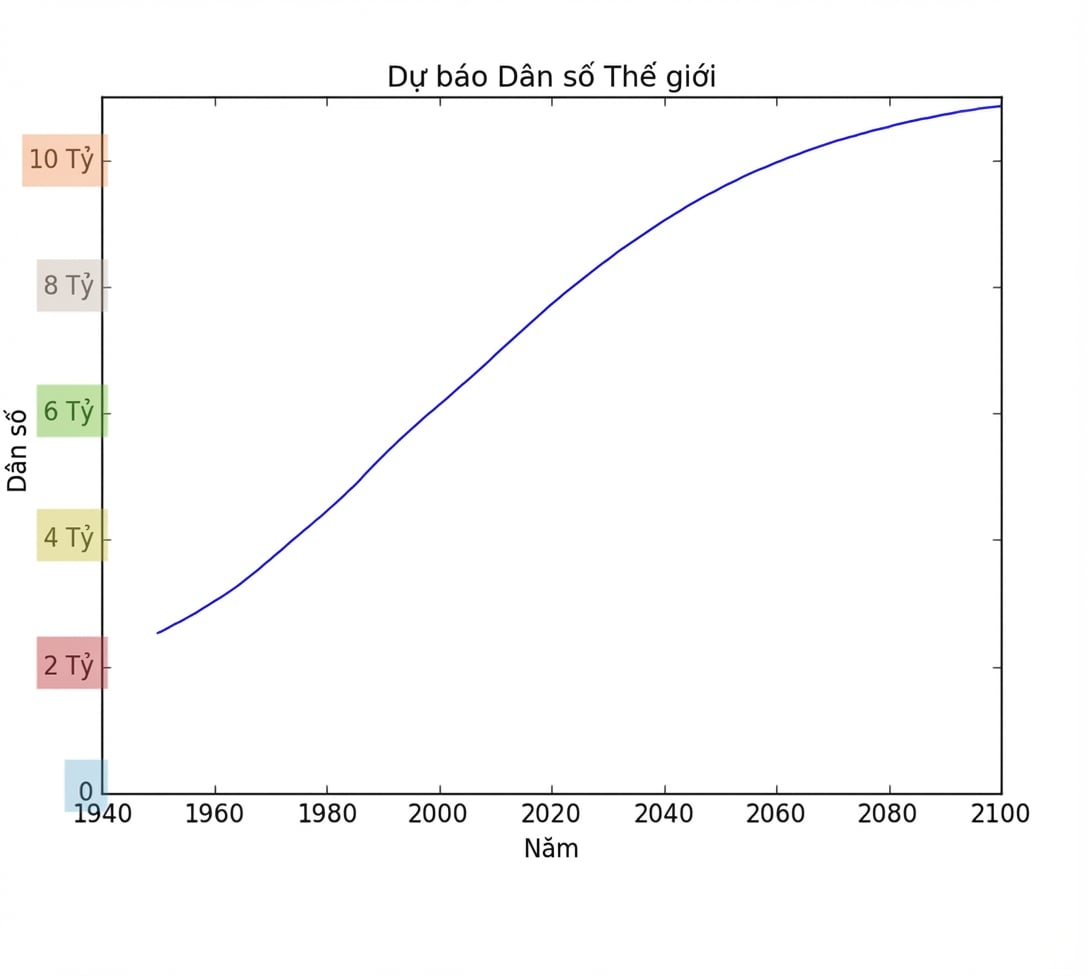
import matplotlib.pyplot as plt year = [1950, 1951, 1952, ..., 2100] pop = [2.538, 2.57, 2.62, ..., 10.85] plt.plot(year, pop)plt.xlabel('Năm') plt.ylabel('Dân số')plt.title('Dự báo dân số thế giới')plt.yticks([0, 2, 4, 6, 8, 10],['0', '2B', '4B', '6B', '8B', '10B'])plt.show()

population.py
import matplotlib.pyplot as plt year = [1950, 1951, 1952, ..., 2100] pop = [2.538, 2.57, 2.62, ..., 10.85] plt.plot(year, pop)plt.xlabel('Năm') plt.ylabel('Dân số')plt.title('Dự báo dân số thế giới')plt.yticks([0, 2, 4, 6, 8, 10],['0', '2B', '4B', '6B', '8B', '10B'])plt.show()

population.py
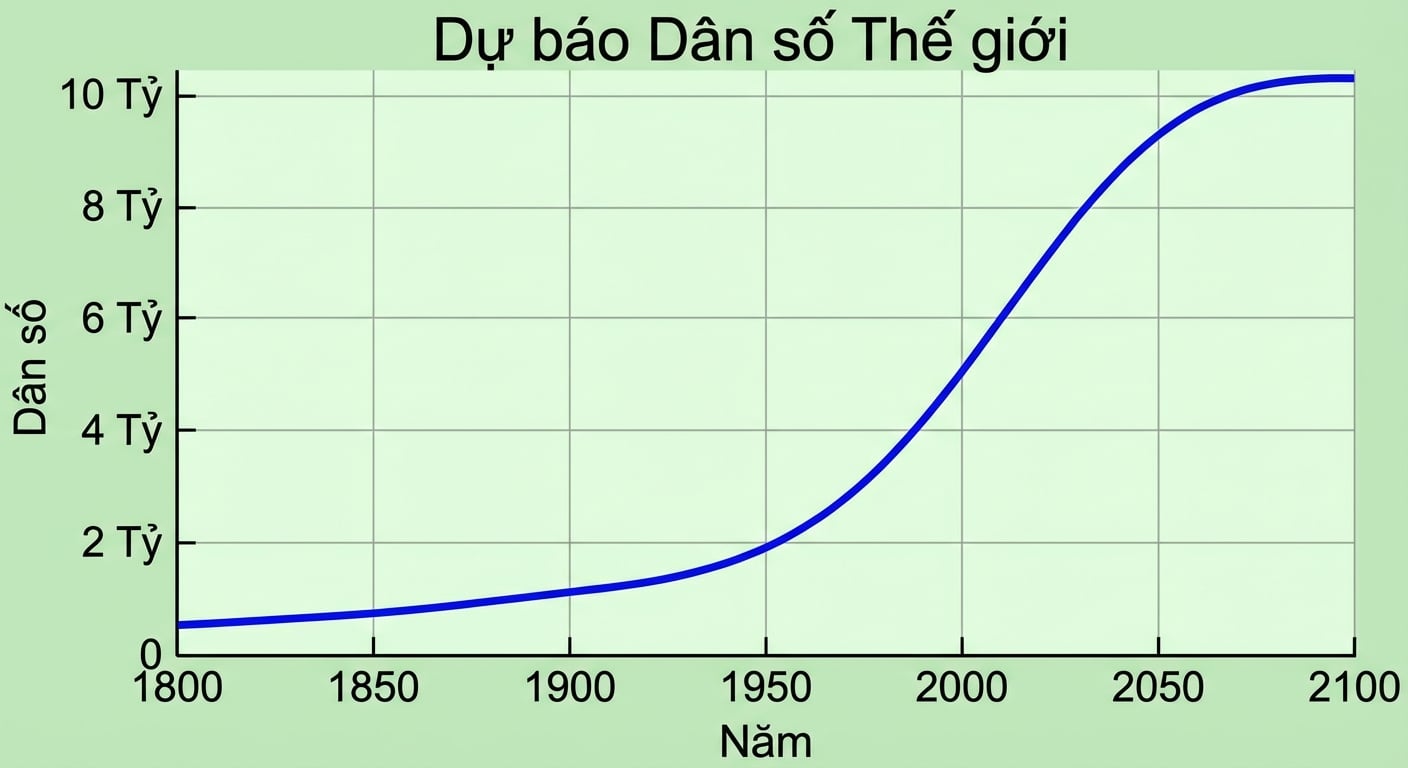
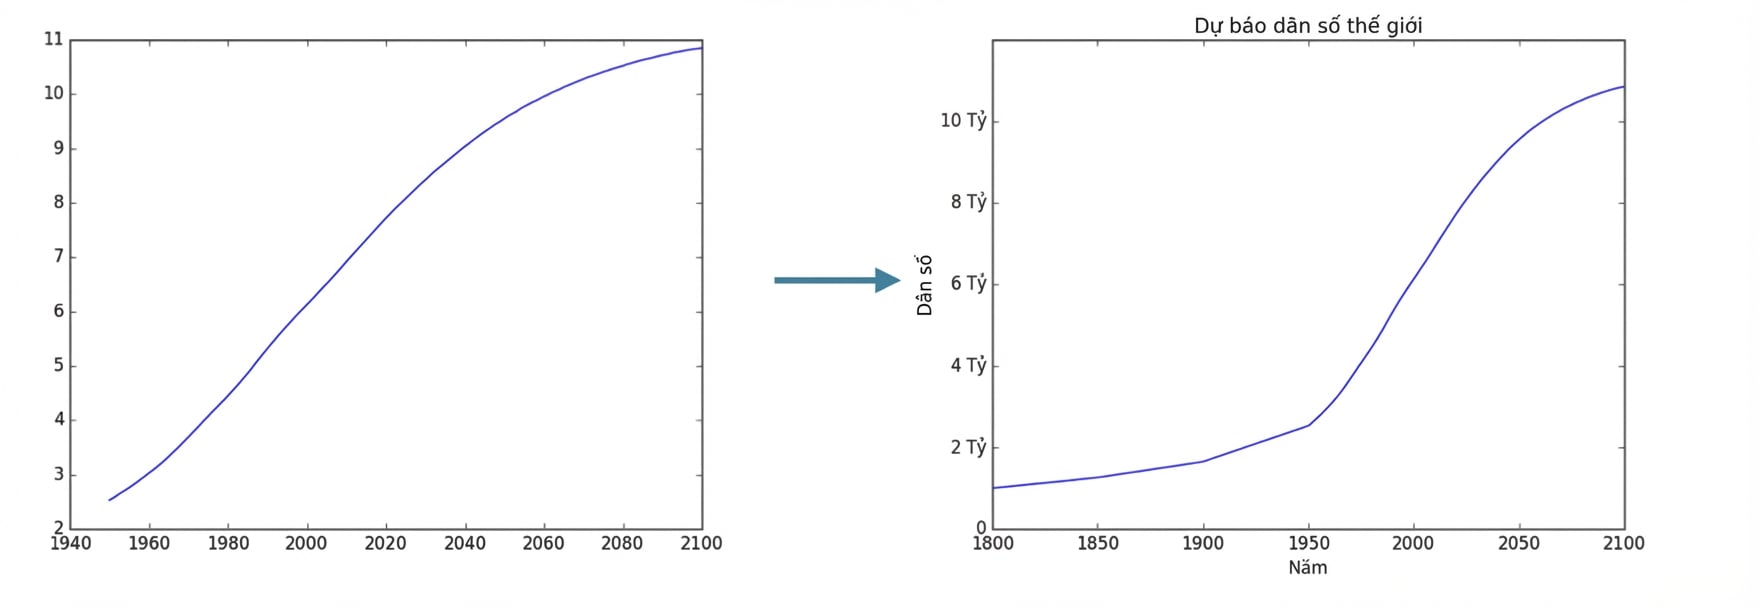
import matplotlib.pyplot as plt year = [1950, 1951, 1952, ..., 2100] pop = [2.538, 2.57, 2.62, ..., 10.85]# Thêm dữ liệu year = [1800, 1850, 1900] + year pop = [1.0, 1.262, 1.650] + popplt.plot(year, pop)plt.xlabel('Năm') plt.ylabel('Dân số')plt.title('Dự báo dân số thế giới')plt.yticks([0, 2, 4, 6, 8, 10],['0', '2B', '4B', '6B', '8B', '10B'])plt.show()

population.py
import matplotlib.pyplot as plt year = [1950, 1951, 1952, ..., 2100] pop = [2.538, 2.57, 2.62, ..., 10.85]# Thêm dữ liệu year = [1800, 1850, 1900] + year pop = [1.0, 1.262, 1.650] + popplt.plot(year, pop)plt.xlabel('Năm') plt.ylabel('Dân số')plt.title('Dự báo dân số thế giới')plt.yticks([0, 2, 4, 6, 8, 10],['0', '2B', '4B', '6B', '8B', '10B'])plt.show()


Python nâng cao