Chúc mừng

Phân tích dữ liệu khám phá trong Python

George Boorman

Curriculum Manager, DataCamp

Kiểm tra và xác thực
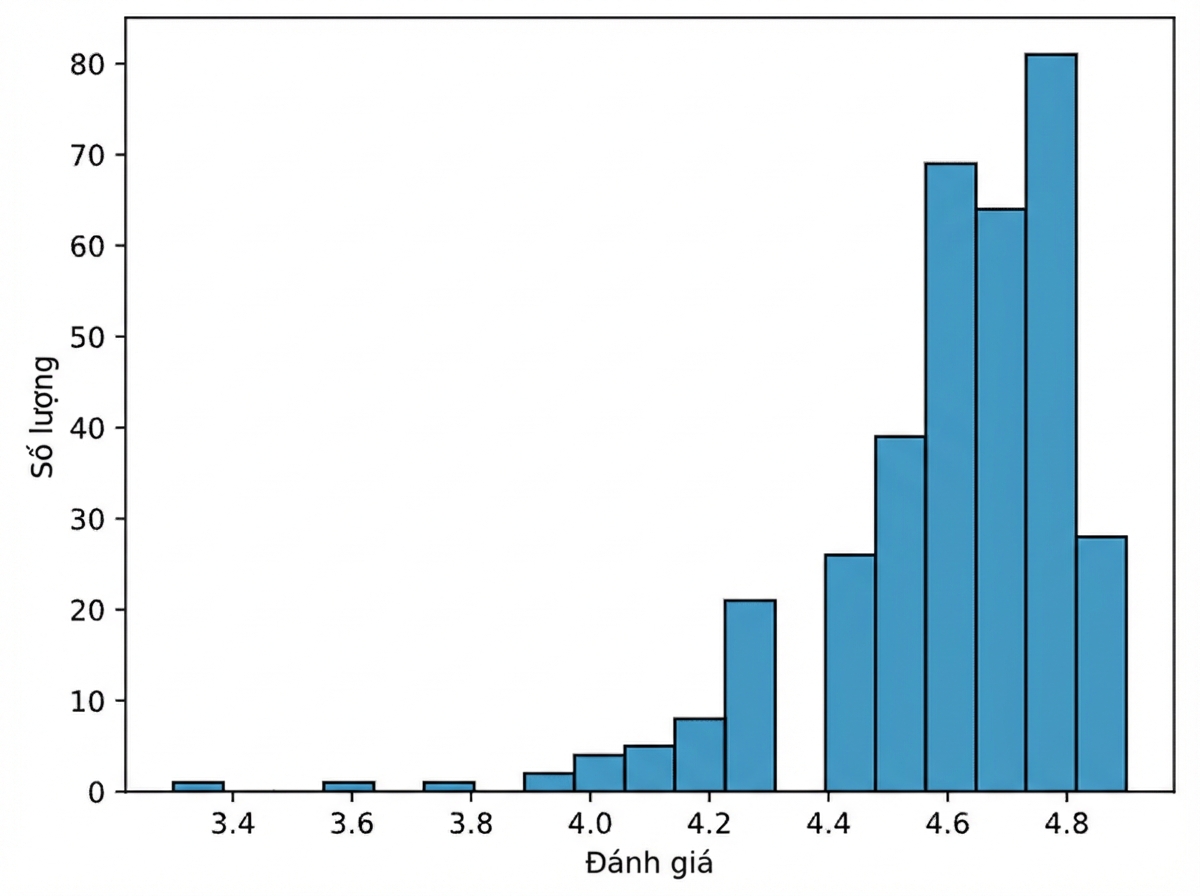
biểu đồ tần suất (histogram) của điểm sách

books["year"] = books["year"].astype(int)
books.dtypes
name       object
author     object
rating    float64
year        int64
genre      object
dtype: object
Phân tích dữ liệu khám phá trong Python

Tổng hợp (Aggregation)

books.groupby("genre").agg(
    mean_rating=("rating", "mean"),
    std_rating=("rating", "std"),
    median_year=("year", "median")
)
|  genre      | mean_rating | std_rating | median_year |
|-------------|-------------|------------|-------------|
|   Childrens |    4.780000 |   0.122370 |      2015.0 |
|     Fiction |    4.570229 |   0.281123 |      2013.0 |
| Non Fiction |    4.598324 |   0.179411 |      2013.0 |
Phân tích dữ liệu khám phá trong Python

Xử lý dữ liệu thiếu

print(salaries.isna().sum())
Working_Year            12
Designation             27
Experience              33
Employment_Status       31
Employee_Location       28
Company_Size            40
Remote_Working_Ratio    24
Salary_USD              60
dtype: int64
Phân tích dữ liệu khám phá trong Python

Xử lý dữ liệu thiếu

  • Loại bỏ giá trị thiếu


  • Bù bằng mean, median, mode


  • Bù theo nhóm phụ


salaries_dict = salaries.groupby("Experience")["Salary_USD"].median().to_dict()
salaries["Salary_USD"] = salaries["Salary_USD"].fillna(salaries["Experience"].map(salaries_dict))
Phân tích dữ liệu khám phá trong Python

Phân tích dữ liệu phân loại

salaries["Job_Category"] = np.select(conditions, 
                                     job_categories, 
                                     default="Other")
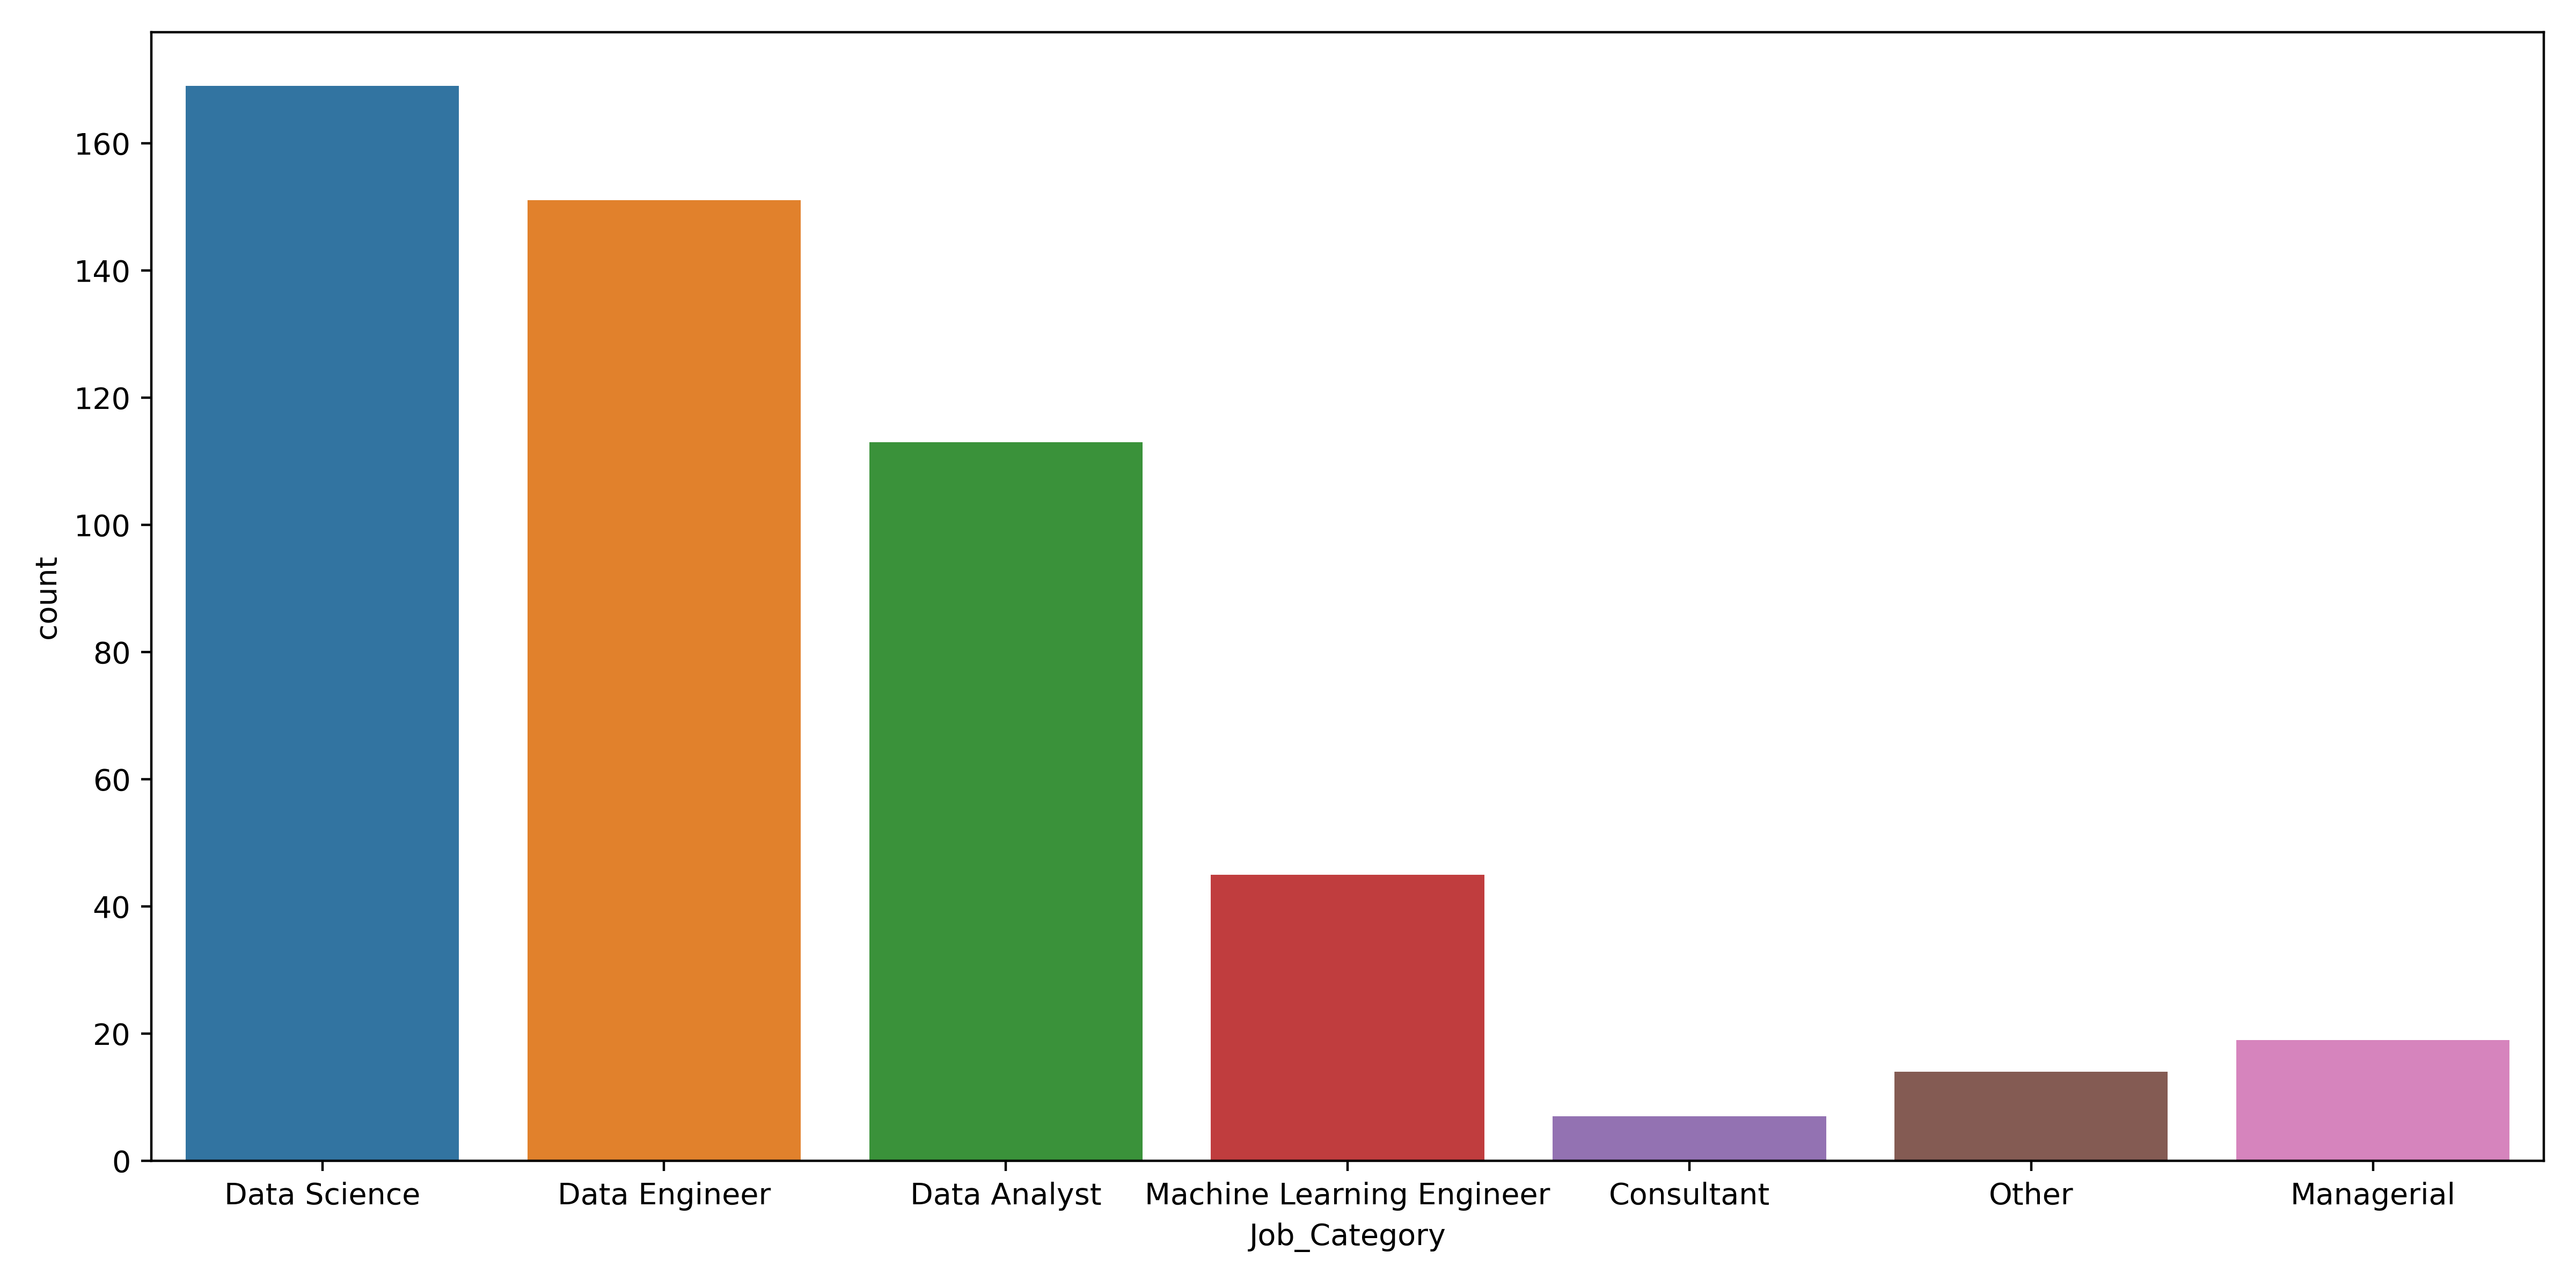
Biểu đồ cột đếm số việc làm theo nhóm

Phân tích dữ liệu khám phá trong Python

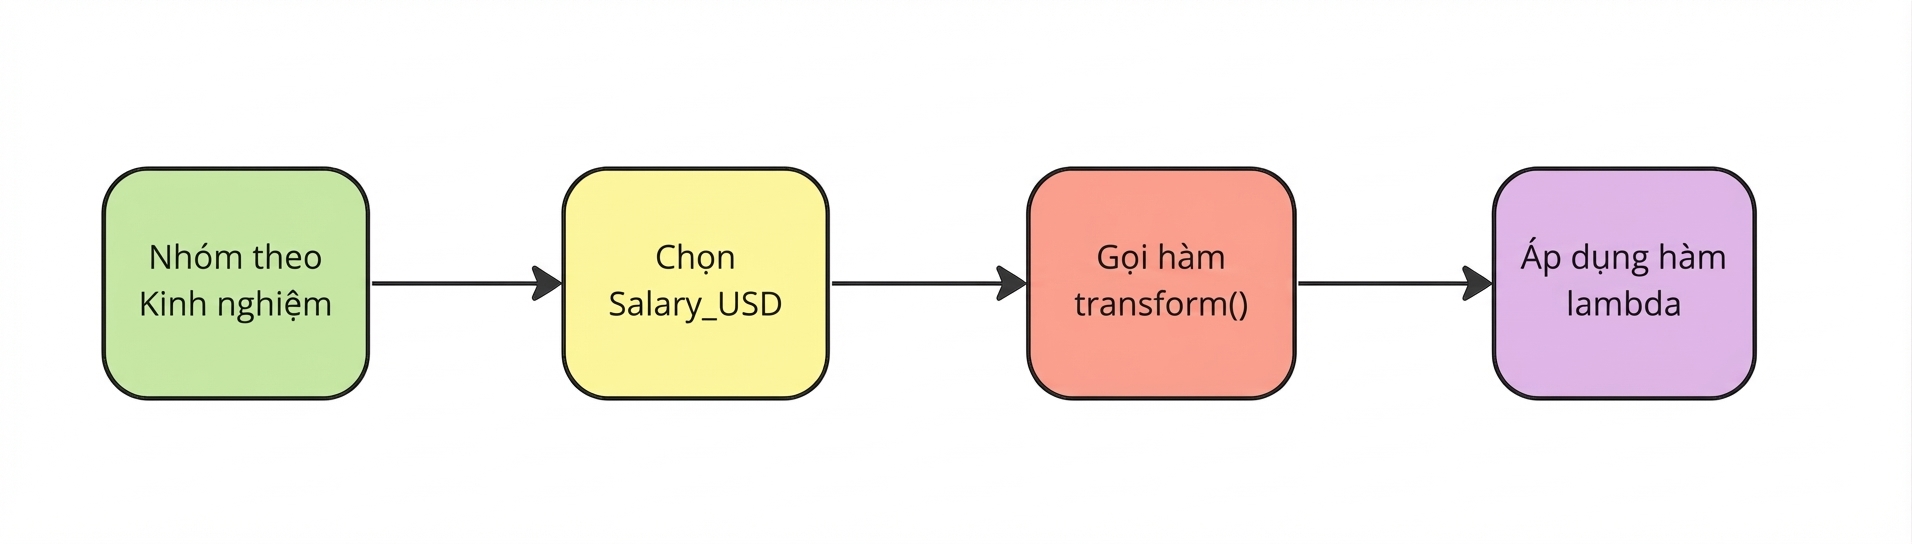
Áp dụng hàm lambda

Áp dụng hàm lambda

salaries["std_dev"] = salaries.groupby("Experience")["Salary_USD"].transform(lambda x: x.std())
Phân tích dữ liệu khám phá trong Python

Xử lý ngoại lệ

sns.boxplot(data=salaries,
            y="Salary_USD")
plt.show()
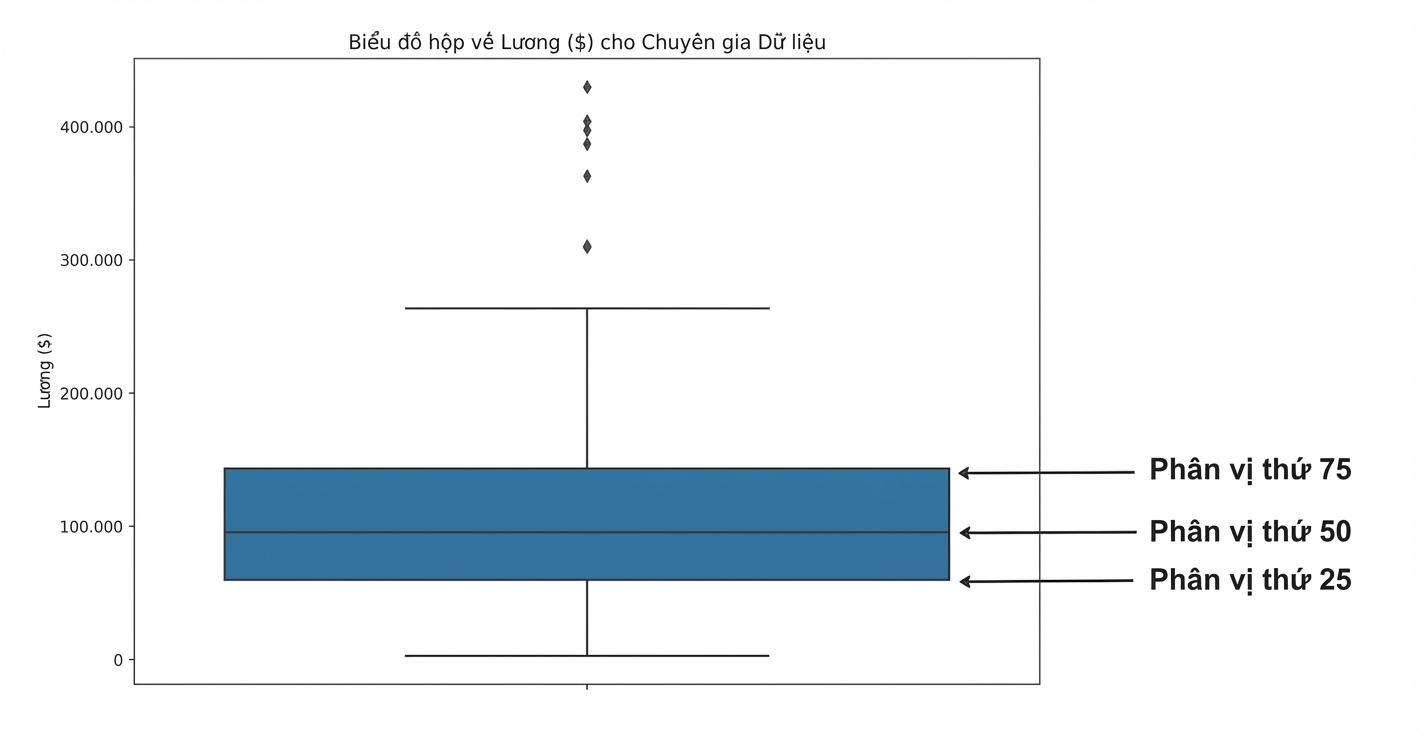
Box plot lương của chuyên gia dữ liệu, với tứ phân vị 25% ở đáy hộp, 50% là đường giữa, 75% ở đỉnh hộp

Phân tích dữ liệu khám phá trong Python

Mẫu theo thời gian

sns.lineplot(data=divorce, x="marriage_month", y="marriage_duration")
plt.show()
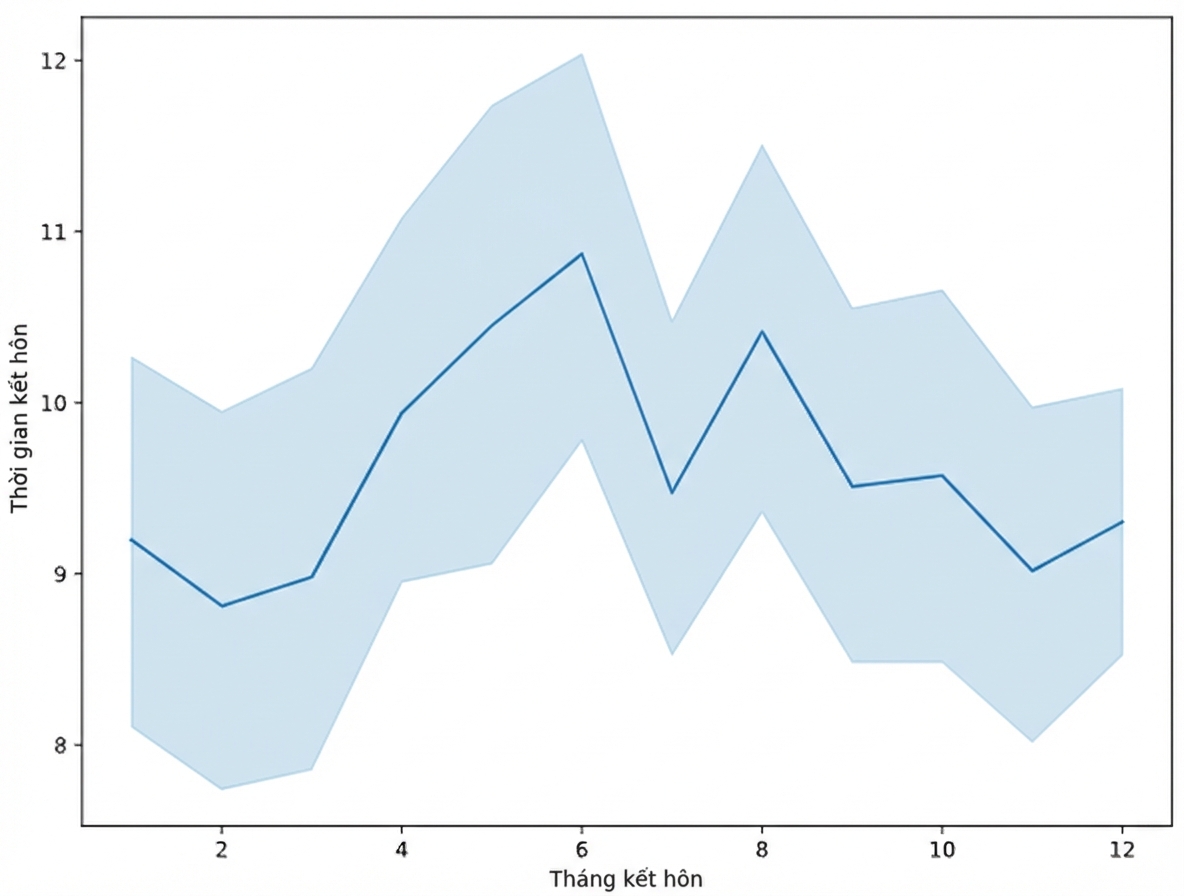
Biểu đồ đường về mối quan hệ giữa tháng kết hôn và thời lượng hôn nhân

Phân tích dữ liệu khám phá trong Python

Tương quan

sns.heatmap(divorce.corr(numeric_only=True), annot=True)
plt.show()
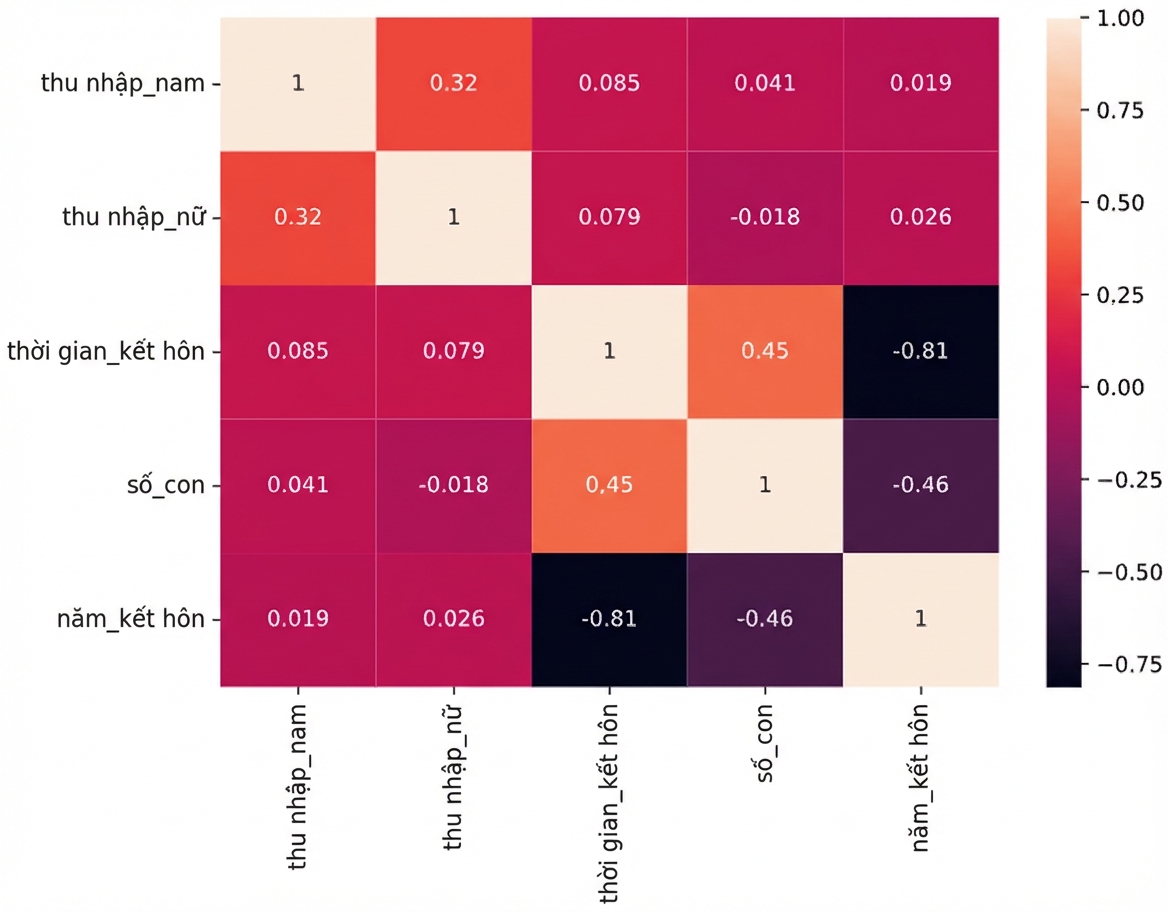
Bản đồ nhiệt hệ số tương quan về ly hôn

Phân tích dữ liệu khám phá trong Python

Phân phối

sns.kdeplot(data=divorce, x="marriage_duration", hue="education_man", cut=0)
plt.show()
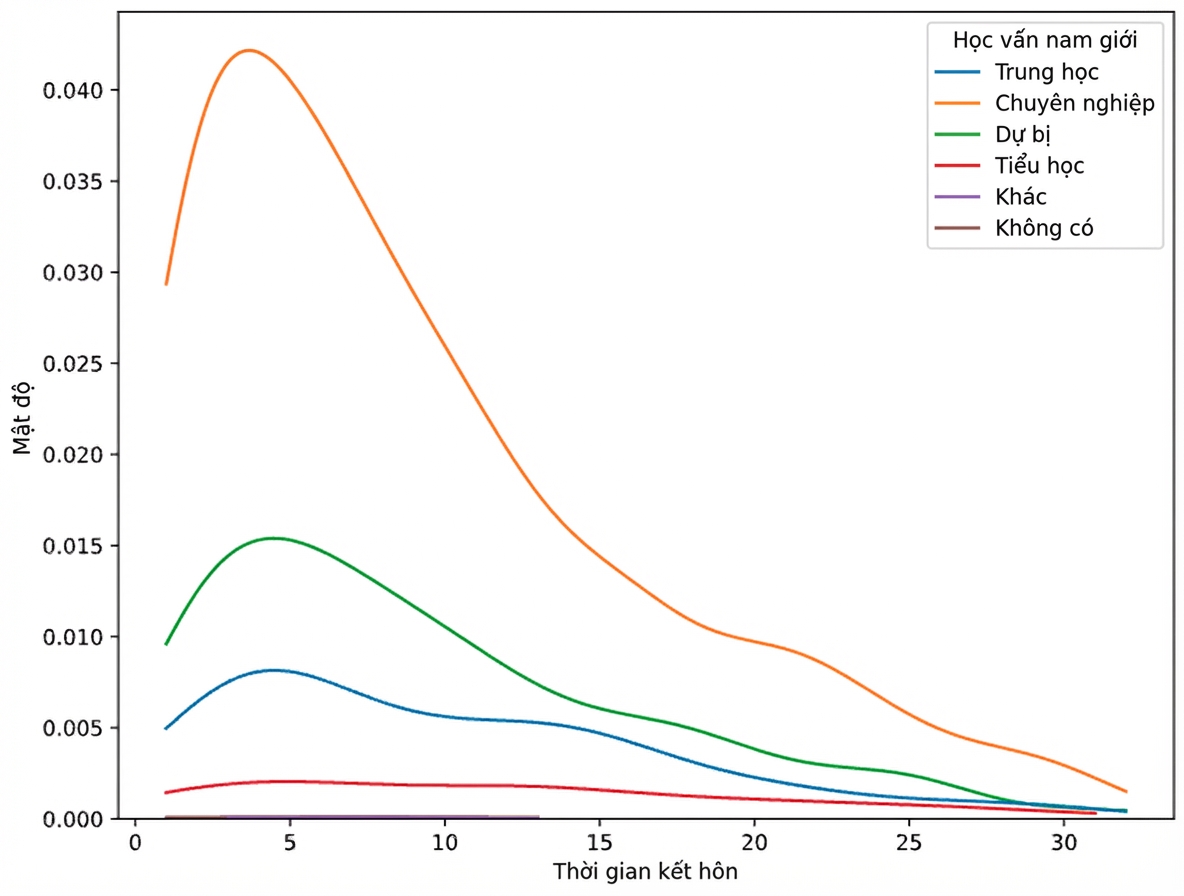
KDE thời lượng hôn nhân với hue là education_man và cut bằng 0

Phân tích dữ liệu khám phá trong Python

Bảng chéo (cross-tab)

pd.crosstab(planes["Source"], planes["Destination"],
            values=planes["Price"], aggfunc="median")
Destination  Banglore   Cochin   Delhi  Hyderabad  Kolkata  New Delhi
Source                                                               
Banglore          NaN      NaN  4823.0        NaN      NaN    10976.5
Chennai           NaN      NaN     NaN        NaN   3850.0        NaN
Delhi             NaN  10262.0     NaN        NaN      NaN        NaN
Kolkata        9345.0      NaN     NaN        NaN      NaN        NaN
Mumbai            NaN      NaN     NaN     3342.0      NaN        NaN
Phân tích dữ liệu khám phá trong Python

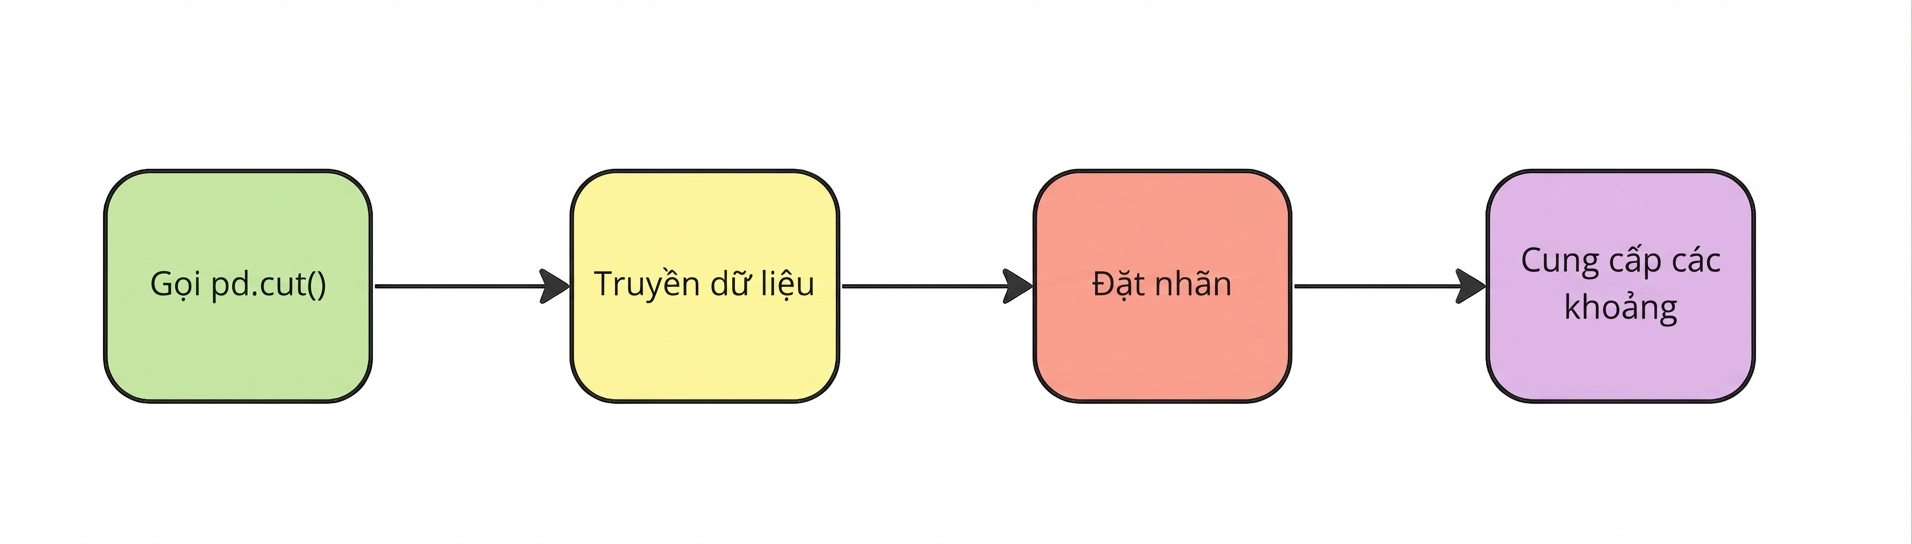
pd.cut()

Cung cấp các bin

planes["Price_Category"] = pd.cut(planes["Price"],
                                  labels=labels,
                                  bins=bins)
Phân tích dữ liệu khám phá trong Python

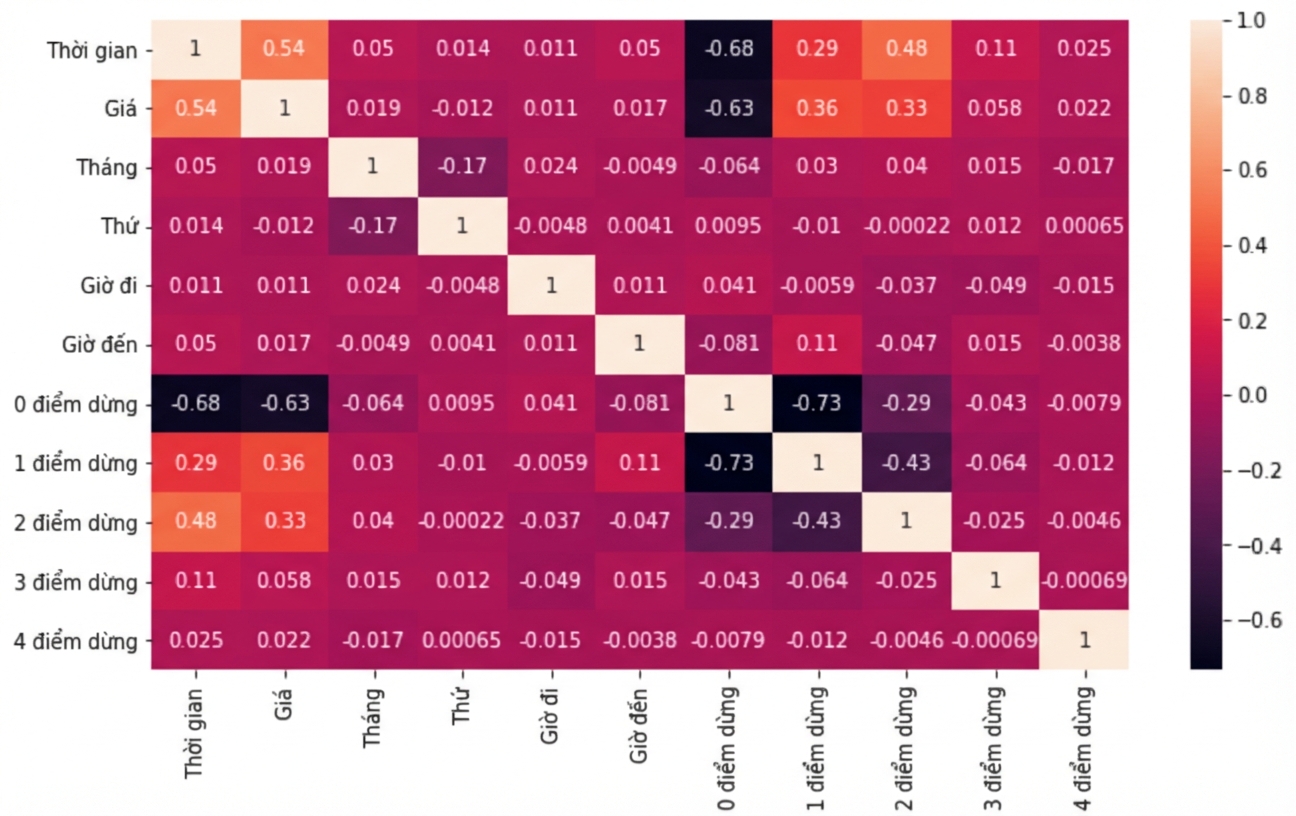
Rình mò dữ liệu (data snooping)

Heatmap với hệ số tương quan cho từng số điểm dừng

Phân tích dữ liệu khám phá trong Python

Tạo giả thuyết

sns.barplot(data=planes, x="Airline", y="Duration")
plt.show()
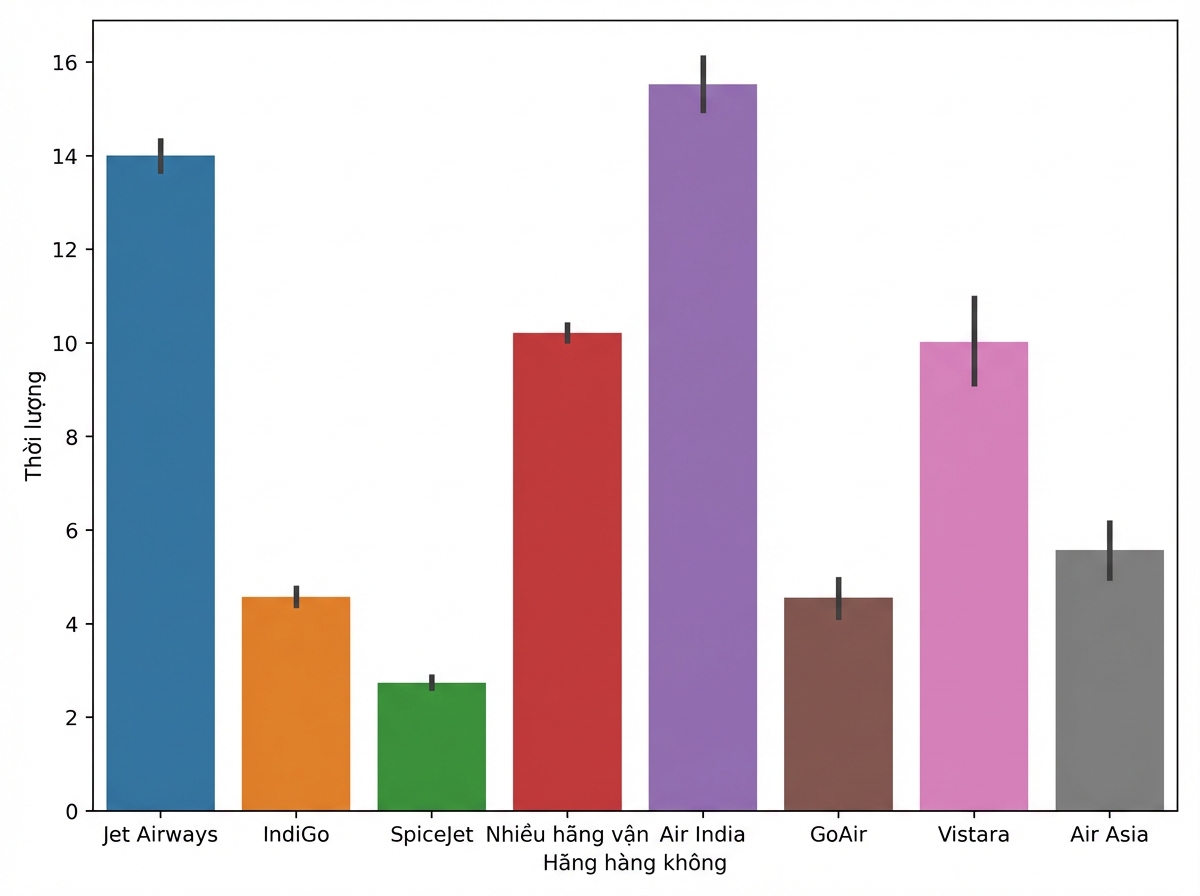
Biểu đồ cột: thời lượng so với hãng bay

Phân tích dữ liệu khám phá trong Python

Bước tiếp theo

Phân tích dữ liệu khám phá trong Python

Chúc mừng!

Phân tích dữ liệu khám phá trong Python

Preparing Video For Download...