Xử lý dữ liệu thiếu

Phân tích dữ liệu khám phá trong Python

George Boorman

Curriculum Manager, DataCamp

Vì sao dữ liệu thiếu là vấn đề?
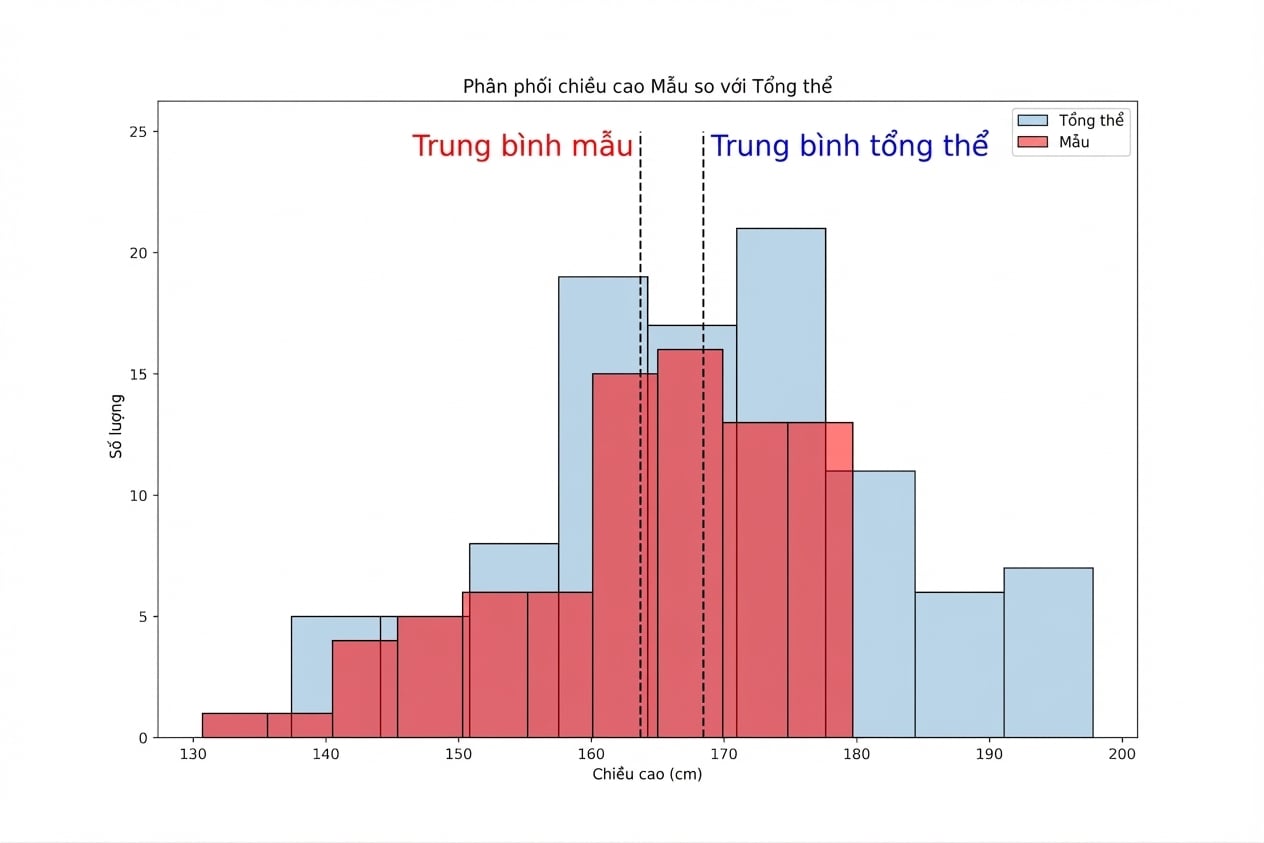
  • Ảnh hưởng phân phối
    • Thiếu chiều cao của học sinh cao hơn
  • Mẫu kém đại diện cho quần thể
    • Một số nhóm bị lệch, ví dụ thiếu dữ liệu về học sinh lớn tuổi nhất
  • Dẫn đến kết luận sai

Phân phối chiều cao: mẫu so với quần thể; mẫu có giá trị tối đa và trung bình thấp hơn

Phân tích dữ liệu khám phá trong Python

Dữ liệu việc làm của chuyên gia dữ liệu

Cột Mô tả Kiểu dữ liệu
Working_Year Năm thu thập dữ liệu Float
Designation Chức danh String
Experience Mức kinh nghiệm, ví dụ "Mid", "Senior" String
Employment_Status Loại hợp đồng, ví dụ "FT", "PT" String
Employee_Location Quốc gia làm việc String
Company_Size Nhãn quy mô công ty, ví dụ "S", "M", "L" String
Remote_Working_Ratio Tỷ lệ làm việc từ xa (%) Integer
Salary_USD Lương USD Float
Phân tích dữ liệu khám phá trong Python

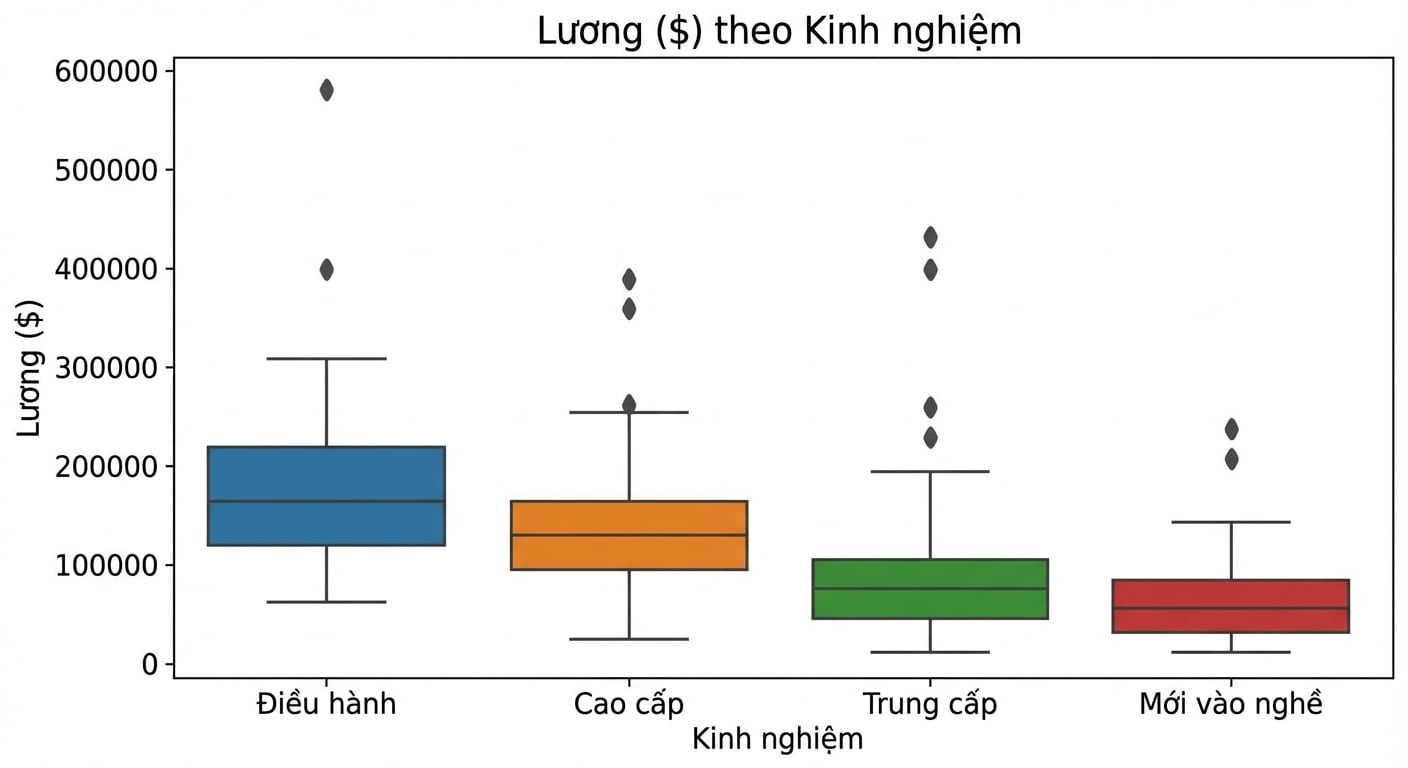
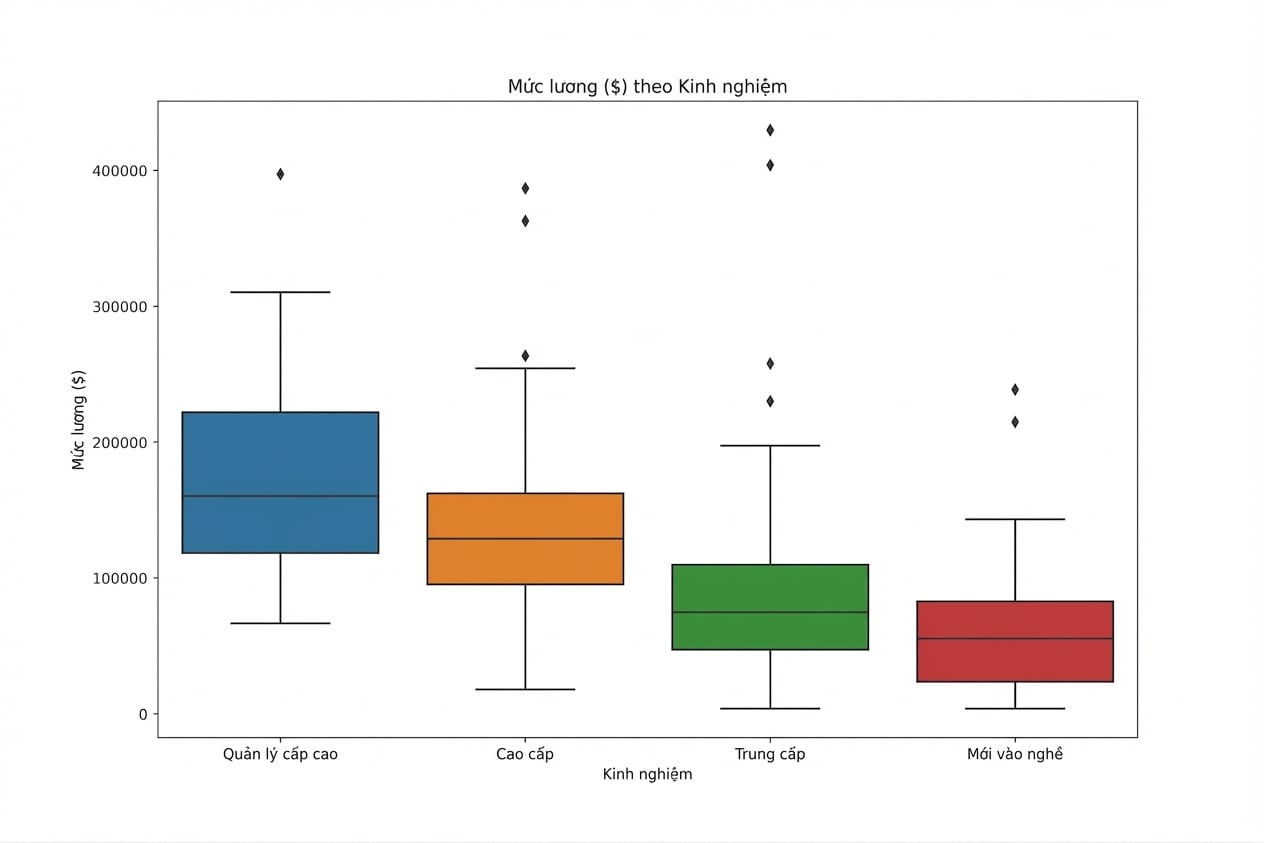
Lương theo mức kinh nghiệm

Boxplot lương theo mức kinh nghiệm trên dữ liệu sạch, trần gần 600000 đô la

Boxplot lương theo mức kinh nghiệm trên dữ liệu có thiếu, trần gần 450000 đô la

Phân tích dữ liệu khám phá trong Python

Kiểm tra dữ liệu thiếu

print(salaries.isna().sum())
Working_Year            12
Designation             27
Experience              33
Employment_Status       31
Employee_Location       28
Company_Size            40
Remote_Working_Ratio    24
Salary_USD              60
dtype: int64
Phân tích dữ liệu khám phá trong Python

Chiến lược xử lý dữ liệu thiếu

  • Loại bỏ giá trị thiếu
    • ≤ 5% tổng số giá trị
  • Bù bằng mean, median, mode
    • Phụ thuộc phân phối và ngữ cảnh
  • Bù theo nhóm con
    • Mức kinh nghiệm khác có median lương khác nhau
Phân tích dữ liệu khám phá trong Python

Loại bỏ giá trị thiếu

threshold = len(salaries) * 0.05
print(threshold)
30
Phân tích dữ liệu khám phá trong Python

Loại bỏ giá trị thiếu

cols_to_drop = salaries.columns[salaries.isna().sum() <= threshold]

print(cols_to_drop)
Index(['Working_Year', 'Designation', 'Employee_Location',
       'Remote_Working_Ratio'],
      dtype='object')
salaries.dropna(subset=cols_to_drop, inplace=True)
Phân tích dữ liệu khám phá trong Python

Bù bằng thống kê tóm tắt

cols_with_missing_values = salaries.columns[salaries.isna().sum() > 0]
print(cols_with_missing_values)
Index(['Experience', 'Employment_Status', 'Company_Size', 'Salary_USD'], 
    dtype='object')
for col in cols_with_missing_values[:-1]:
    salaries[col].fillna(salaries[col].mode()[0])
Phân tích dữ liệu khám phá trong Python

Kiểm tra giá trị thiếu còn lại

print(salaries.isna().sum())
Working_Year             0
Designation              0
Experience               0
Employment_Status        0
Employee_Location        0
Company_Size             0
Remote_Working_Ratio     0
Salary_USD              41
Phân tích dữ liệu khám phá trong Python

Bù theo nhóm con

salaries_dict = salaries.groupby("Experience")["Salary_USD"].median().to_dict()

print(salaries_dict)
{'Entry': 55380.0, 'Executive': 135439.0, 'Mid': 74173.5, 'Senior': 128903.0}
Phân tích dữ liệu khám phá trong Python

Bù theo nhóm con

salaries["Salary_USD"] = salaries["Salary_USD"].fillna(salaries["Experience"].map(salaries_dict))
Phân tích dữ liệu khám phá trong Python

Không còn giá trị thiếu!

print(salaries.isna().sum())
Working_Year            0
Designation             0
Experience              0
Employment_Status       0
Employee_Location       0
Company_Size            0
Remote_Working_Ratio    0
Salary_USD              0
dtype: int64
Phân tích dữ liệu khám phá trong Python

Ayo berlatih!

Phân tích dữ liệu khám phá trong Python

Preparing Video For Download...