Biểu đồ đường

Nhập môn trực quan hóa dữ liệu với ggplot2

Rick Scavetta

Founder, Scavetta Academy

Các loại biểu đồ phổ biến

Loại biểu đồ Geom khả dụng
Scatter plot points, jitter, abline, smooth, count
Bar plot histogram, bar, col, errorbar
Line plot line, path
Nhập môn trực quan hóa dữ liệu với ggplot2

Beaver

str(beaver)
'data.frame':    101 obs. of  3 variables:
 $ time  : POSIXct, format: "2000-01-01 09:30:00" "2000-01-01 09:40:00" "2000-01-01 09:50:00" ...
 $ temp  : num  36.6 36.7 36.9 37.1 37.2 ...
 $ active: Factor w/ 2 levels "0","1": 1 1 1 1 1 1 1 1 1 1 ...
Nhập môn trực quan hóa dữ liệu với ggplot2

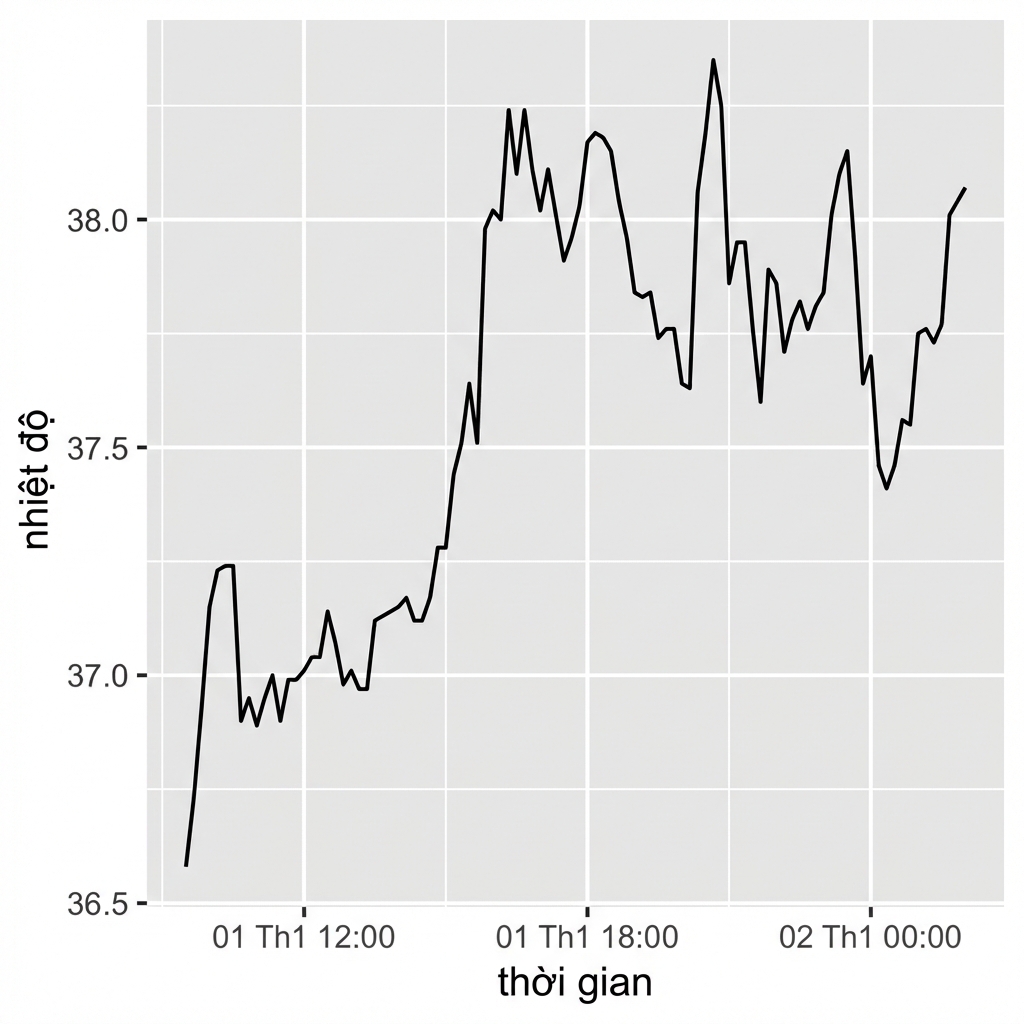
Beaver

ggplot(beaver, aes(x = time, y = temp)) +
  geom_line()

Nhập môn trực quan hóa dữ liệu với ggplot2

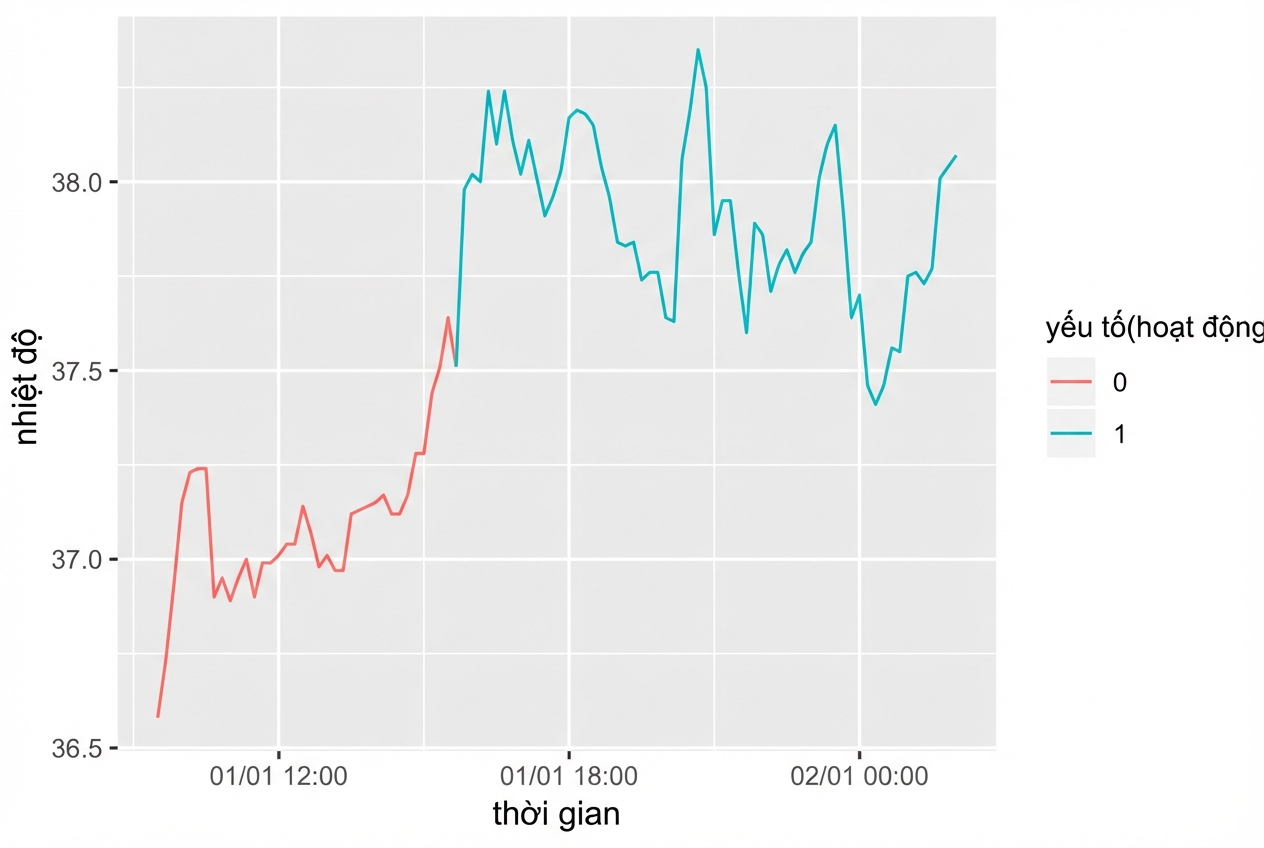
Beaver

ggplot(beaver, aes(x = time, y = temp, 
                   color = factor(active))
                   ) +
  geom_line()

Nhập môn trực quan hóa dữ liệu với ggplot2

Bộ dữ liệu sản lượng cá

str(fish)
'data.frame':    427 obs. of  3 variables:
 $ Species: Factor w/ 7 levels "Pink","Chum",..: 1 2 3 4 5 6 7 1 2 3 ...
 $ Year   : int  1950 1950 1950 1950 1950 1950 1950 1951 1951 1951 ...
 $ Capture: int  100600 139300 64100 30500 0 23200 10800 259000 155900 51200 ...
Nhập môn trực quan hóa dữ liệu với ggplot2

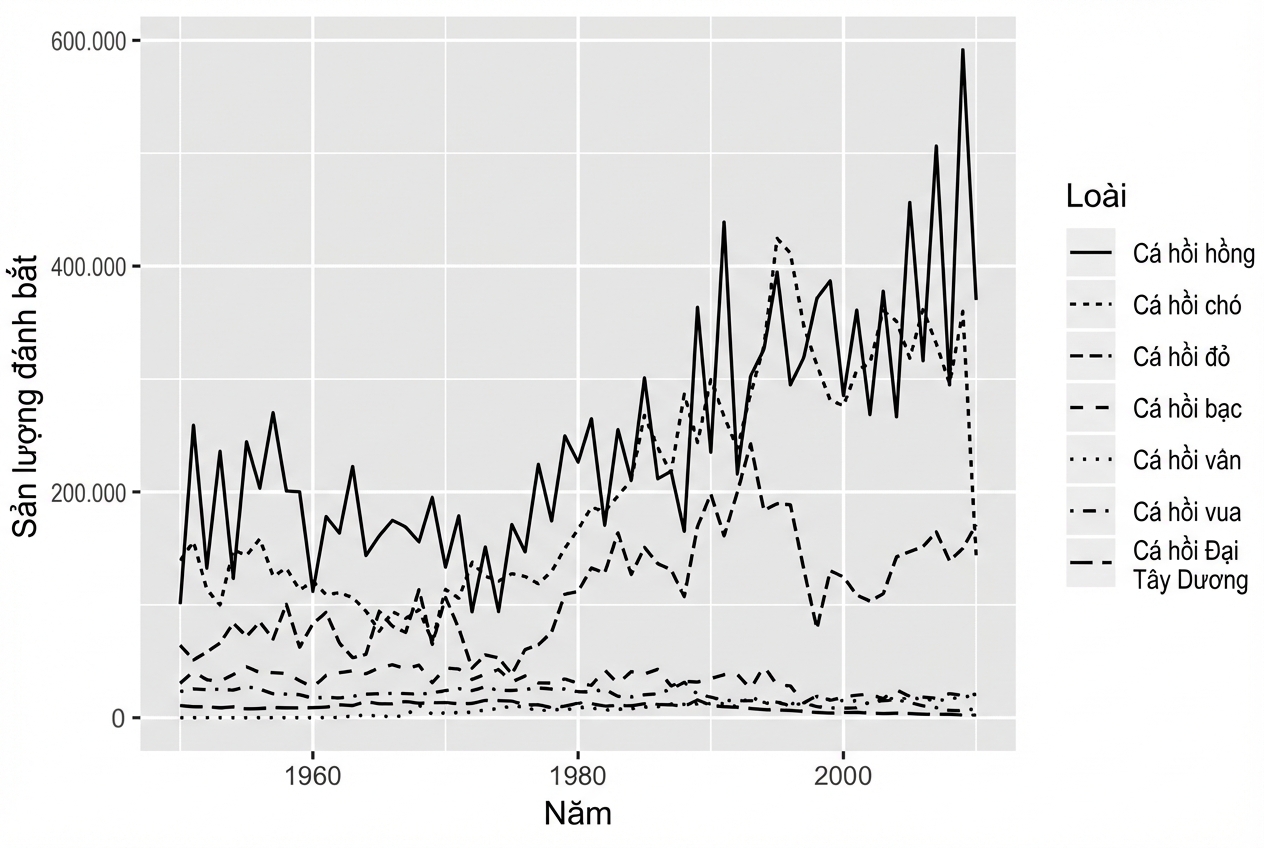
Thuộc tính kiểu nét (linetype)

ggplot(fish, aes(x = Year, 
                 y = Capture, 
                 linetype = Species)) + 
  geom_line()

Nhập môn trực quan hóa dữ liệu với ggplot2

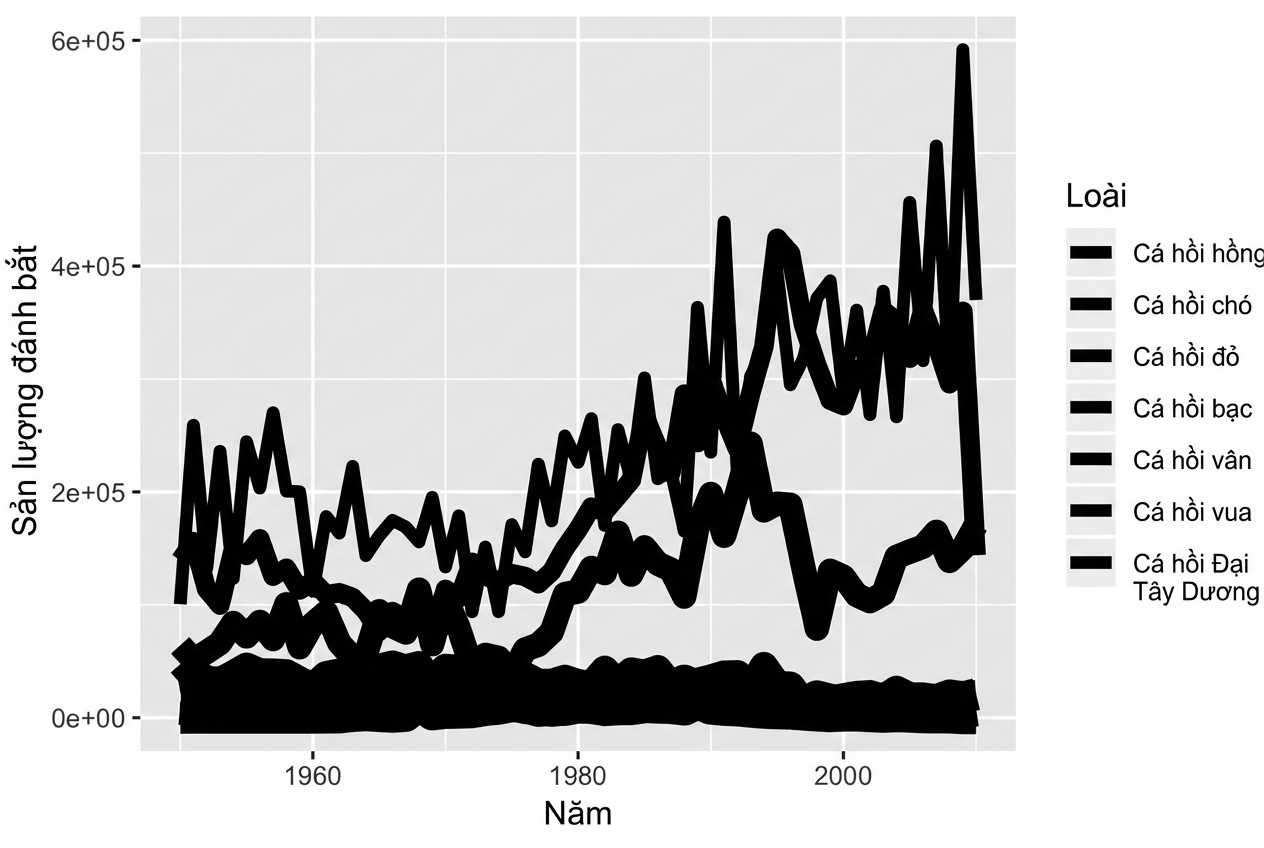
Thuộc tính kích thước (size)

ggplot(fish, aes(x = Year, 
                 y = Capture, 
                 size = Species)) + 
  geom_line()

Nhập môn trực quan hóa dữ liệu với ggplot2

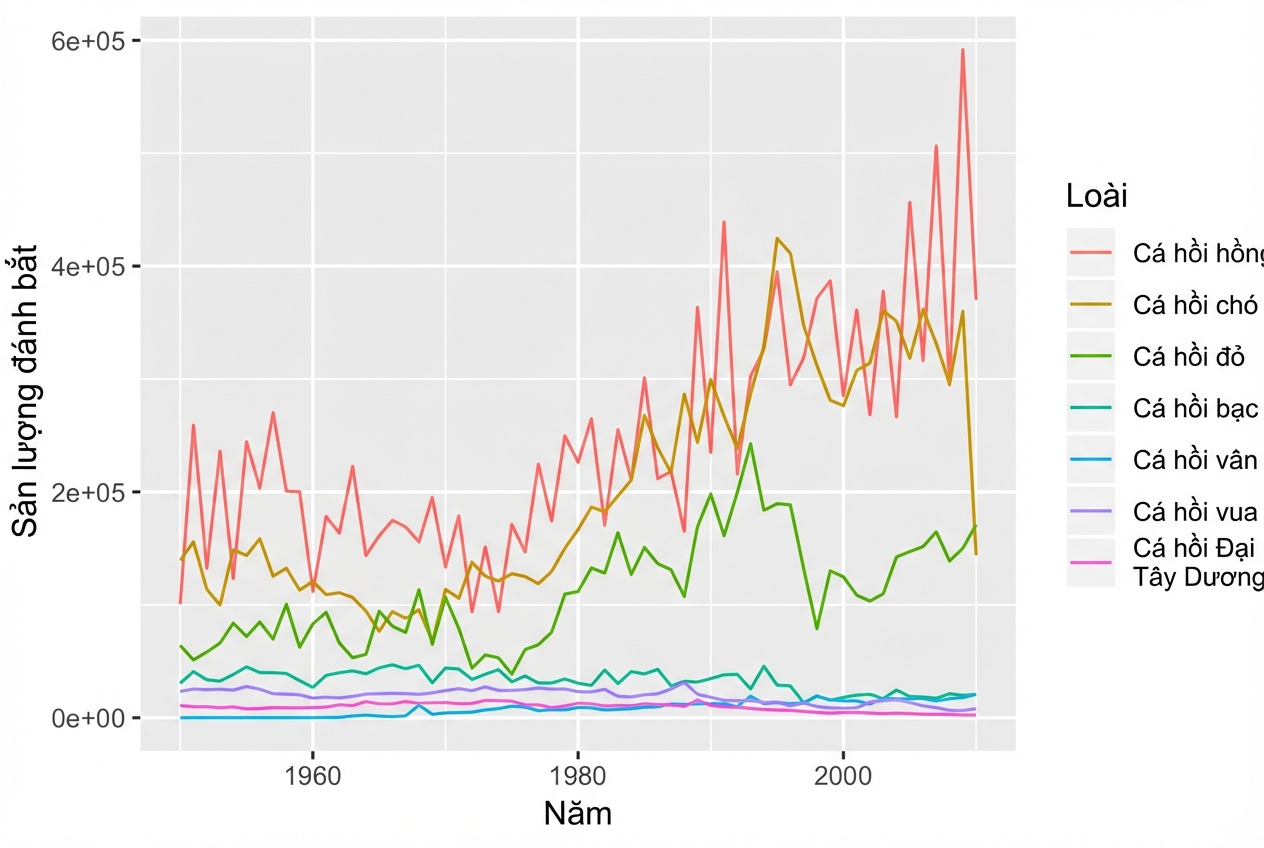
Thuộc tính màu (color)

ggplot(fish, aes(x = Year, 
                 y = Capture, 
                 color = Species)) + 
  geom_line()

Nhập môn trực quan hóa dữ liệu với ggplot2

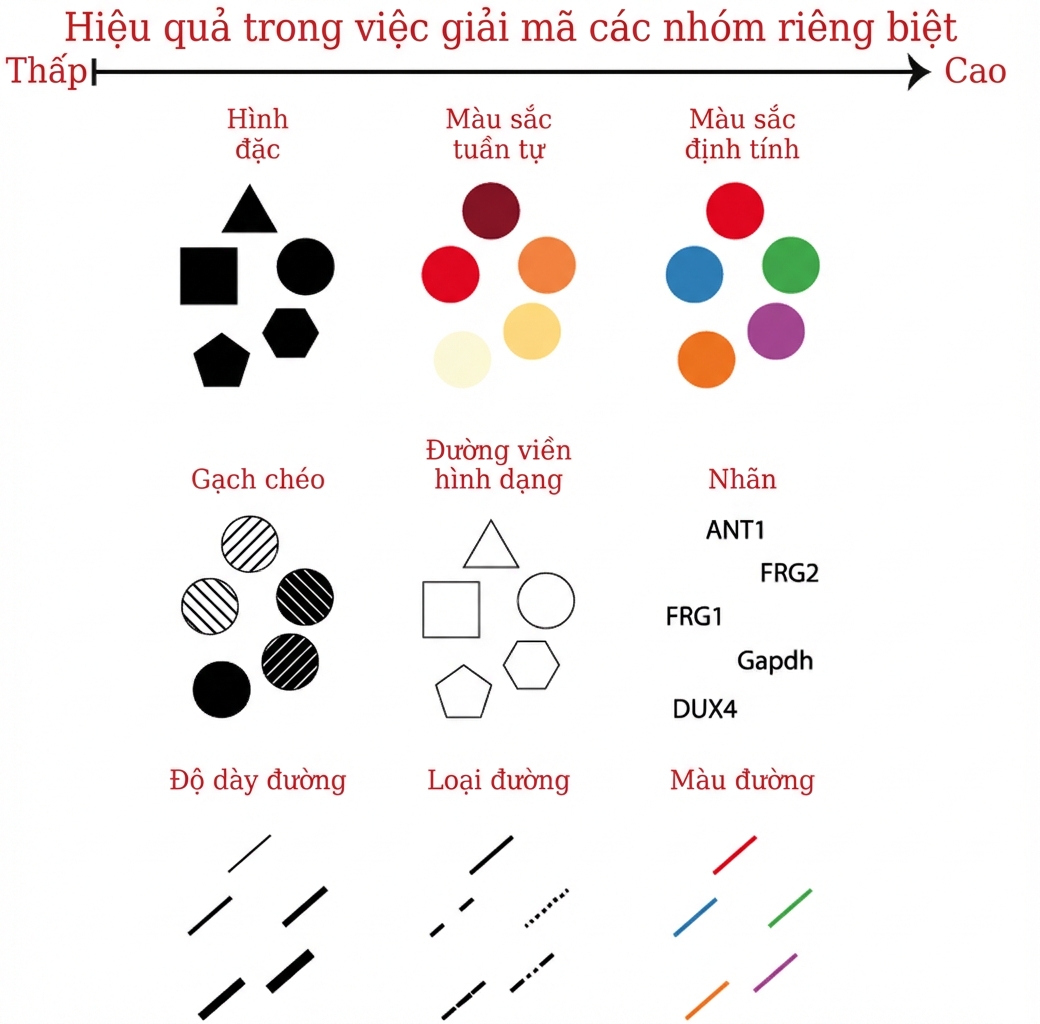
Aesthetics cho biến phân loại

Nhập môn trực quan hóa dữ liệu với ggplot2

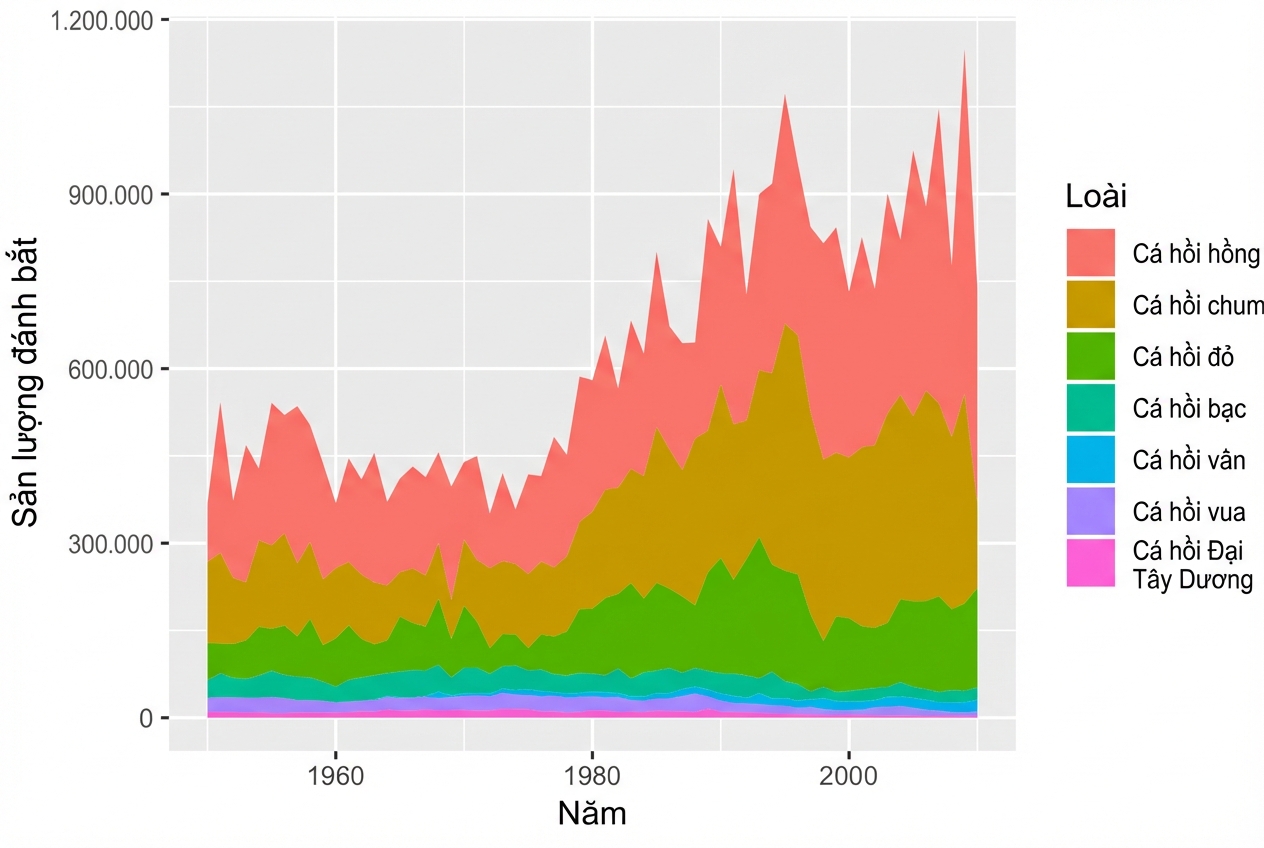
Thuộc tính tô màu với geom_area()

ggplot(fish, aes(x = Year, 
                 y = Capture, 
                 fill = Species)) + 
  geom_area()

Nhập môn trực quan hóa dữ liệu với ggplot2

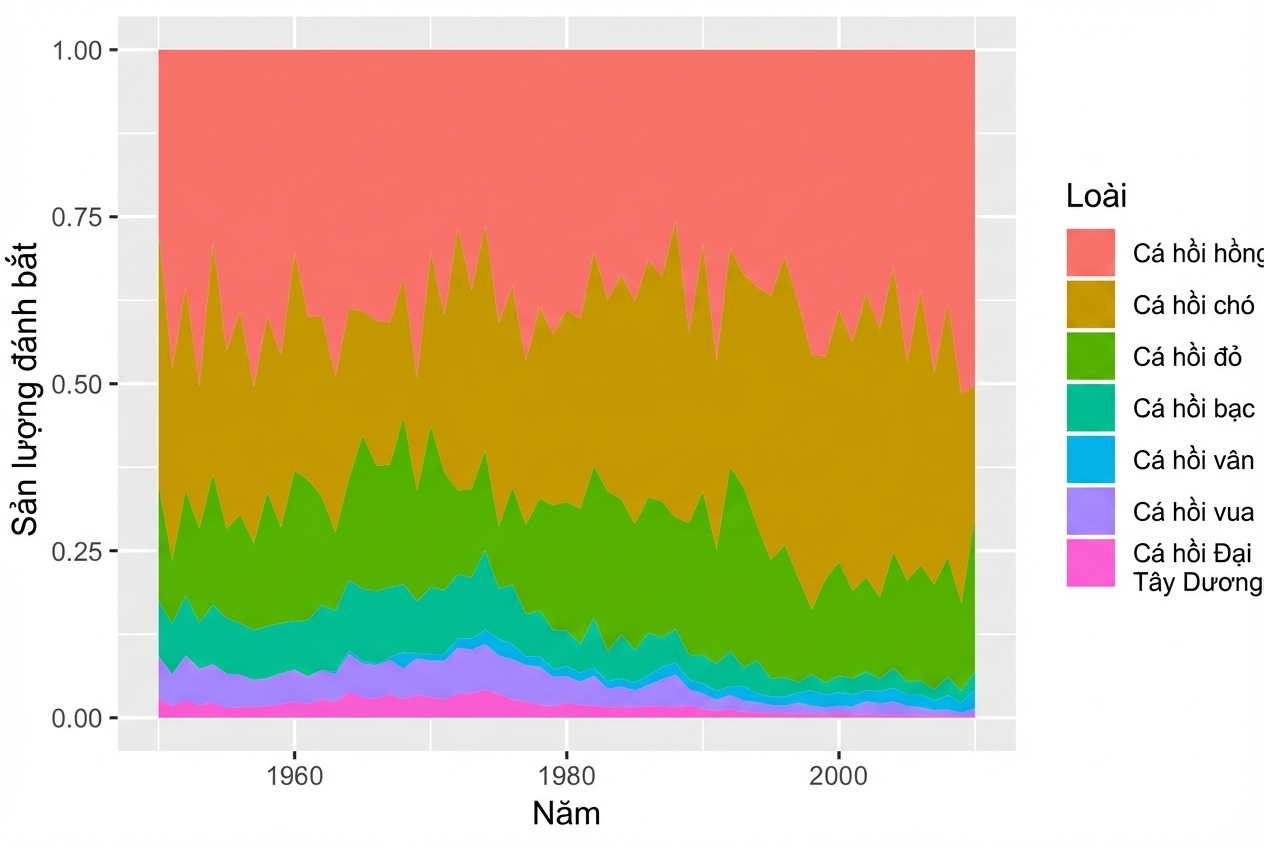
Dùng position = "fill"

ggplot(fish, aes(x = Year, 
                 y = Capture, 
                 fill = Species)) + 
  geom_area(position = "fill")

Nhập môn trực quan hóa dữ liệu với ggplot2

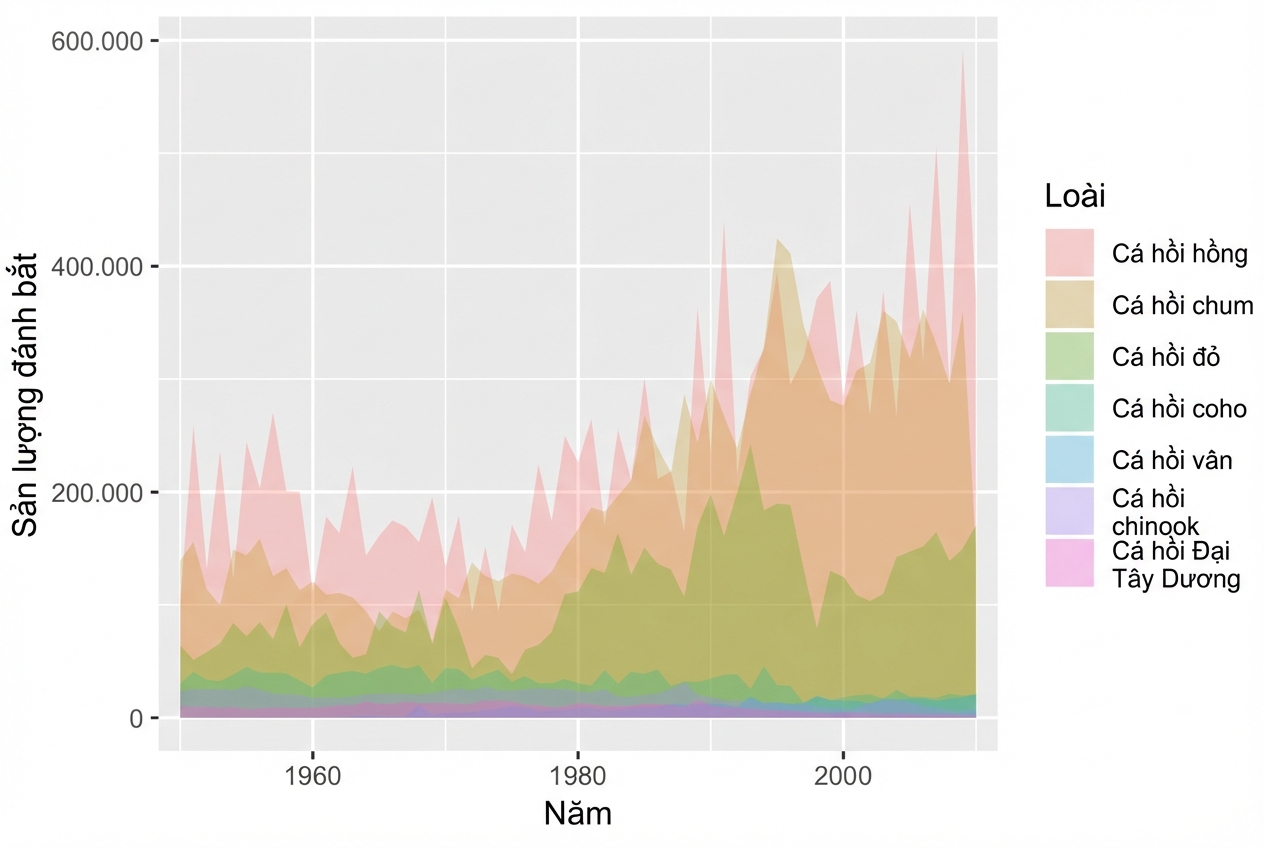
geom_ribbon()

ggplot(fish, aes(x = Year, 
                 y = Capture, 
                 fill = Species)) + 
  geom_ribbon(aes(ymax = Capture, 
                  ymin = 0), 
              alpha = 0.3)

Nhập môn trực quan hóa dữ liệu với ggplot2

Vamos praticar!

Nhập môn trực quan hóa dữ liệu với ggplot2

Preparing Video For Download...