So sánh định lượng: biểu đồ tần suất
Nhập môn trực quan hóa dữ liệu với Matplotlib

Ariel Rokem
Data Scientist
Histogram
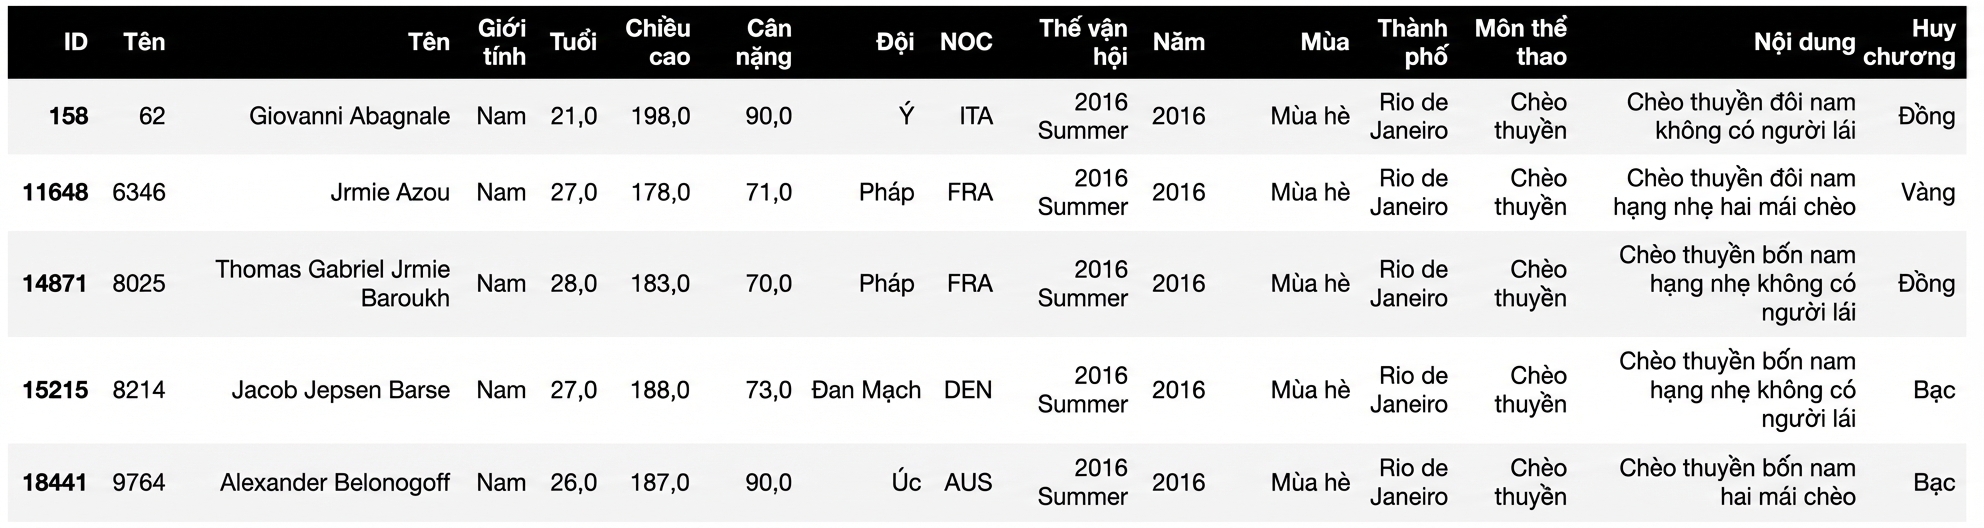
Lại là biểu đồ cột
fig, ax = plt.subplots()ax.bar("Rowing", mens_rowing["Height"].mean())ax.bar("Gymnastics", mens_gymnastics["Height"].mean())ax.set_ylabel("Height (cm)") plt.show()

Giới thiệu histogram
fig, ax = plt.subplots()ax.hist(mens_rowing["Height"])ax.hist(mens_gymnastics["Height"])ax.set_xlabel("Height (cm)") ax.set_ylabel("# of observations") plt.show()
Cần có nhãn
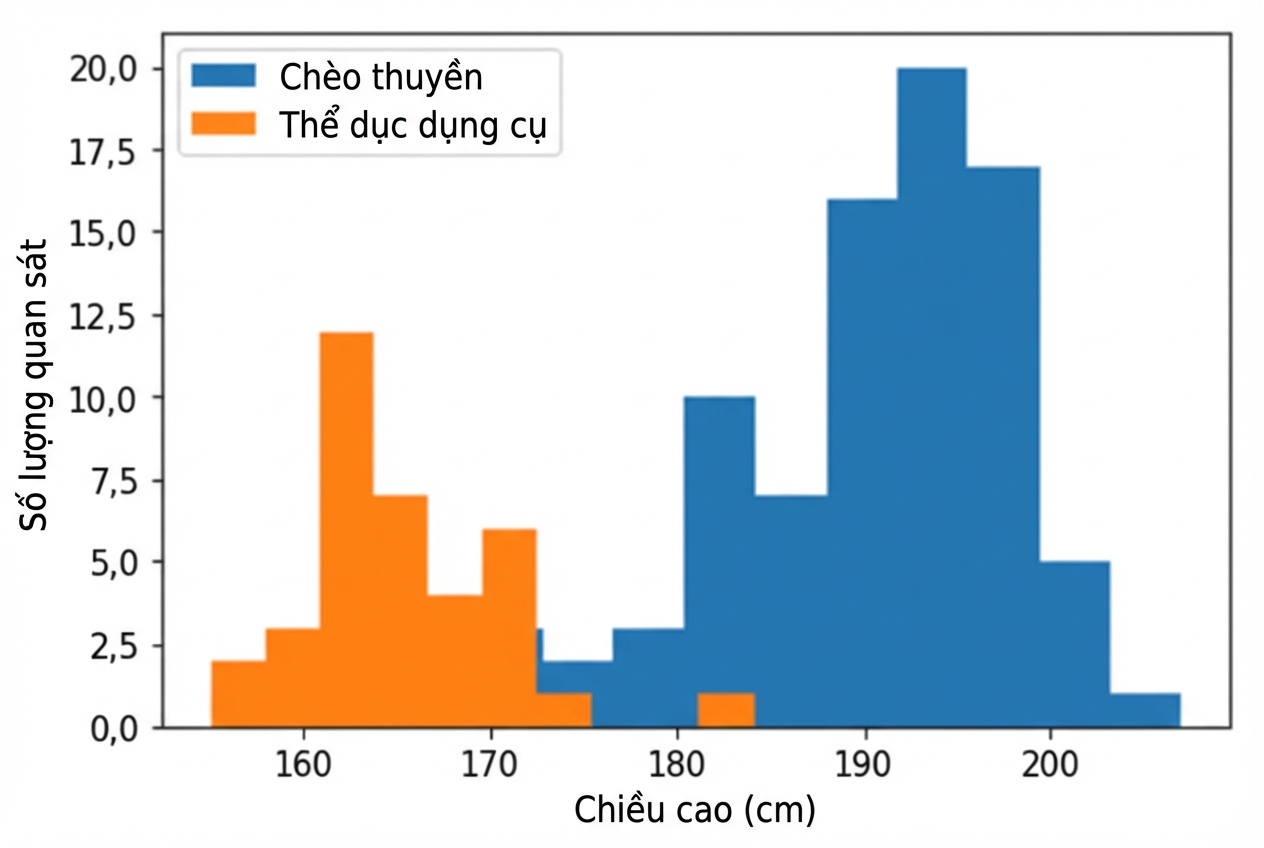
ax.hist(mens_rowing["Height"], label="Rowing") ax.hist(mens_gymnastics["Height"], label="Gymnastics") ax.set_xlabel("Height (cm)") ax.set_ylabel("# of observations")ax.legend() plt.show()
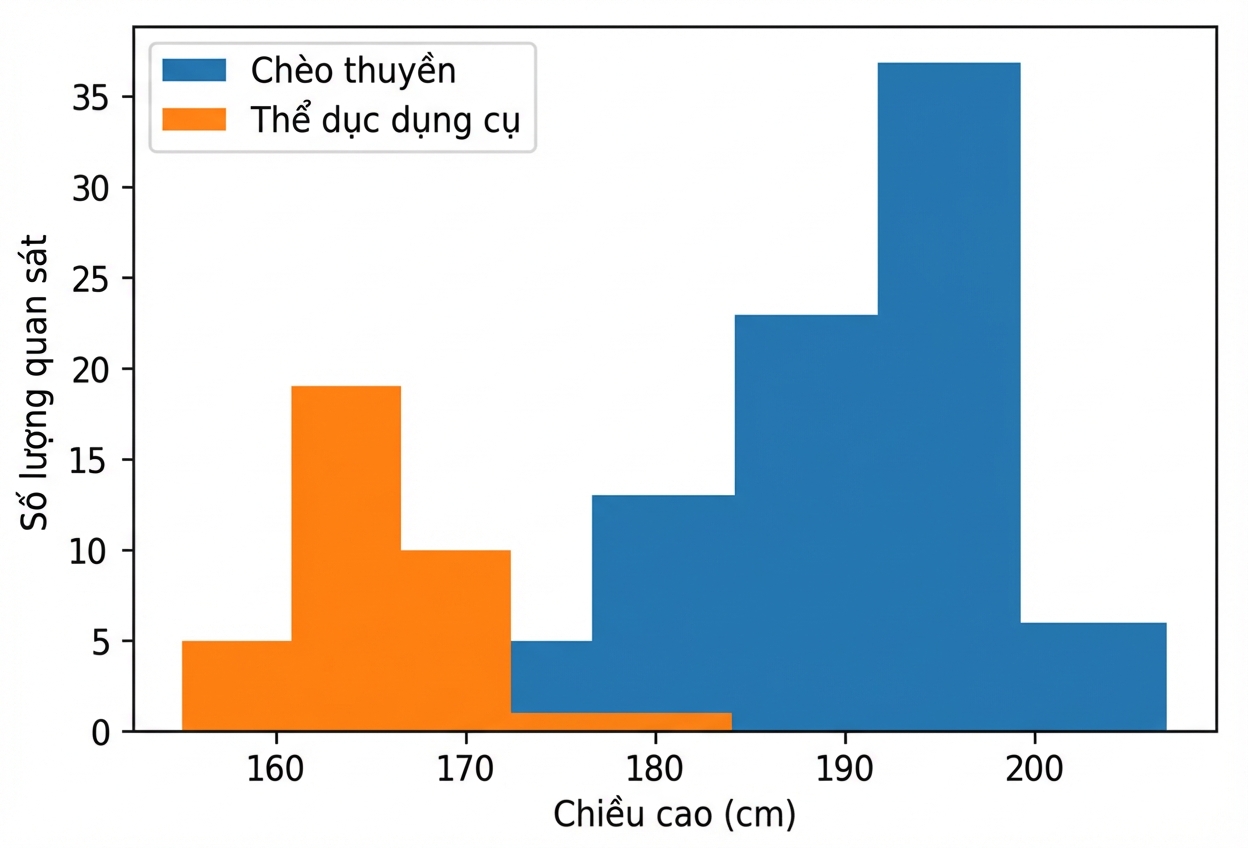
Tùy chỉnh histogram: đặt số lượng bin
ax.hist(mens_rowing["Height"], label="Rowing", bins=5)
ax.hist(mens_gymnastics["Height"], label="Gymnastics", bins=5)
ax.set_xlabel("Height (cm)")
ax.set_ylabel("# of observations")
ax.legend()
plt.show()
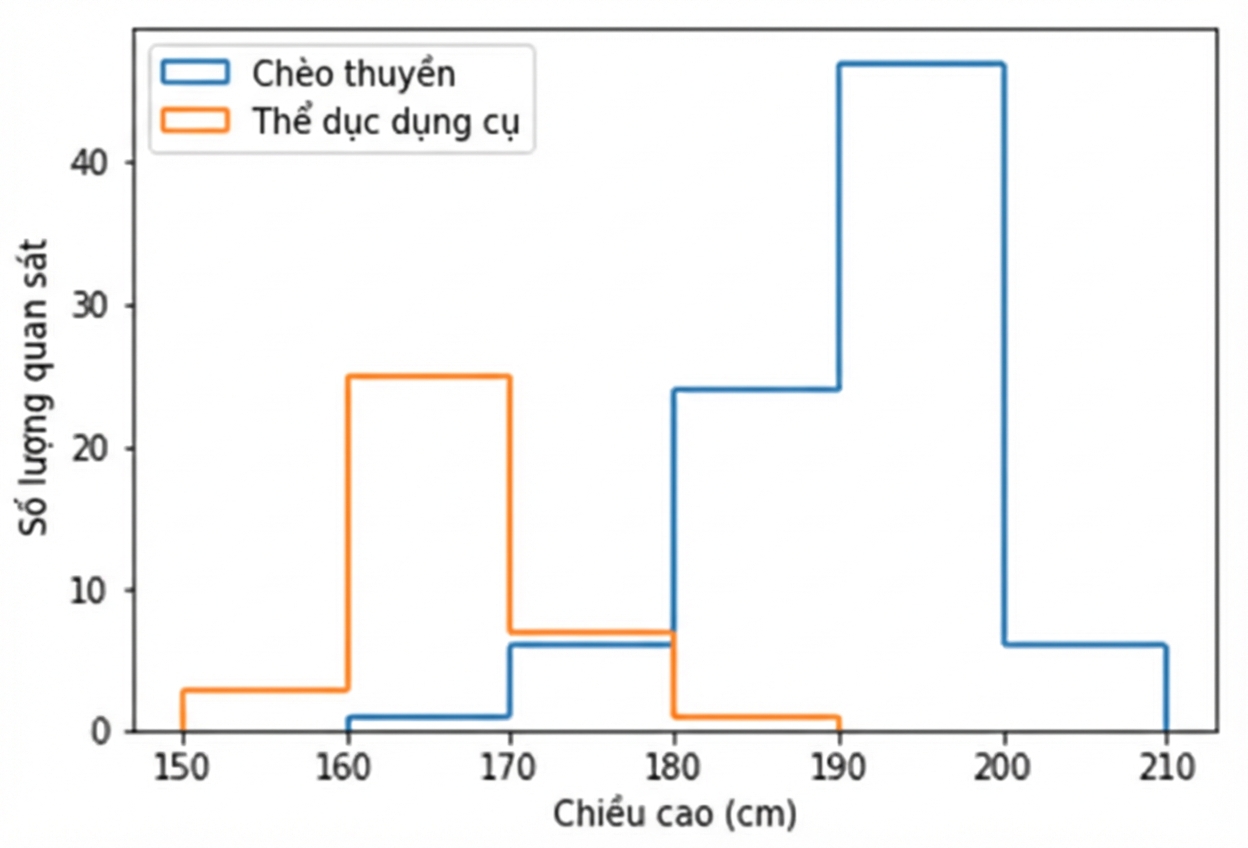
Tùy chỉnh histogram: đặt ranh giới bin
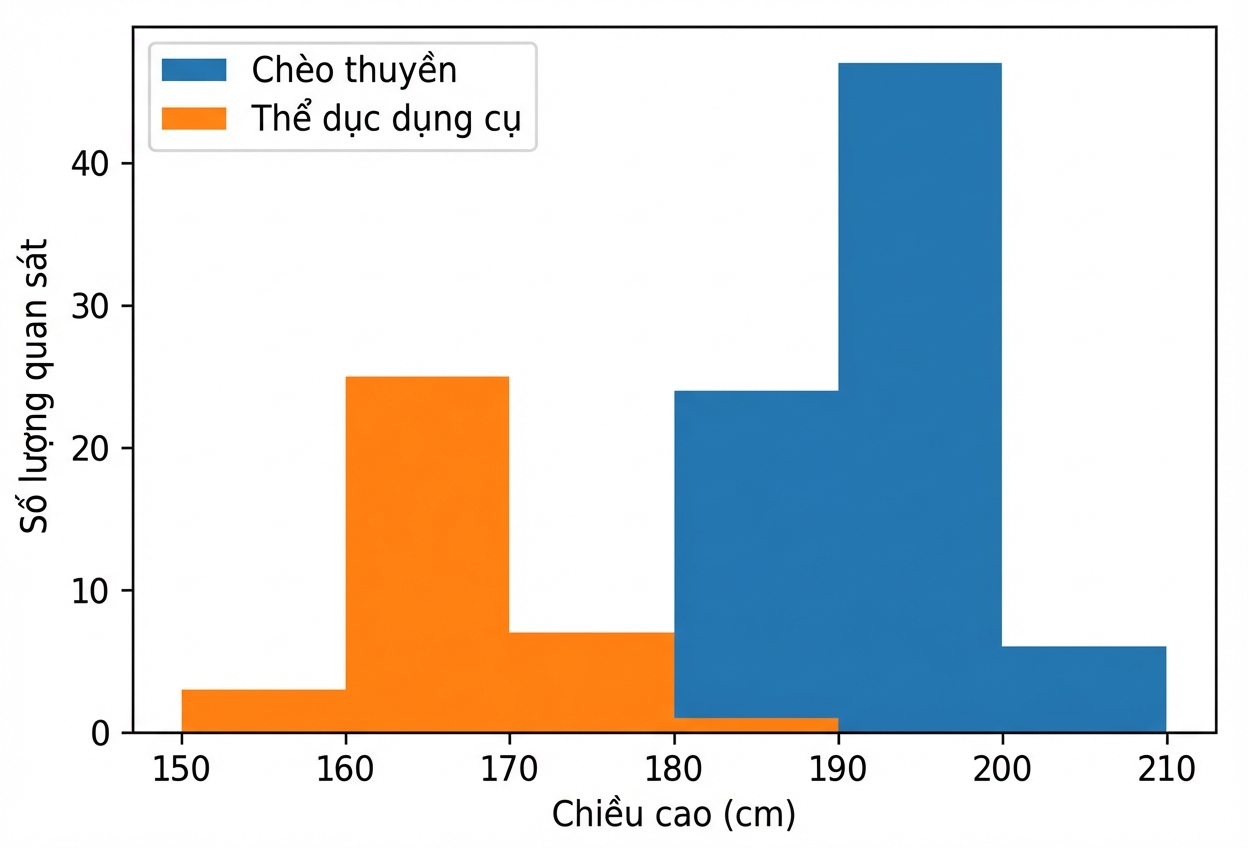
ax.hist(mens_rowing["Height"], label="Rowing",
        bins=[150, 160, 170, 180, 190, 200, 210])

ax.hist(mens_gymnastics["Height"], label="Gymnastics",
        bins=[150, 160, 170, 180, 190, 200, 210])

ax.set_xlabel("Height (cm)")
ax.set_ylabel("# of observations")
ax.legend()
plt.show()
Histogram với histtype là step