Chia sẻ trực quan hóa của bạn với người khác

Nhập môn trực quan hóa dữ liệu với Matplotlib

Ariel Rokem

Data Scientist

Hình để chia sẻ

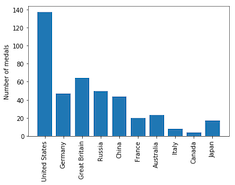
fig, ax = plt.subplots()

ax.bar(medals.index, medals["Gold"])
ax.set_xticklabels(medals.index, rotation=90)
ax.set_ylabel("Số huy chương")

plt.show()
Nhập môn trực quan hóa dữ liệu với Matplotlib

Lưu hình ra tệp

fig, ax = plt.subplots()

ax.bar(medals.index, medals["Gold"])
ax.set_xticklabels(medals.index, rotation=90)
ax.set_ylabel("Số huy chương")

fig.savefig("gold_medals.png")
ls
gold_medals.png
Nhập môn trực quan hóa dữ liệu với Matplotlib

Định dạng tệp khác nhau

fig.savefig("gold_medals.jpg")
fig.savefig("gold_medals.jpg", quality=50)
fig.savefig("gold_medals.svg")
Nhập môn trực quan hóa dữ liệu với Matplotlib

Độ phân giải

fig.savefig("gold_medals.png", dpi=300)
Nhập môn trực quan hóa dữ liệu với Matplotlib

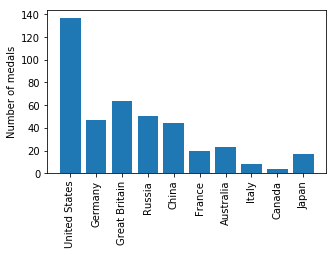
Kích thước

fig.set_size_inches([5, 3])
Nhập môn trực quan hóa dữ liệu với Matplotlib

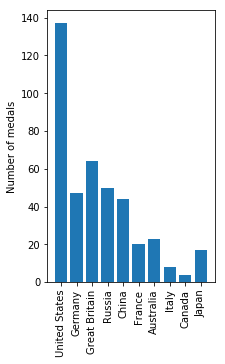
Tỷ lệ khung khác

fig.set_size_inches([3, 5])
Nhập môn trực quan hóa dữ liệu với Matplotlib

Luyện lưu trực quan hóa!

Nhập môn trực quan hóa dữ liệu với Matplotlib

Preparing Video For Download...