Biểu đồ nhỏ (small multiples)

Nhập môn trực quan hóa dữ liệu với Matplotlib

Ariel Rokem

Data Scientist

Thêm dữ liệu

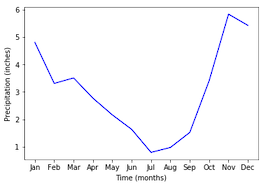
ax.plot(seattle_weather["MONTH"], 
        seattle_weather["MLY-PRCP-NORMAL"], 
        color='b')
ax.set_xlabel("Thời gian (tháng)")
ax.set_ylabel("Lượng mưa (inch)")
plt.show()
Nhập môn trực quan hóa dữ liệu với Matplotlib

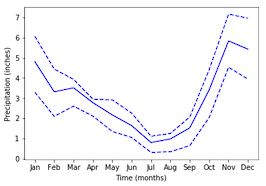
Thêm dữ liệu nữa

ax.plot(seattle_weather["MONTH"], seattle_weather["MLY-PRCP-25PCTL"], 
        linestyle='--', color='b')
ax.plot(seattle_weather["MONTH"], seattle_weather["MLY-PRCP-75PCTL"], 
        linestyle='--', color=color)
plt.show()
Nhập môn trực quan hóa dữ liệu với Matplotlib

Và thêm dữ liệu

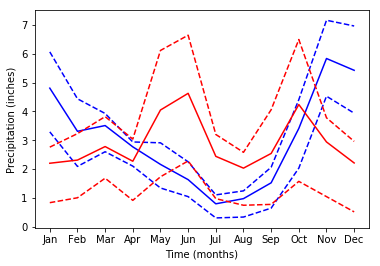
ax.plot(austin_weather["MONTH"], austin_weather["MLY-PRCP-NORMAL"],
        color='r')
ax.plot(austin_weather["MONTH"], austin_weather["MLY-PRCP-25PCTL"], 
        linestyle='--', color='r')
ax.plot(austin_weather["MONTH"], austin_weather["MLY-PRCP-75PCTL"], 
        linestyle='--', color='r')
plt.show()
Nhập môn trực quan hóa dữ liệu với Matplotlib

Quá nhiều dữ liệu!

Nhập môn trực quan hóa dữ liệu với Matplotlib

Small multiples với plt.subplots

fig, ax = plt.subplots()
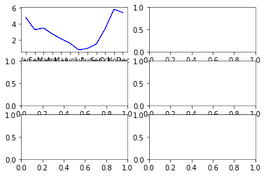
fig, ax = plt.subplots(3, 2)

plt.show()

Nhập môn trực quan hóa dữ liệu với Matplotlib

Thêm dữ liệu vào các subplot

ax.shape
(3, 2)
ax[0, 0].plot(seattle_weather["MONTH"], 
              seattle_weather["MLY-PRCP-NORMAL"], 
              color='b')

plt.show()

Nhập môn trực quan hóa dữ liệu với Matplotlib

Subplot với dữ liệu

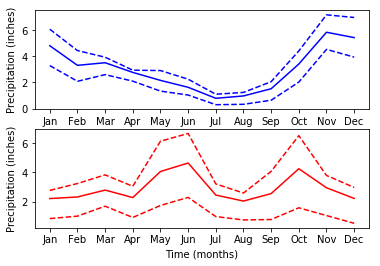
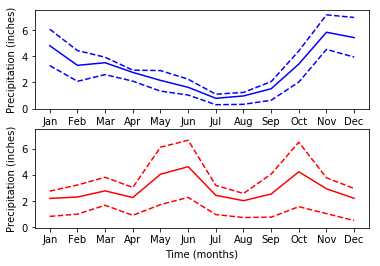
fig, ax = plt.subplots(2, 1)

ax[0].plot(seattle_weather["MONTH"], seattle_weather["MLY-PRCP-NORMAL"], color='b') ax[0].plot(seattle_weather["MONTH"], seattle_weather["MLY-PRCP-25PCTL"], linestyle='--', color='b') ax[0].plot(seattle_weather["MONTH"], seattle_weather["MLY-PRCP-75PCTL"], linestyle='--', color='b')
ax[1].plot(austin_weather["MONTH"], austin_weather["MLY-PRCP-NORMAL"], color='r') ax[1].plot(austin_weather["MONTH"], austin_weather["MLY-PRCP-25PCTL"], linestyle='--', color='r') ax[1].plot(austin_weather["MONTH"], austin_weather["MLY-PRCP-75PCTL"], linestyle='--', color='r')
ax[0].set_ylabel("Lượng mưa (inch)") ax[1].set_ylabel("Lượng mưa (inch)")
ax[1].set_xlabel("Thời gian (tháng)")
plt.show()
Nhập môn trực quan hóa dữ liệu với Matplotlib

Subplot với dữ liệu

Nhập môn trực quan hóa dữ liệu với Matplotlib

Chia sẻ thang y (sharey)

fig, ax = plt.subplots(2, 1, sharey=True)
Nhập môn trực quan hóa dữ liệu với Matplotlib

Luyện tập tạo subplot!

Nhập môn trực quan hóa dữ liệu với Matplotlib

Preparing Video For Download...