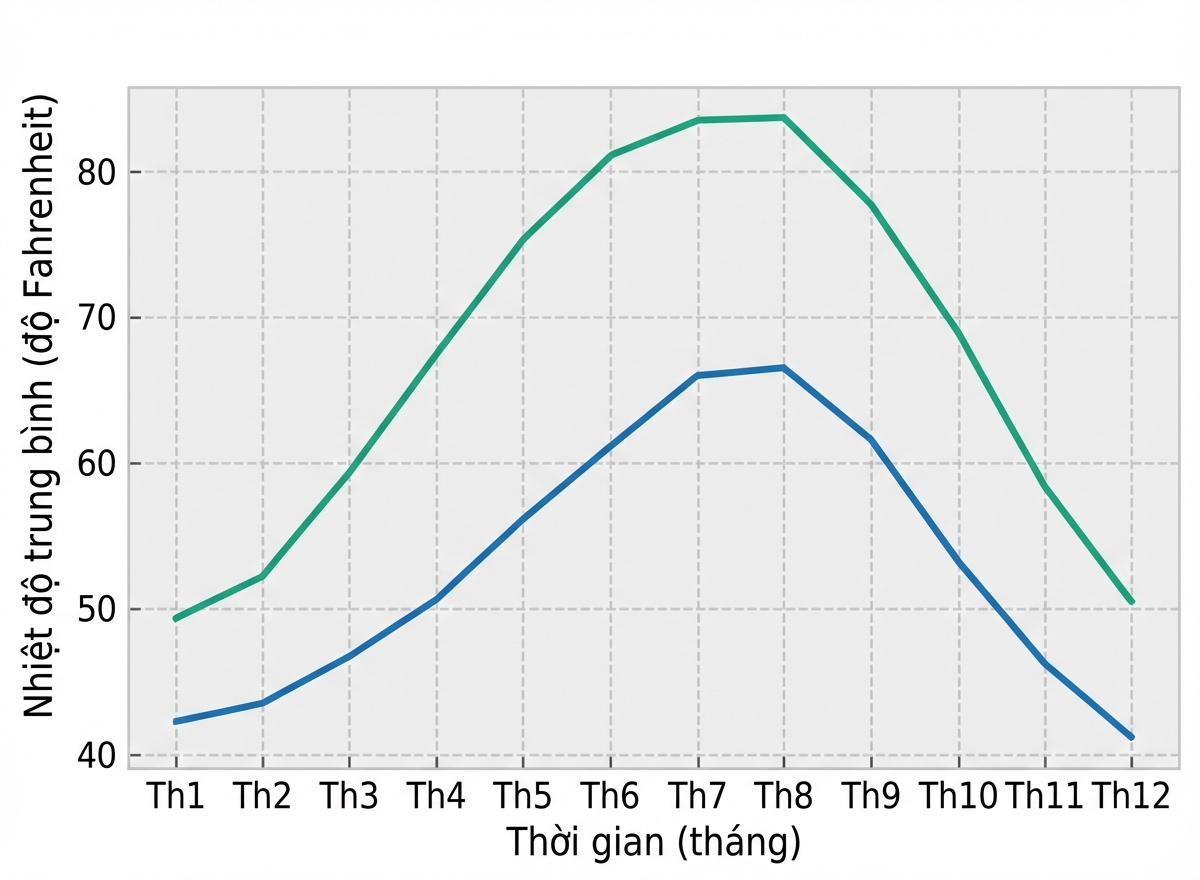
Chuẩn bị biểu đồ để chia sẻ
Nhập môn trực quan hóa dữ liệu với Matplotlib

Ariel Rokem
Data Scientist
Thay đổi kiểu biểu đồ
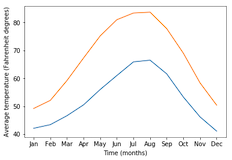
import matplotlib.pyplot as plt
fig, ax = plt.subplots()
ax.plot(seattle_weather["MONTH"], seattle_weather["MLY-TAVG-NORMAL"])
ax.plot(austin_weather["MONTH"], austin_weather["MLY-TAVG-NORMAL"])
ax.set_xlabel("Time (months)")
ax.set_ylabel("Average temperature (Fahrenheit degrees)")
plt.show()
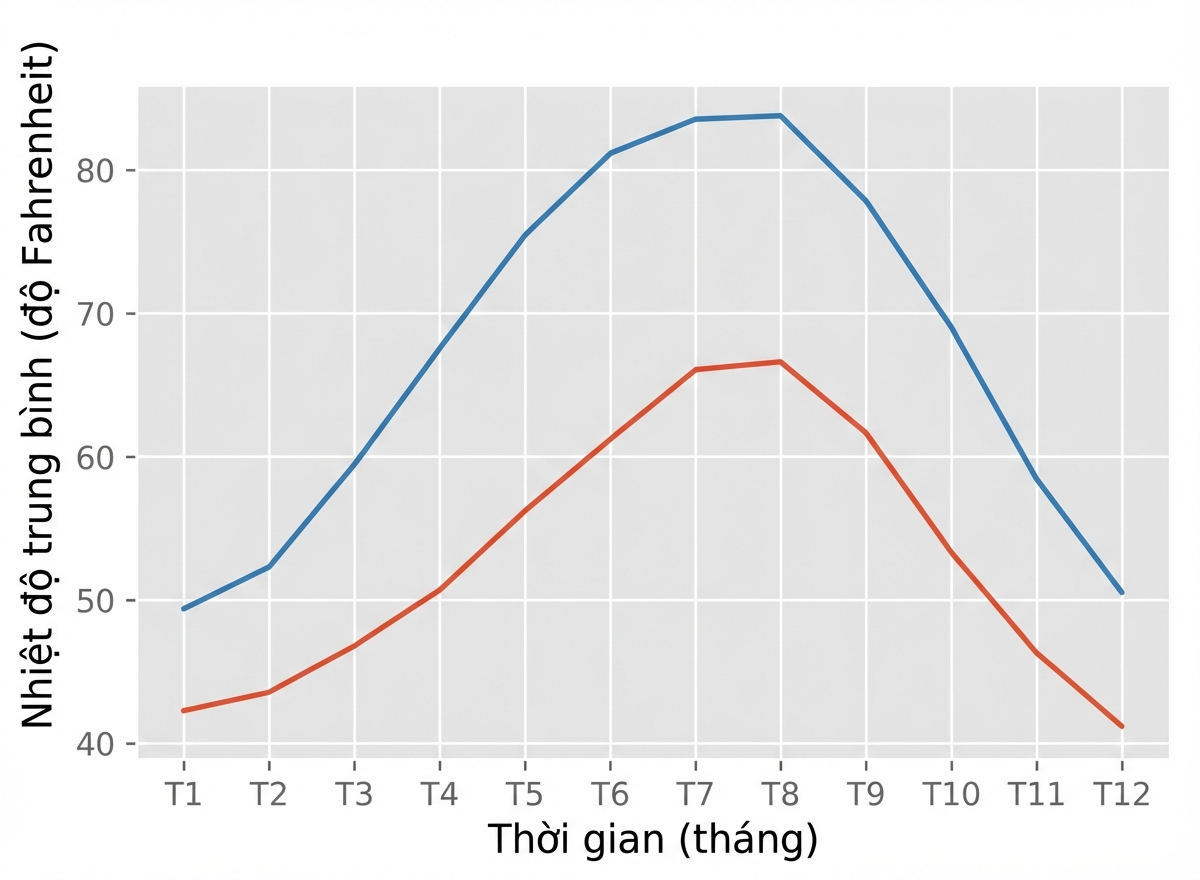
Chọn một kiểu
plt.style.use("ggplot")fig, ax = plt.subplots() ax.plot(seattle_weather["MONTH"], seattle_weather["MLY-TAVG-NORMAL"]) ax.plot(austin_weather["MONTH"], austin_weather["MLY-TAVG-NORMAL"]) ax.set_xlabel("Time (months)") ax.set_ylabel("Average temperature (Fahrenheit degrees)") plt.show()
Kiểu "bmh"
plt.style.use("bmh")fig, ax = plt.subplots() ax.plot(seattle_weather["MONTH"], seattle_weather["MLY-TAVG-NORMAL"]) ax.plot(austin_weather["MONTH"], austin_weather["MLY-TAVG-NORMAL"]) ax.set_xlabel("Time (months)") ax.set_ylabel("Average temperature (Fahrenheit degrees)") plt.show()
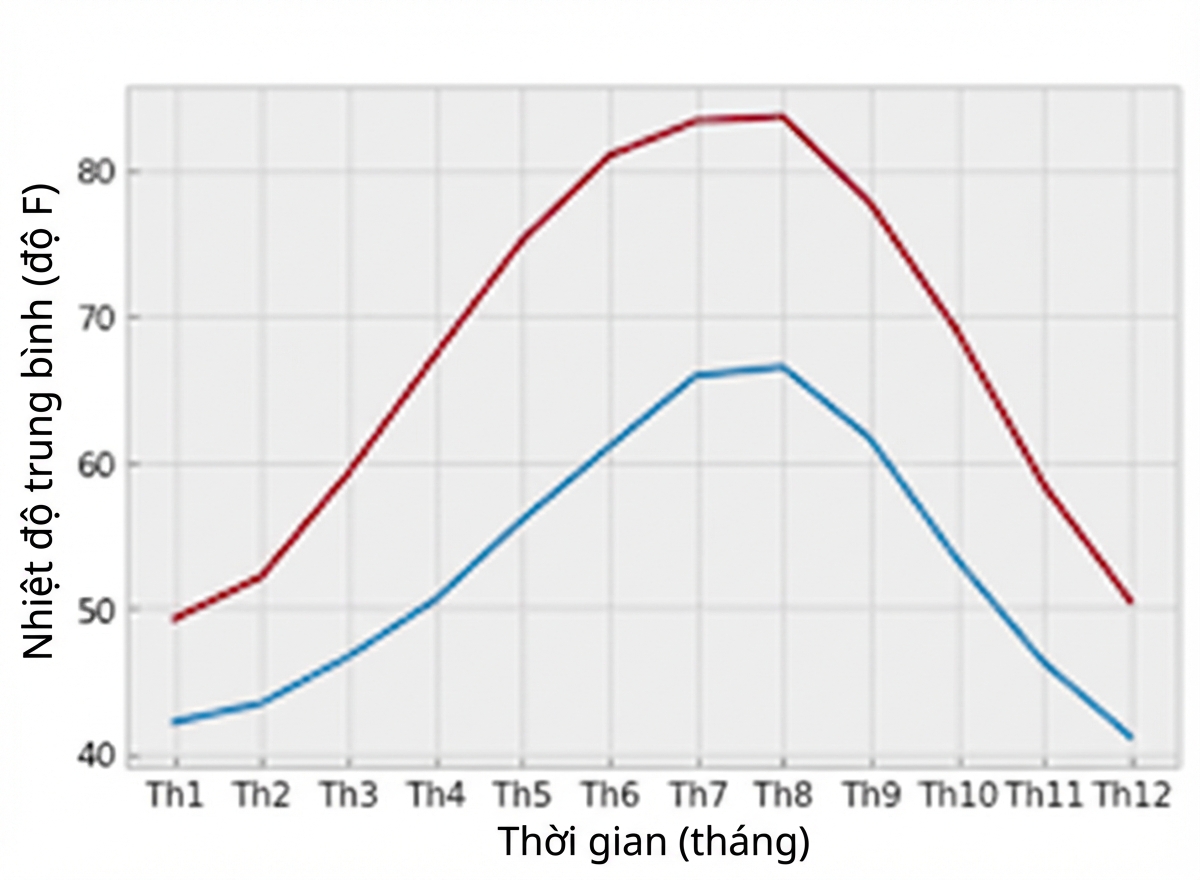
Các kiểu Seaborn
plt.style.use("seaborn-colorblind")fig, ax = plt.subplots() ax.plot(seattle_weather["MONTH"], seattle_weather["MLY-TAVG-NORMAL"]) ax.plot(austin_weather["MONTH"], austin_weather["MLY-TAVG-NORMAL"]) ax.set_xlabel("Time (months)") ax.set_ylabel("Average temperature (Fahrenheit degrees)") plt.show()