Vẽ dữ liệu chuỗi thời gian

Nhập môn trực quan hóa dữ liệu với Matplotlib

Ariel Rokem

Data Scientist

Dữ liệu chuỗi thời gian
Nhập môn trực quan hóa dữ liệu với Matplotlib

Chuỗi thời gian về biến đổi khí hậu

date,co2,relative_temp
1958-03-06,315.71,0.1
1958-04-06,317.45,0.01
1958-05-06,317.5,0.08
1958-06-06,-99.99,-0.05
1958-07-06,315.86,0.06
1958-08-06,314.93,-0.06
...
2016-08-06,402.27,0.98
2016-09-06,401.05,0.87
2016-10-06,401.59,0.89
2016-11-06,403.55,0.93
2016-12-06,404.45,0.81

import pandas as pd
climate_change = pd.read_csv('climate_change.csv', parse_dates=["date"], 
                             index_col="date")
Nhập môn trực quan hóa dữ liệu với Matplotlib

DateTimeIndex

climate_change.index
DatetimeIndex(['1958-03-06', '1958-04-06', '1958-05-06', '1958-06-06',
               '1958-07-06', '1958-08-06', '1958-09-06', '1958-10-06',
               '1958-11-06', '1958-12-06',
               ...
               '2016-03-06', '2016-04-06', '2016-05-06', '2016-06-06',
               '2016-07-06', '2016-08-06', '2016-09-06', '2016-10-06',
               '2016-11-06', '2016-12-06'],
              dtype='datetime64[ns]', name='date', length=706, freq=None)
Nhập môn trực quan hóa dữ liệu với Matplotlib

Dữ liệu chuỗi thời gian

climate_change['relative_temp']
0      0.10
1      0.01
2      0.08
3     -0.05
4      0.06
5     -0.06
6     -0.03
7      0.04
      ...
701    0.98
702    0.87
703    0.89
704    0.93
705    0.81
Name:co2, Length: 706, dtype: float64
climate_change['co2']
0      315.71
1      317.45
2      317.50
3         NaN
4      315.86
5      314.93
6      313.20
7         NaN
      ...
701    402.27
702    401.05
703    401.59
704    403.55
705    404.45
Name:co2, Length: 706, dtype: float64
Nhập môn trực quan hóa dữ liệu với Matplotlib

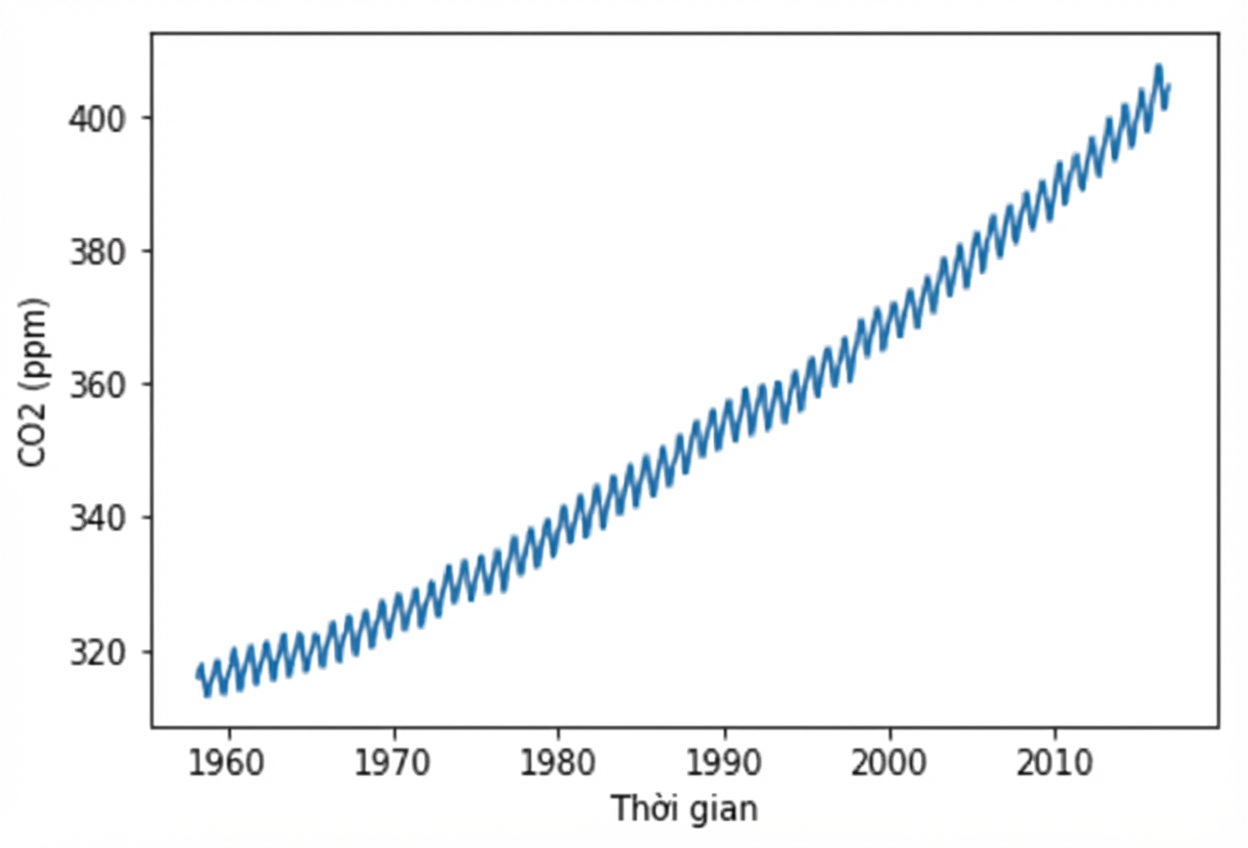
Vẽ dữ liệu chuỗi thời gian

import matplotlib.pyplot as plt
fig, ax = plt.subplots()
ax.plot(climate_change.index, climate_change['co2'])
ax.set_xlabel('Time')
ax.set_ylabel('CO2 (ppm)')
plt.show()
Nhập môn trực quan hóa dữ liệu với Matplotlib

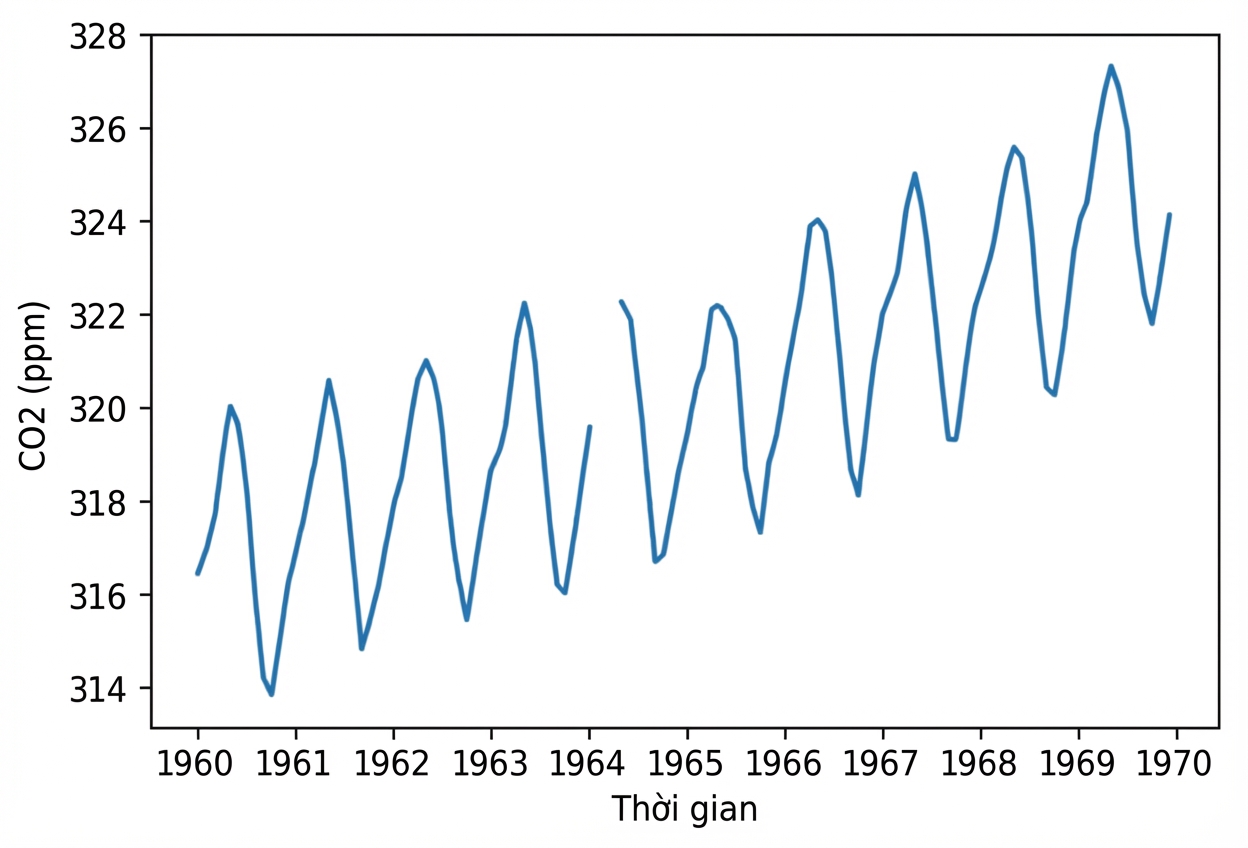
Phóng to một thập kỷ

sixties = climate_change["1960-01-01":"1969-12-31"]
fig, ax = plt.subplots()
ax.plot(sixties.index, sixties['co2'])
ax.set_xlabel('Time')
ax.set_ylabel('CO2 (ppm)')
plt.show()
Nhập môn trực quan hóa dữ liệu với Matplotlib

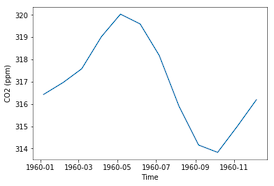
Phóng to một năm

sixty_nine = climate_change["1969-01-01":"1969-12-31"]

fig, ax = plt.subplots() ax.plot(sixty_nine.index, sixty_nine['co2']) ax.set_xlabel('Time') ax.set_ylabel('CO2 (ppm)') plt.show()
Nhập môn trực quan hóa dữ liệu với Matplotlib

Luyện vẽ chuỗi thời gian!

Nhập môn trực quan hóa dữ liệu với Matplotlib

Preparing Video For Download...