Tạo box plot

Giới thiệu trực quan dữ liệu với Seaborn

Content Team

DataCamp

Box plot là gì?
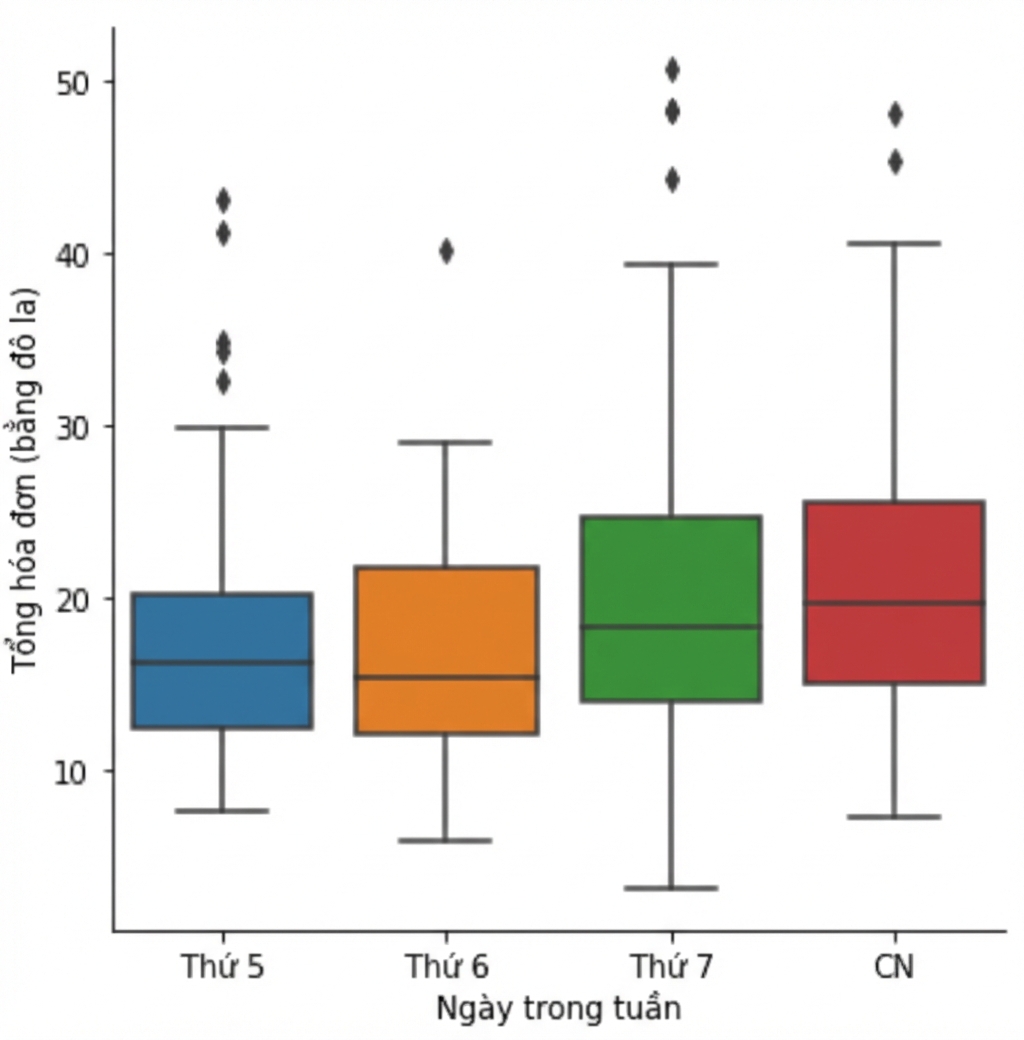
  • Thể hiện phân phối dữ liệu định lượng
  • Xem trung vị, độ phân tán, độ lệch và ngoại lệ
  • Hỗ trợ so sánh giữa các nhóm

Box plot tổng hóa đơn theo ngày trong tuần

1 Waskom, M. L. (2021). seaborn: statistical data visualization. https://seaborn.pydata.org/
Giới thiệu trực quan dữ liệu với Seaborn

Cách tạo box plot

import matplotlib.pyplot as plt
import seaborn as sns

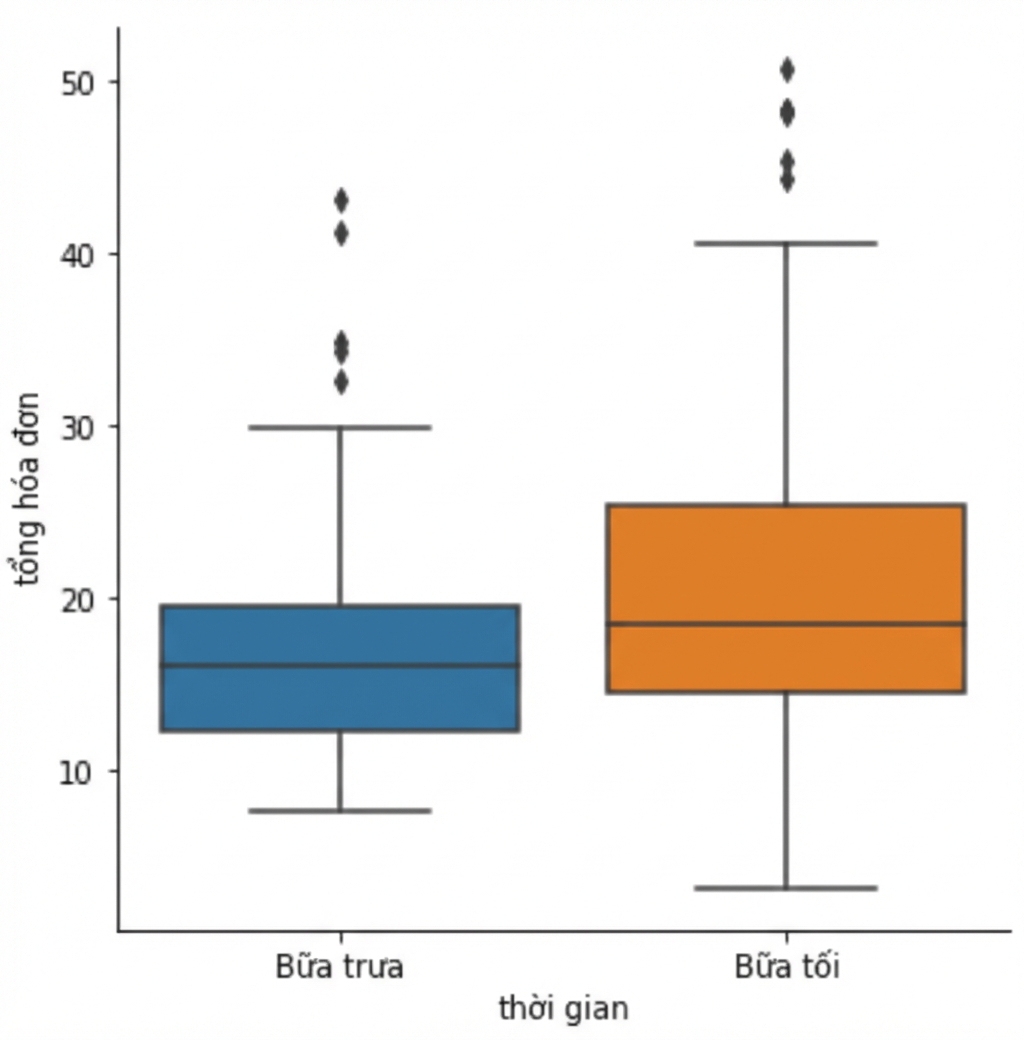
g = sns.catplot(x="time", 
                y="total_bill",
                data=tips, 
                kind="box")

plt.show()

Box plot tổng hóa đơn theo thời điểm trong ngày

1 Waskom, M. L. (2021). seaborn: statistical data visualization. https://seaborn.pydata.org/
Giới thiệu trực quan dữ liệu với Seaborn

Đổi thứ tự danh mục

import matplotlib.pyplot as plt
import seaborn as sns

g = sns.catplot(x="time", 
                y="total_bill",
                data=tips, 
                kind="box",
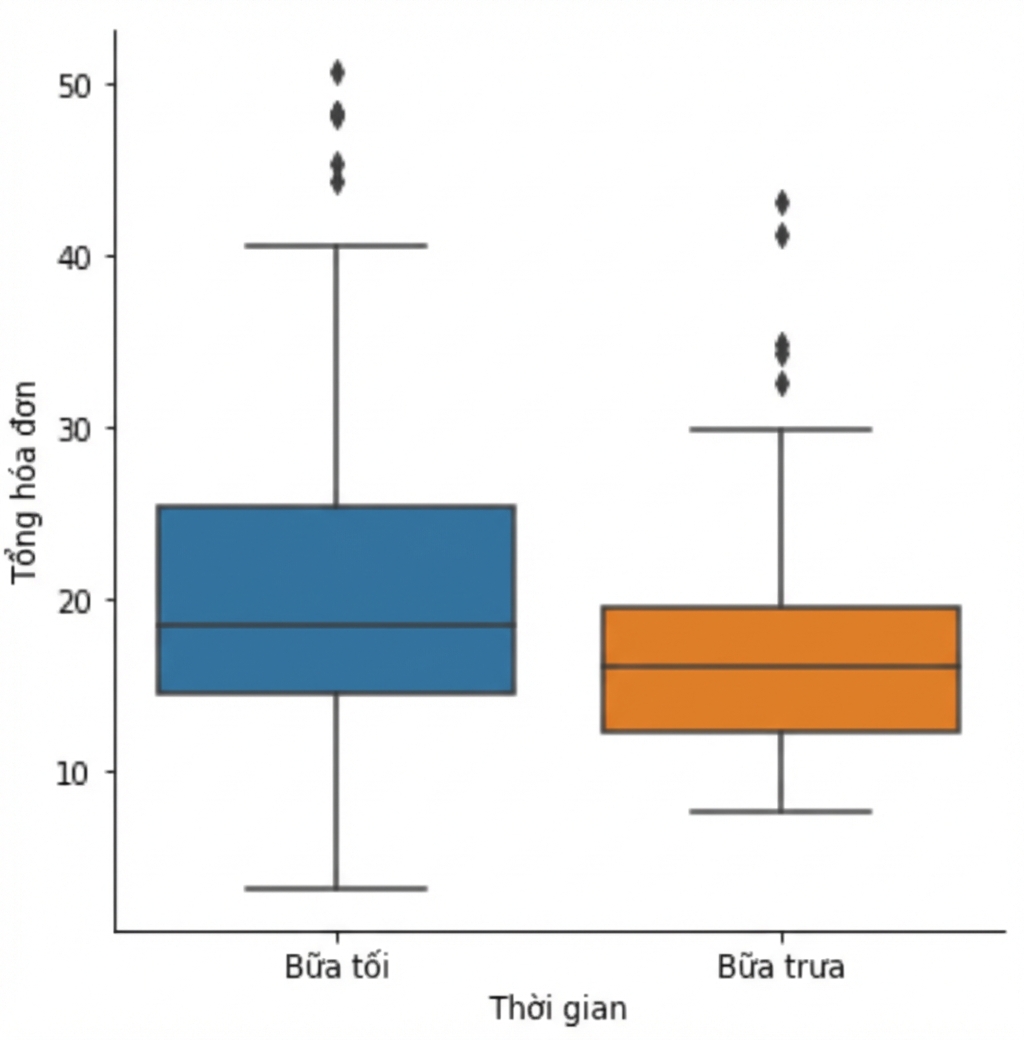
                order=["Dinner", 
                       "Lunch"])

plt.show()

Box plot hiển thị bữa tối trước bữa trưa

1 Waskom, M. L. (2021). seaborn: statistical data visualization. https://seaborn.pydata.org/
Giới thiệu trực quan dữ liệu với Seaborn

Bỏ qua ngoại lệ

import matplotlib.pyplot as plt
import seaborn as sns

g = sns.catplot(x="time", 
                y="total_bill",
                data=tips, 
                kind="box",
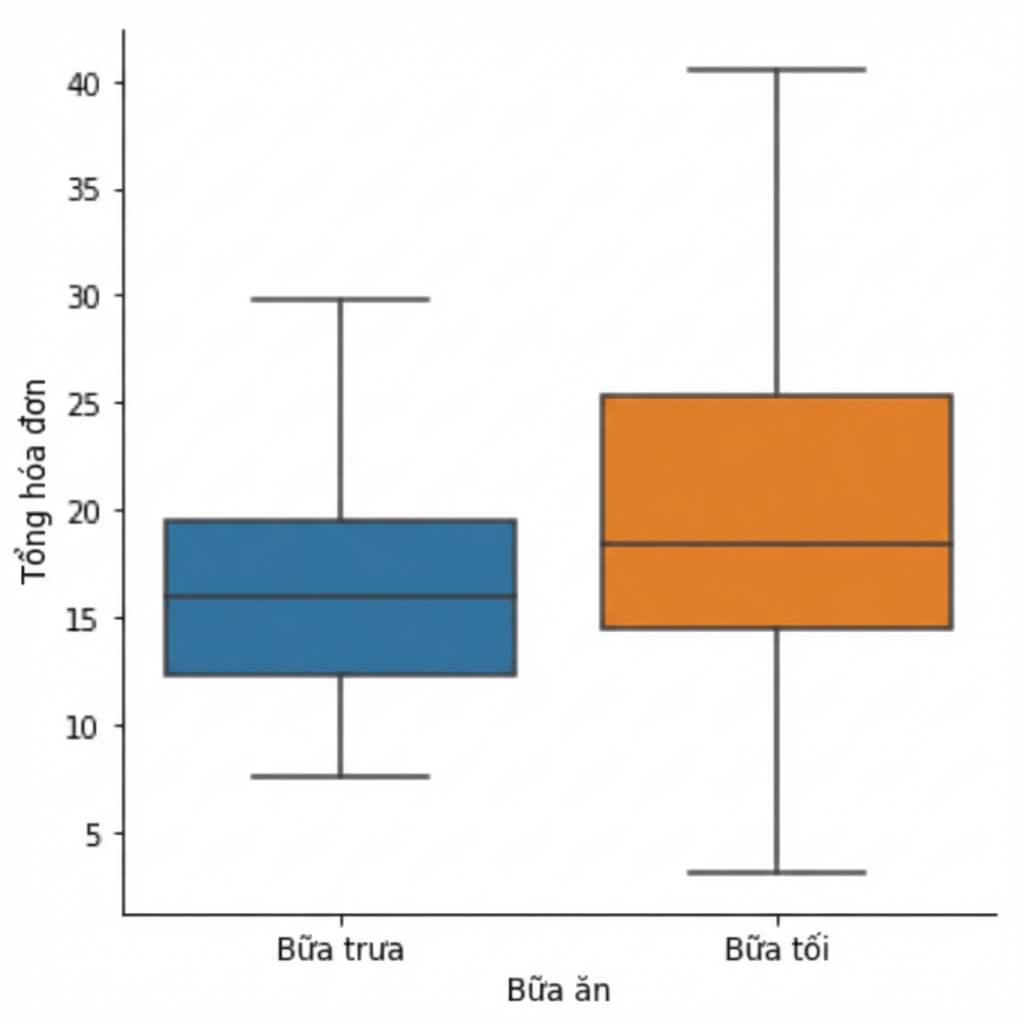
                showfliers=False)

plt.show()

Box plot bỏ qua ngoại lệ

1 Waskom, M. L. (2021). seaborn: statistical data visualization. https://seaborn.pydata.org/
Giới thiệu trực quan dữ liệu với Seaborn

Điều chỉnh râu bằng `whis`

  • Mặc định, râu kéo dài đến 1,5 * khoảng tứ phân vị (IQR)
  • Cho râu dài đến 2,0 * IQR: whis=2.0
  • Hiển thị phần trăm vị trí 5 và 95: whis=[5, 95]
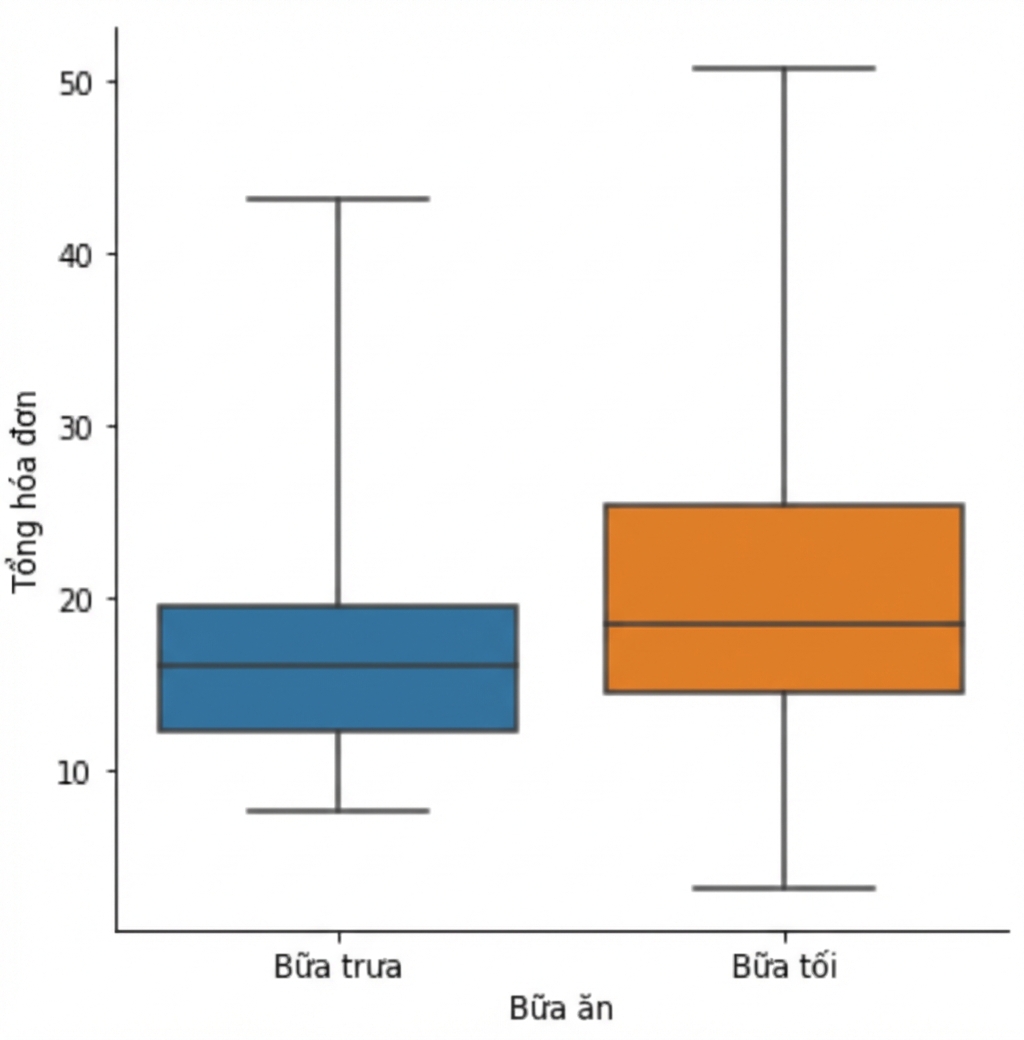
  • Hiển thị giá trị nhỏ nhất và lớn nhất: whis=[0, 100]
Giới thiệu trực quan dữ liệu với Seaborn

Điều chỉnh râu bằng `whis`

import matplotlib.pyplot as plt
import seaborn as sns

g = sns.catplot(x="time", 
                y="total_bill",
                data=tips, 
                kind="box",
                whis=[0, 100])

plt.show()

Box plot với râu ở giá trị nhỏ nhất và lớn nhất

1 Waskom, M. L. (2021). seaborn: statistical data visualization. https://seaborn.pydata.org/
Giới thiệu trực quan dữ liệu với Seaborn

Ayo berlatih!

Giới thiệu trực quan dữ liệu với Seaborn

Preparing Video For Download...