Giới thiệu biểu đồ quan hệ và biểu đồ con

Giới thiệu trực quan dữ liệu với Seaborn

Content Team

DataCamp

Câu hỏi về biến định lượng
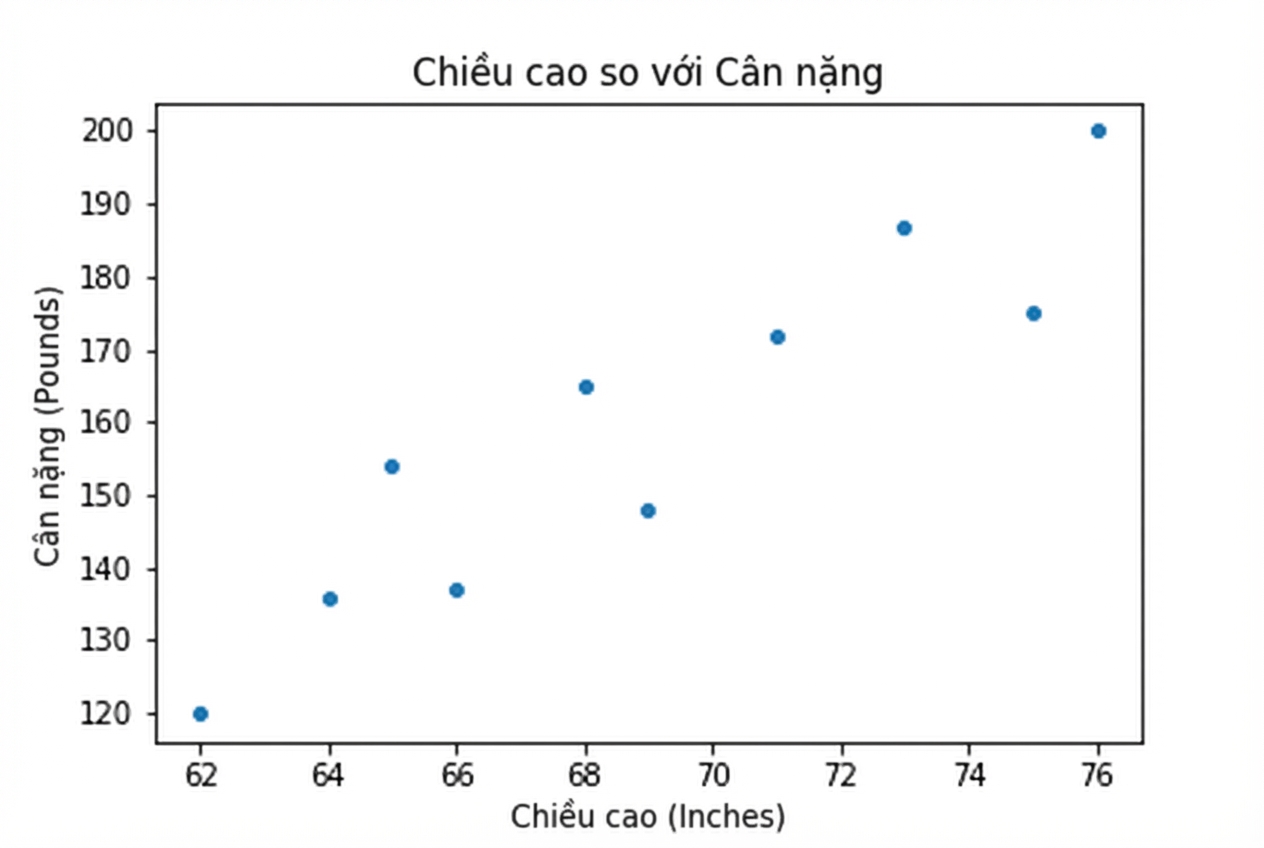
Biểu đồ quan hệ

  • Chiều cao vs. cân nặng

Biểu đồ phân tán chiều cao so với cân nặng

Giới thiệu trực quan dữ liệu với Seaborn

Câu hỏi về biến định lượng

Biểu đồ quan hệ

  • Chiều cao vs. cân nặng
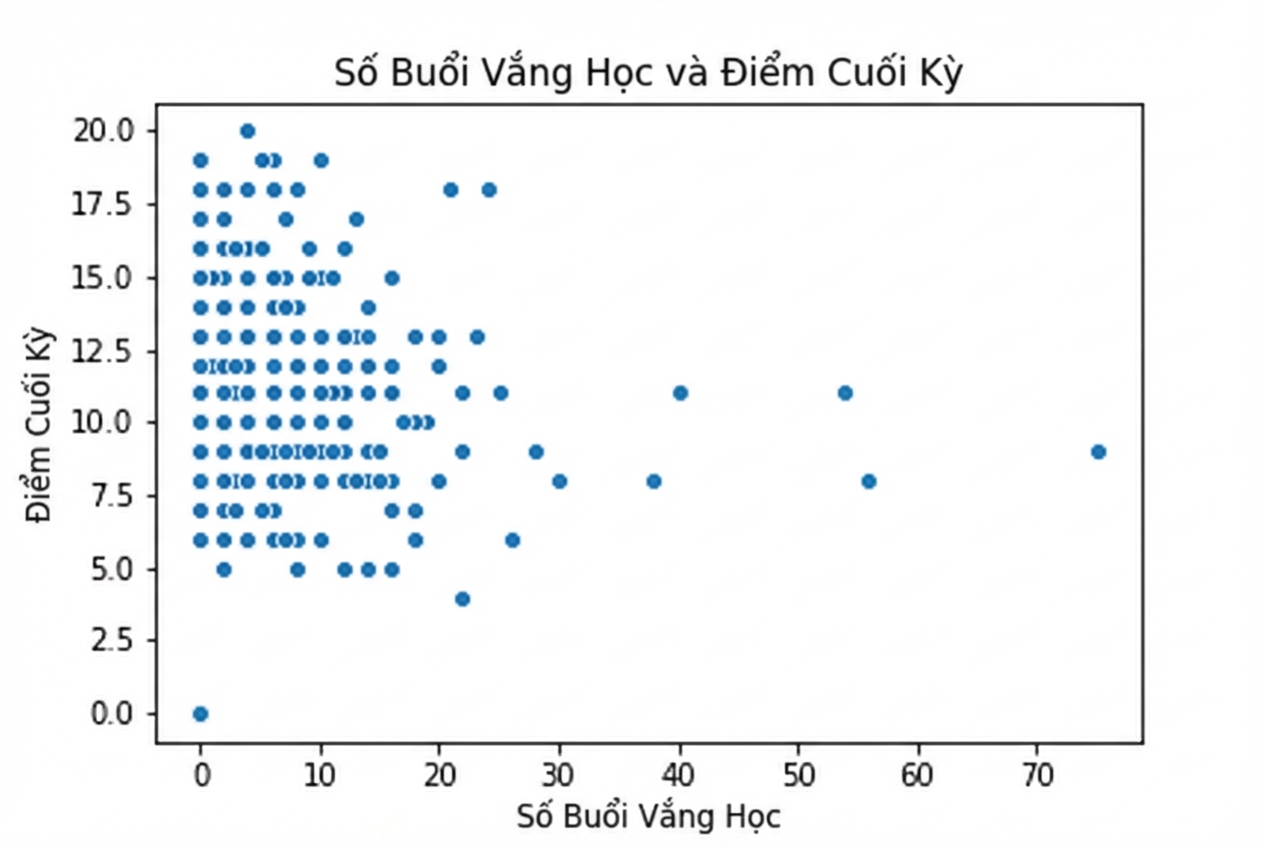
  • Số ngày nghỉ học vs. điểm cuối kỳ

Biểu đồ phân tán số ngày nghỉ học so với điểm cuối kỳ

Giới thiệu trực quan dữ liệu với Seaborn

Câu hỏi về biến định lượng

Biểu đồ quan hệ

  • Chiều cao vs. cân nặng
  • Số ngày nghỉ học vs. điểm cuối kỳ
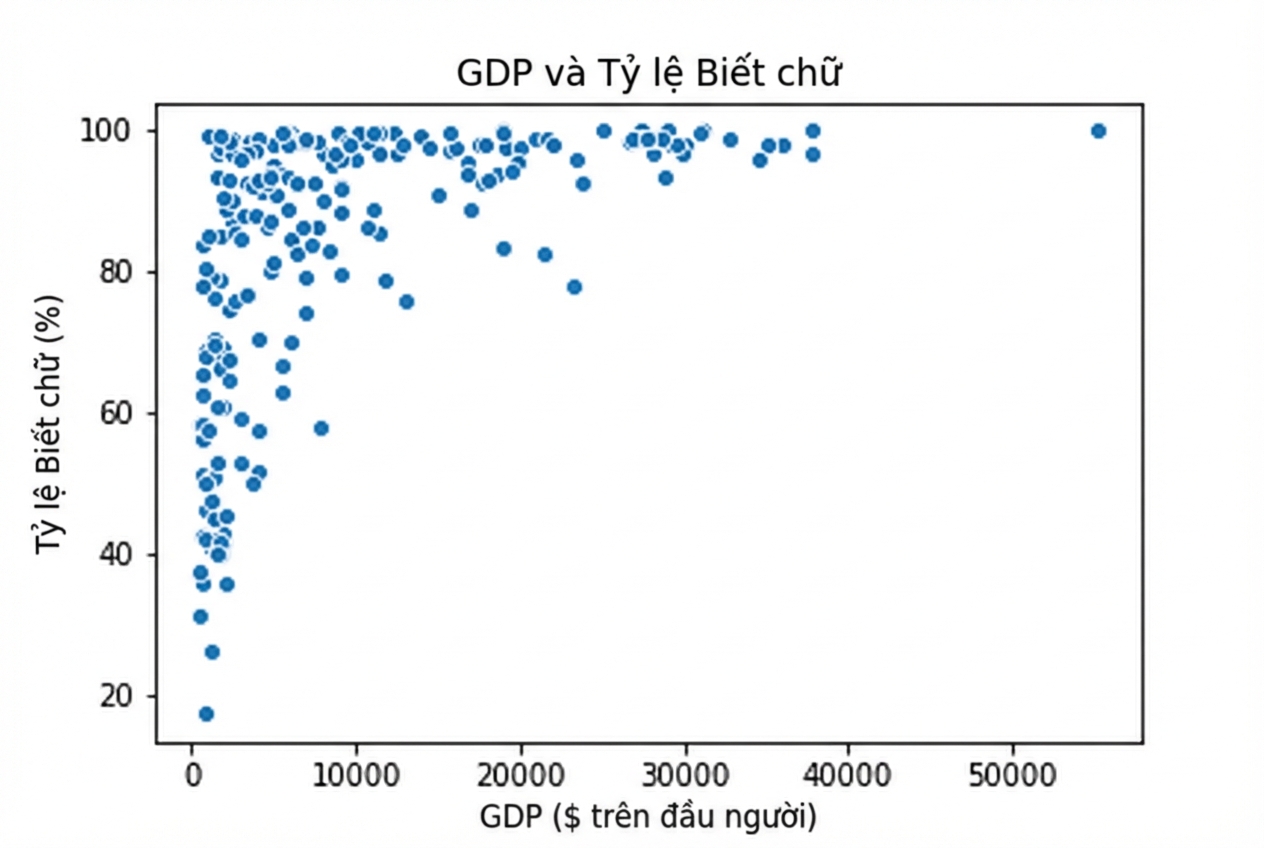
  • GDP vs. tỷ lệ biết chữ

Biểu đồ phân tán GDP so với tỷ lệ biết chữ

Giới thiệu trực quan dữ liệu với Seaborn

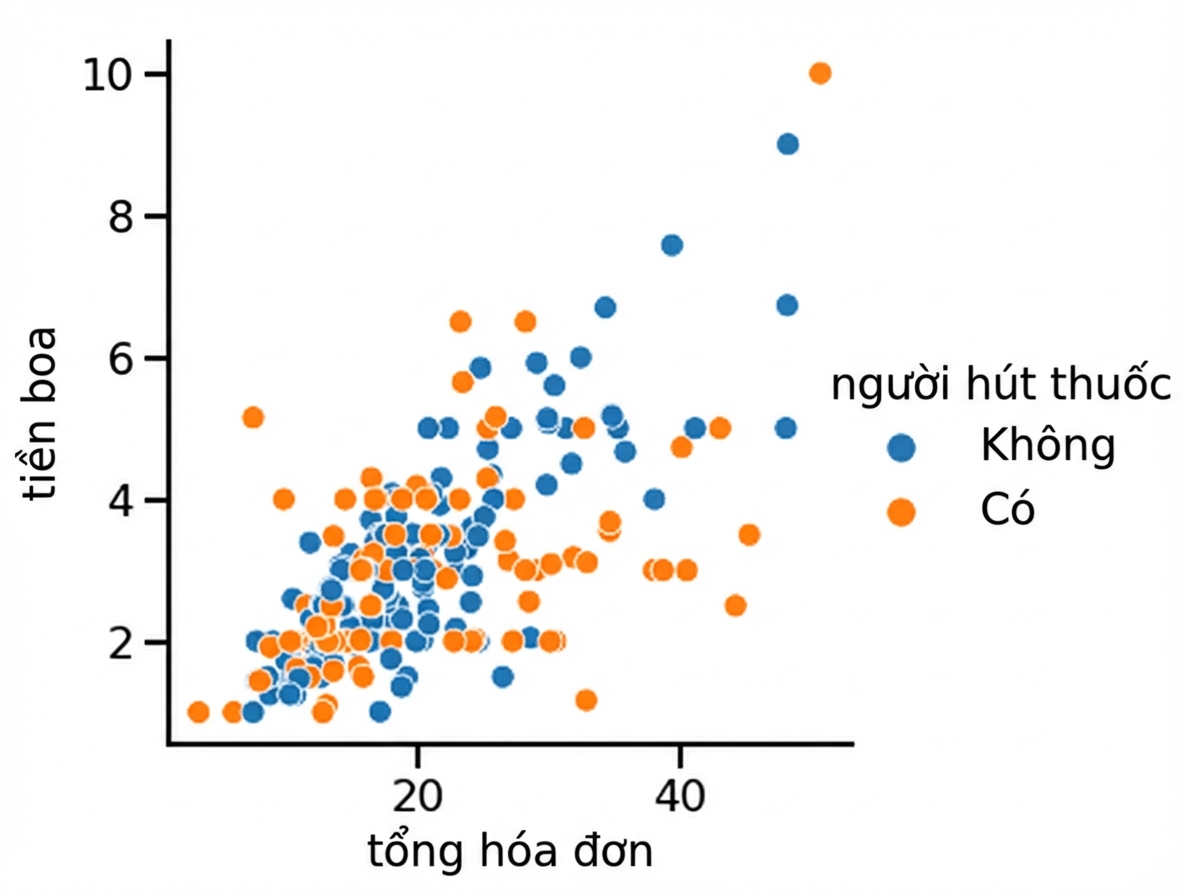
Biểu đồ phân tán với hue

1 Waskom, M. L. (2021). seaborn: statistical data visualization. https://seaborn.pydata.org/
Giới thiệu trực quan dữ liệu với Seaborn

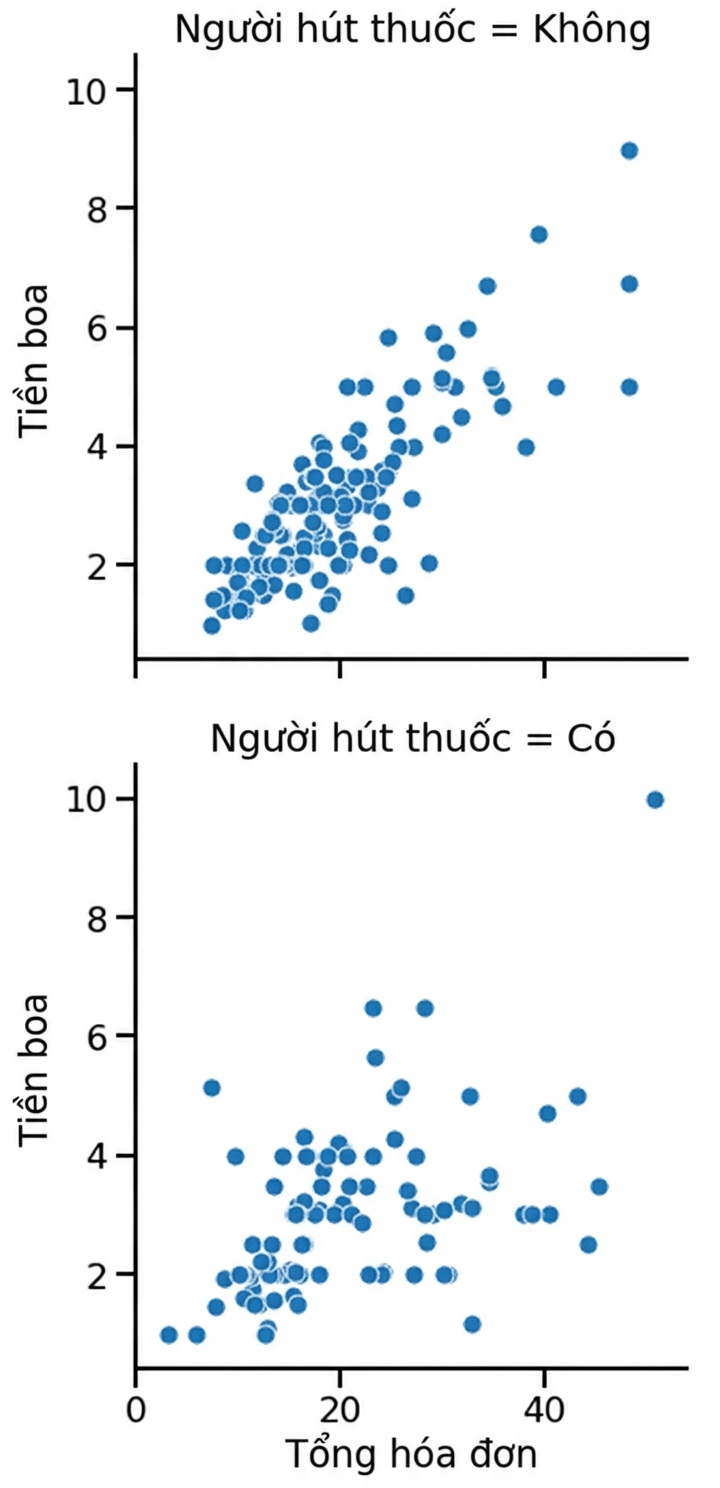
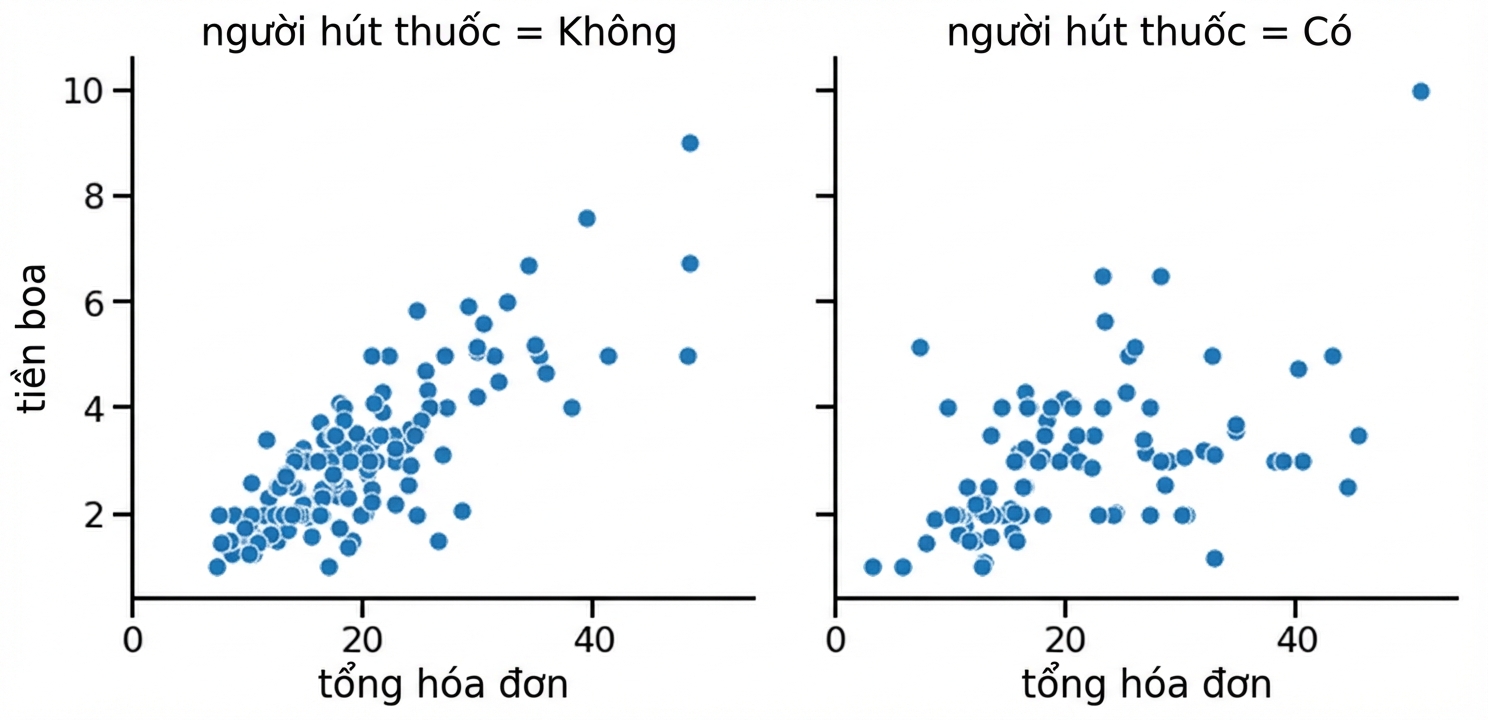
Biểu đồ phân tán với các biểu đồ con

1 Waskom, M. L. (2021). seaborn: statistical data visualization. https://seaborn.pydata.org/
Giới thiệu trực quan dữ liệu với Seaborn

Giới thiệu relplot()

  • Tạo "biểu đồ quan hệ": phân tán hoặc đường

Vì sao dùng relplot() thay cho scatterplot()?

  • relplot() cho phép tạo nhiều biểu đồ con trong một hình
Giới thiệu trực quan dữ liệu với Seaborn

scatterplot() vs. relplot()

Dùng scatterplot()

import seaborn as sns
import matplotlib.pyplot as plt

sns.scatterplot(x="total_bill", 
                y="tip", 
                data=tips)

plt.show()

Dùng relplot()

import seaborn as sns
import matplotlib.pyplot as plt

sns.relplot(x="total_bill", 
            y="tip", 
            data=tips,
            kind="scatter")

plt.show()
1 Waskom, M. L. (2021). seaborn: statistical data visualization. https://seaborn.pydata.org/
Giới thiệu trực quan dữ liệu với Seaborn

Biểu đồ con theo cột

import seaborn as sns
import matplotlib.pyplot as plt

sns.relplot(x="total_bill", 
            y="tip", 
            data=tips,
            kind="scatter",
            col="smoker")

plt.show()

Biểu đồ phân tán với biểu đồ con theo smoker trong cột

1 Waskom, M. L. (2021). seaborn: statistical data visualization. https://seaborn.pydata.org/
Giới thiệu trực quan dữ liệu với Seaborn

Biểu đồ con theo hàng

import seaborn as sns
import matplotlib.pyplot as plt

sns.relplot(x="total_bill", 
            y="tip", 
            data=tips,
            kind="scatter",
            row="smoker")

plt.show()

Biểu đồ phân tán với biểu đồ con theo smoker trong hàng

1 Waskom, M. L. (2021). seaborn: statistical data visualization. https://seaborn.pydata.org/
Giới thiệu trực quan dữ liệu với Seaborn

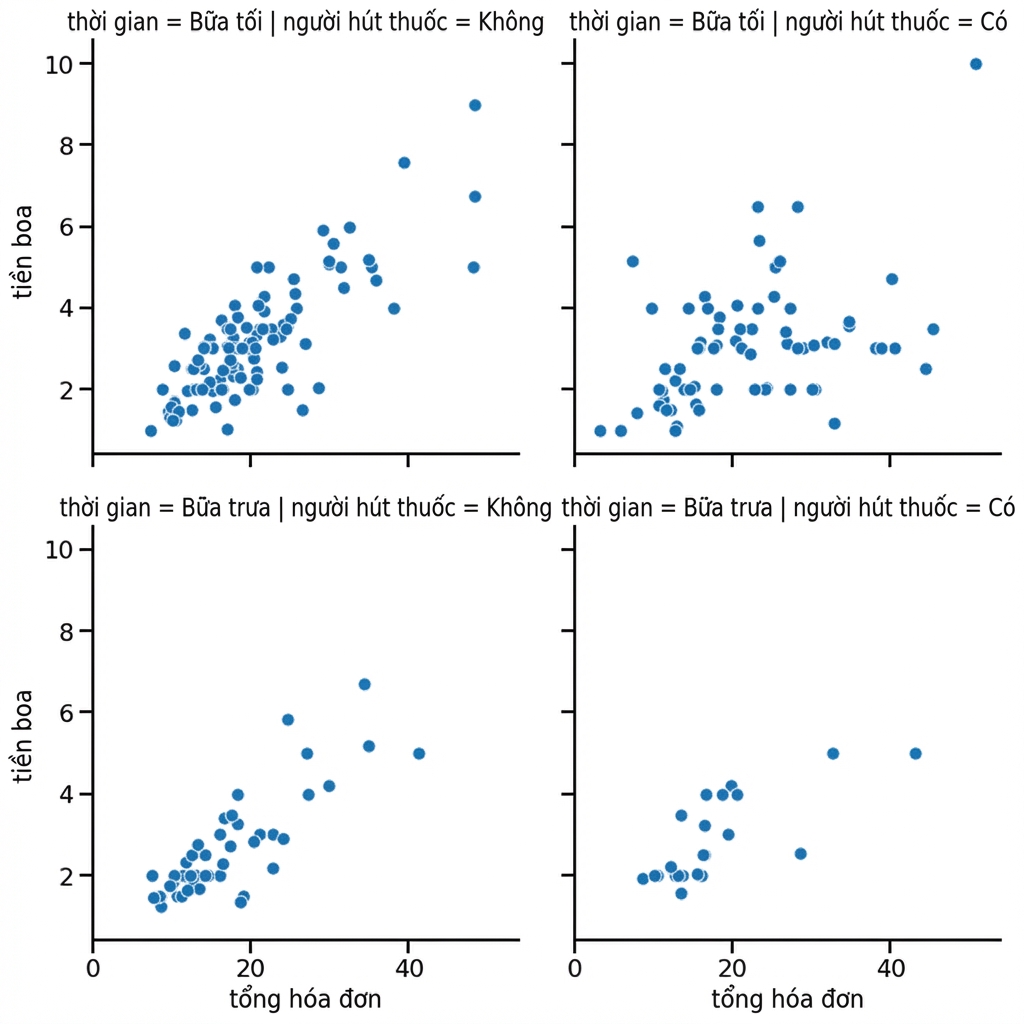
Biểu đồ con theo hàng và cột

import seaborn as sns
import matplotlib.pyplot as plt

sns.relplot(x="total_bill", 
            y="tip", 
            data=tips,
            kind="scatter",
            col="smoker",
            row="time")

plt.show()

Biểu đồ phân tán với biểu đồ con theo smoker và time

1 Waskom, M. L. (2021). seaborn: statistical data visualization. https://seaborn.pydata.org/
Giới thiệu trực quan dữ liệu với Seaborn

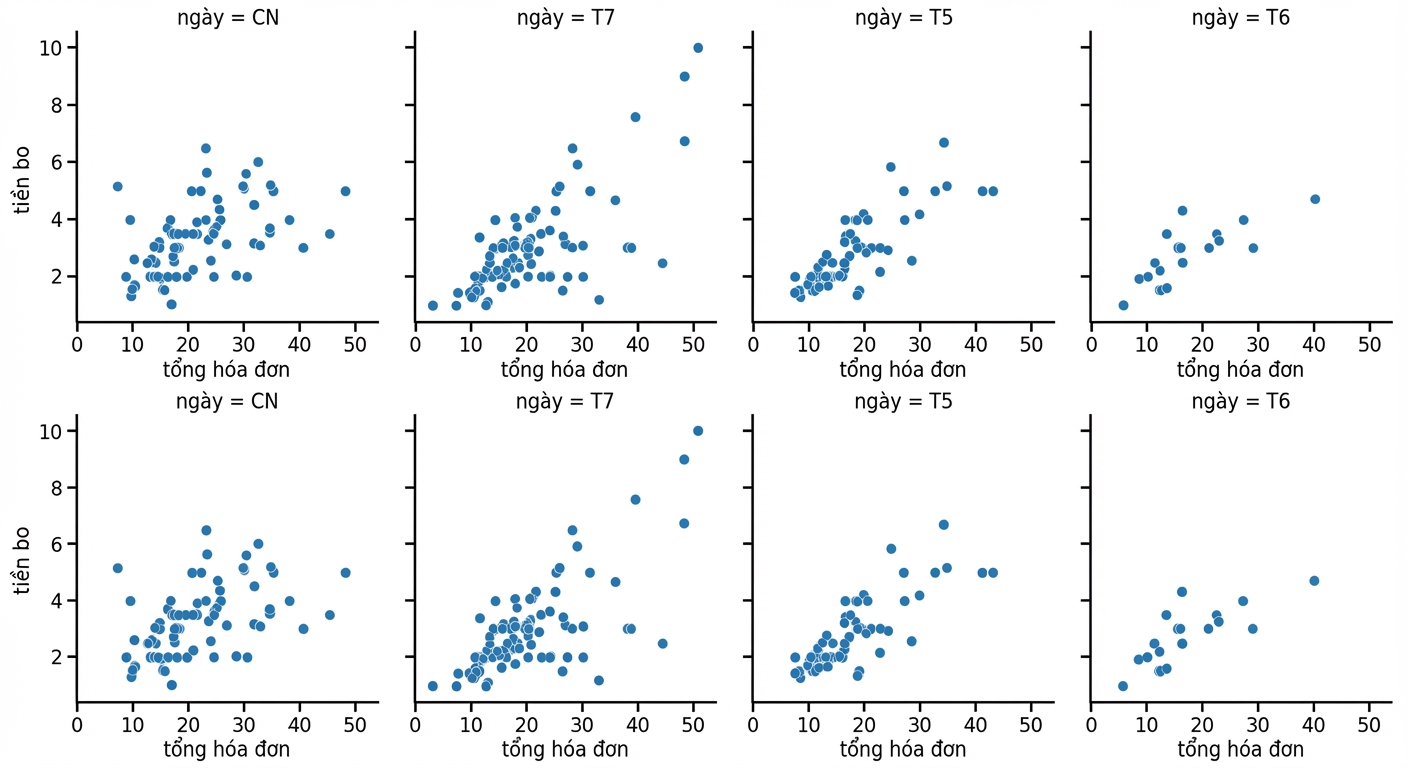
Nhóm phụ theo ngày trong tuần

Biểu đồ phân tán với biểu đồ con theo day trong cột

1 Waskom, M. L. (2021). seaborn: statistical data visualization. https://seaborn.pydata.org/
Giới thiệu trực quan dữ liệu với Seaborn

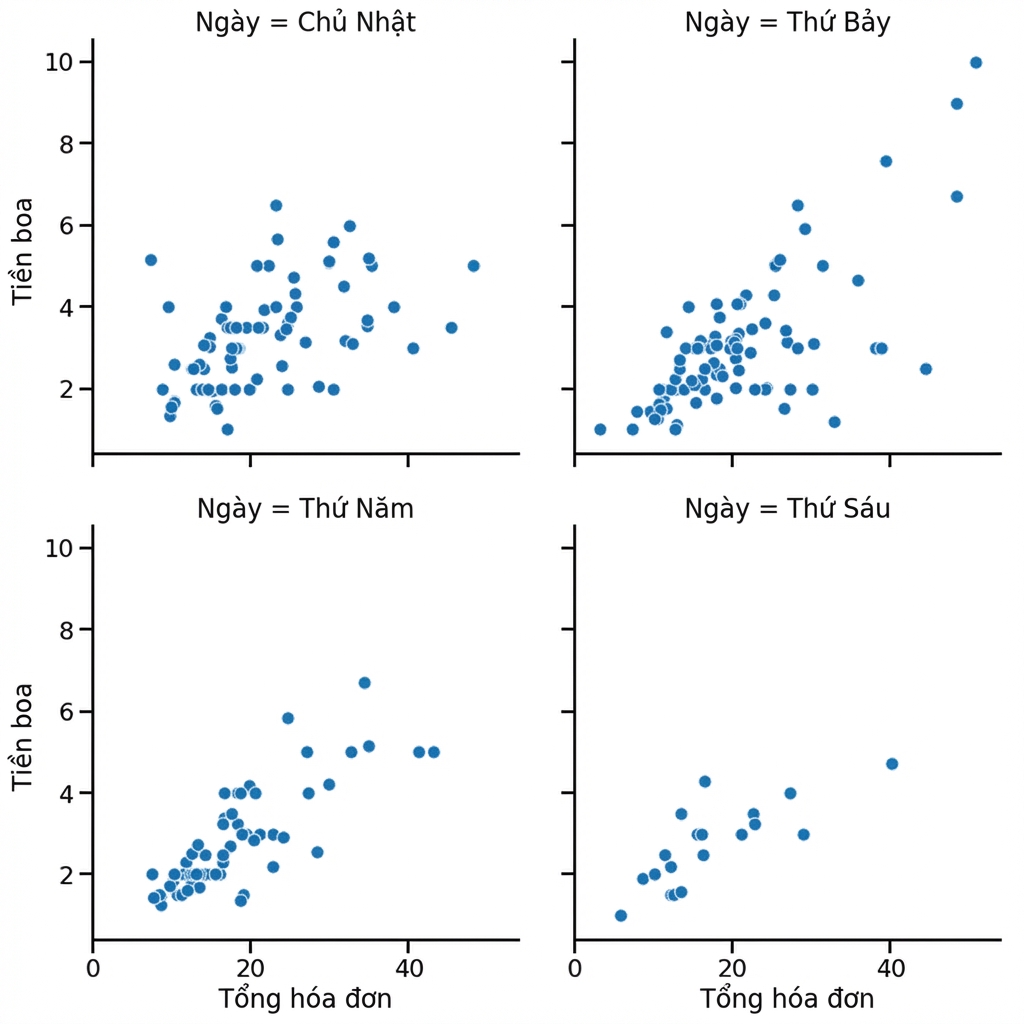
Gói cột (col_wrap)

import seaborn as sns
import matplotlib.pyplot as plt

sns.relplot(x="total_bill", 
            y="tip", 
            data=tips,
            kind="scatter",
            col="day",
            col_wrap=2)

plt.show()

Biểu đồ phân tán với biểu đồ con theo day trong cột, gói thành hai hàng

1 Waskom, M. L. (2021). seaborn: statistical data visualization. https://seaborn.pydata.org/
Giới thiệu trực quan dữ liệu với Seaborn

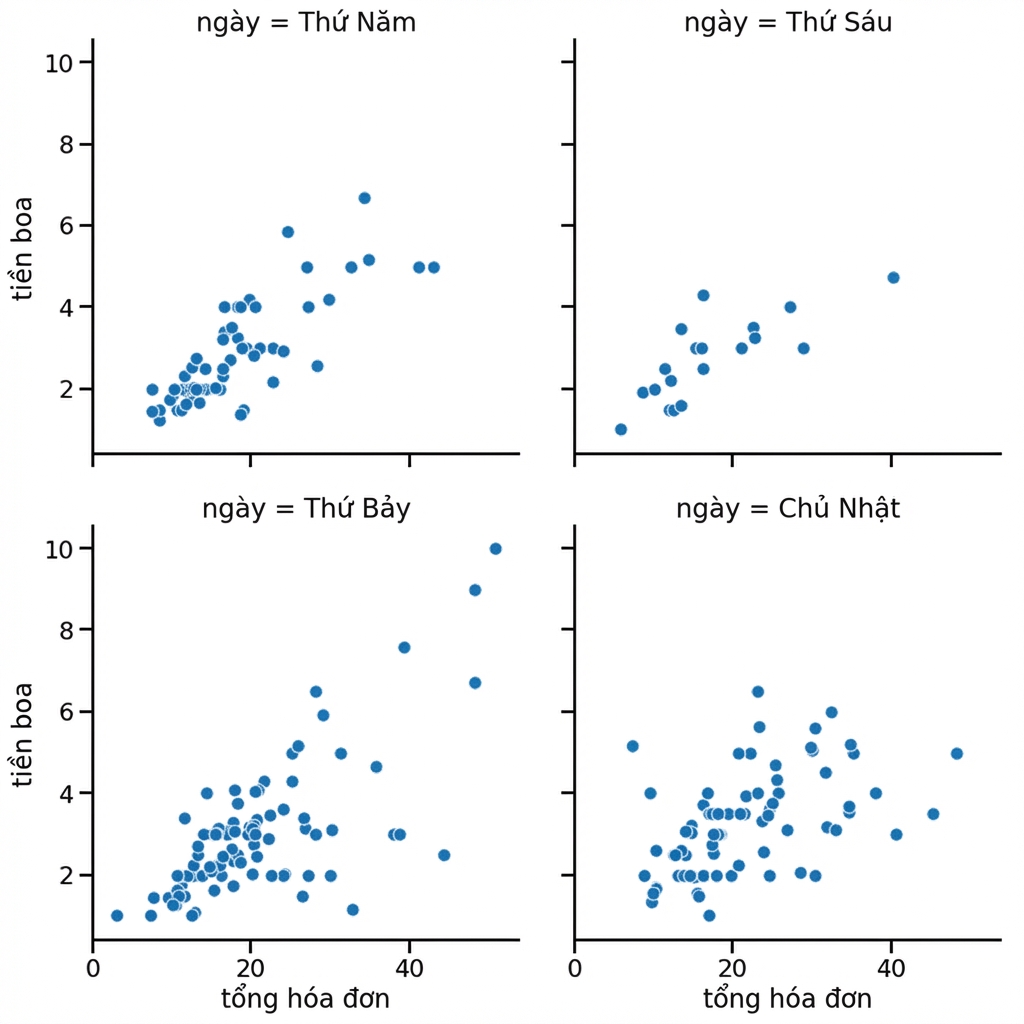
Sắp xếp cột

import seaborn as sns
import matplotlib.pyplot as plt

sns.relplot(x="total_bill", 
            y="tip", 
            data=tips,
            kind="scatter",
            col="day",
            col_wrap=2,
            col_order=["Thur",
                       "Fri",
                       "Sat",
                       "Sun"])

plt.show()

Biểu đồ phân tán với biểu đồ con theo day được sắp thứ tự

1 Waskom, M. L. (2021). seaborn: statistical data visualization. https://seaborn.pydata.org/
Giới thiệu trực quan dữ liệu với Seaborn

Ayo berlatih!

Giới thiệu trực quan dữ liệu với Seaborn

Preparing Video For Download...