Giới thiệu trực quan dữ liệu với Seaborn
Content Team
DataCamp


Biểu đồ Seaborn tạo hai loại đối tượng: FacetGrid và AxesSubplot
g = sns.scatterplot(x="height", y="weight", data=df)type(g)
> matplotlib.axes._subplots.AxesSubplot

| Loại đối tượng | Loại biểu đồ | Đặc điểm |
|---|---|---|
FacetGrid |
relplot(), catplot() |
Có thể tạo nhiều subplot |
AxesSubplot |
scatterplot(), countplot(), v.v. |
Chỉ tạo một biểu đồ đơn |
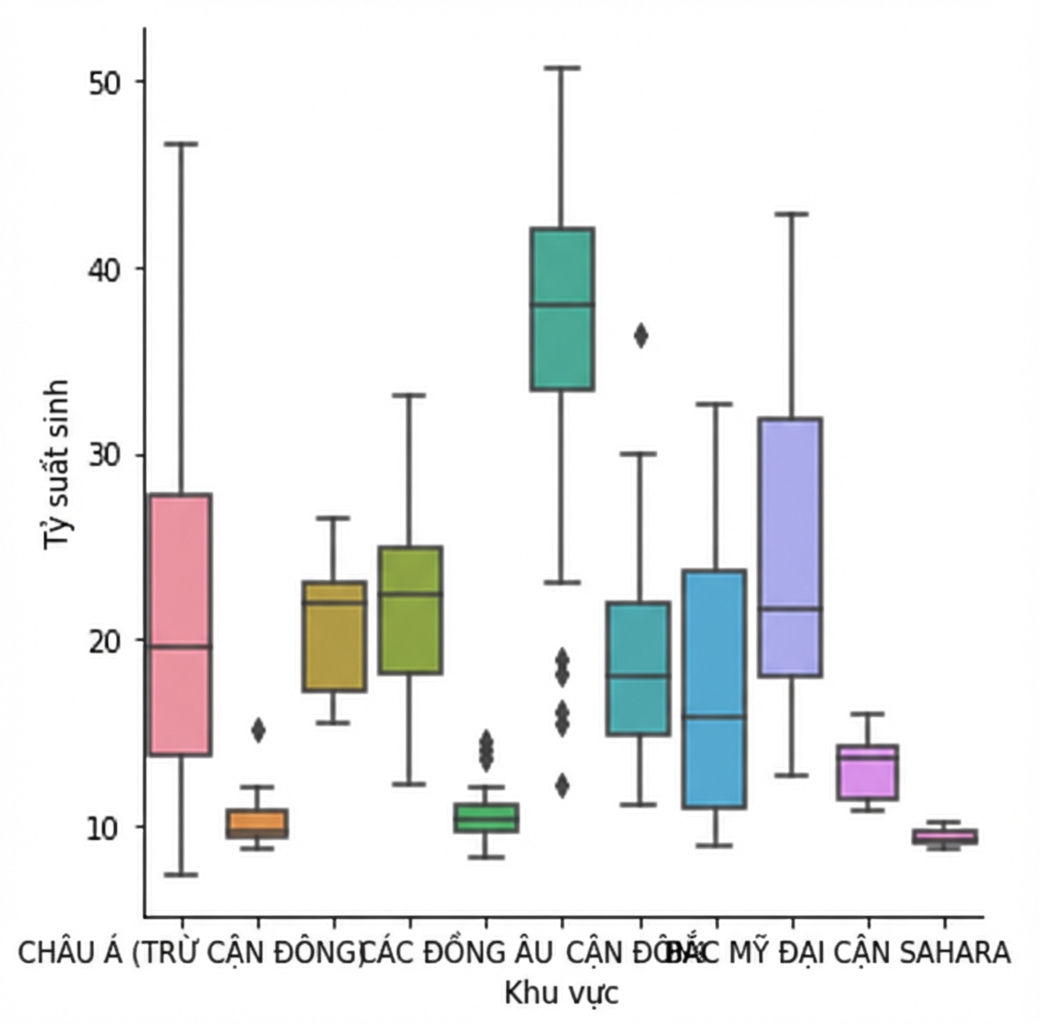
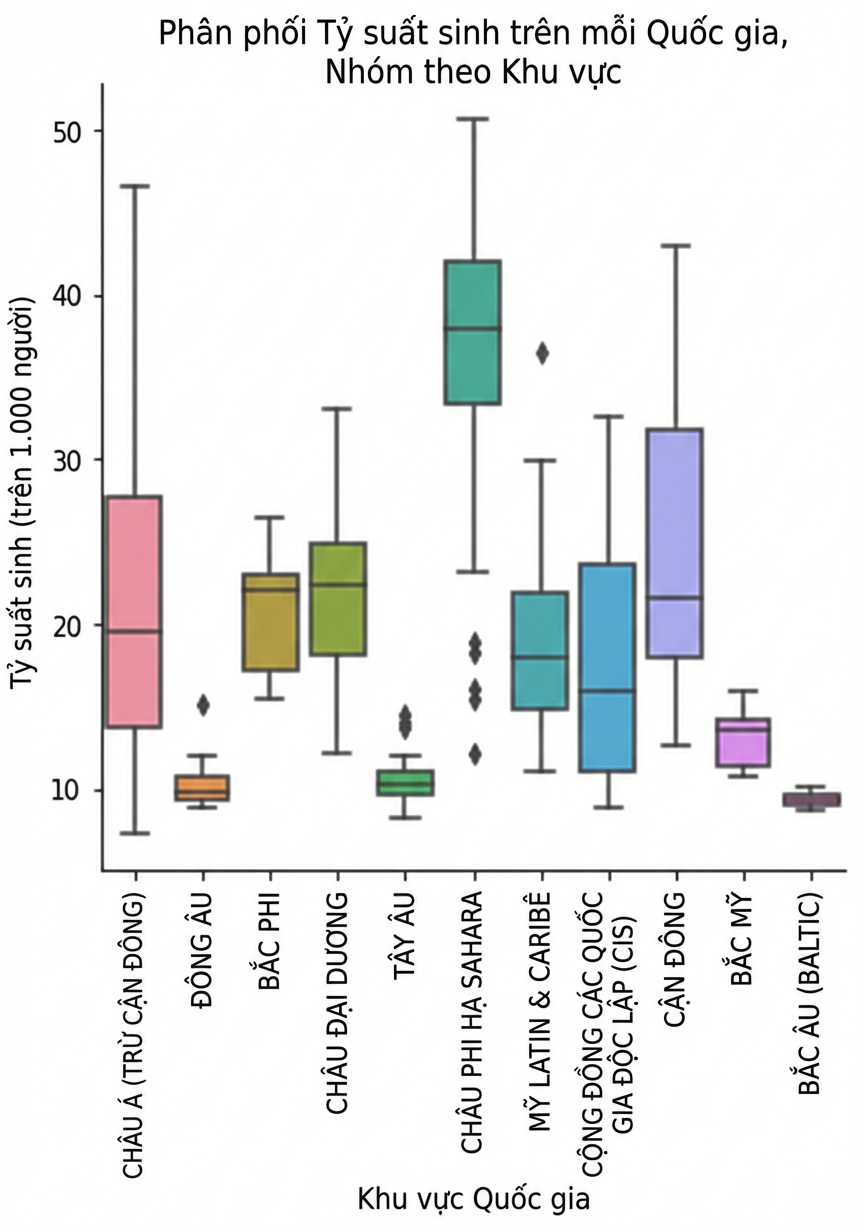
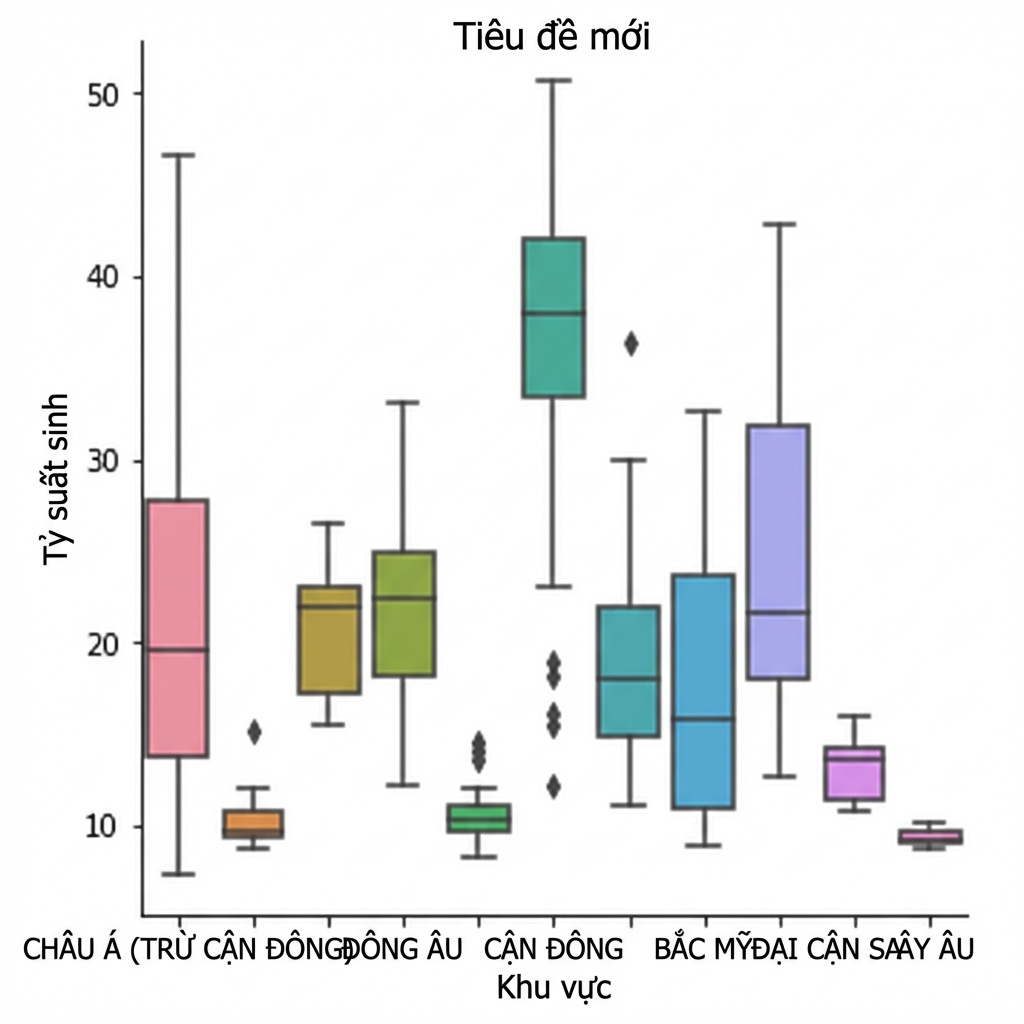
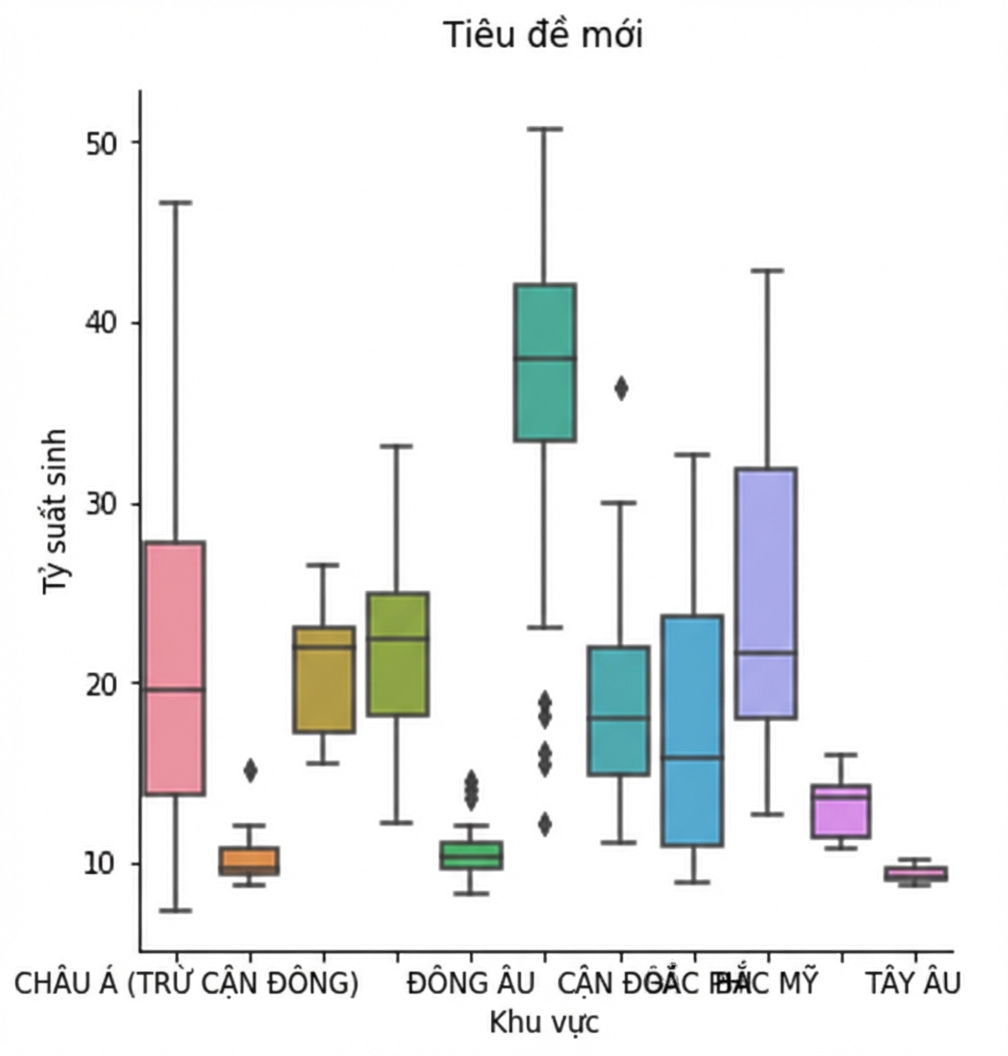
g = sns.catplot(x="Region", y="Birthrate", data=gdp_data, kind="box")g.figure.suptitle("New Title")plt.show()

g = sns.catplot(x="Region",
y="Birthrate",
data=gdp_data,
kind="box")
g.figure.suptitle("New Title",
y=1.03)
plt.show()

Giới thiệu trực quan dữ liệu với Seaborn