Thêm biến thứ ba với hue

Giới thiệu trực quan dữ liệu với Seaborn

Content Team

DataCamp

Bộ dữ liệu Tips

import pandas as pd
import seaborn as sns

tips = sns.load_dataset("tips")
tips.head()
   total_bill   tip     sex smoker  day    time  size
0       16.99  1.01  Female     No  Sun  Dinner     2
1       10.34  1.66    Male     No  Sun  Dinner     3
2       21.01  3.50    Male     No  Sun  Dinner     3
3       23.68  3.31    Male     No  Sun  Dinner     2
4       24.59  3.61  Female     No  Sun  Dinner     4
1 Waskom, M. L. (2021). seaborn: statistical data visualization. https://seaborn.pydata.org/
Giới thiệu trực quan dữ liệu với Seaborn

Biểu đồ phân tán cơ bản

import matplotlib.pyplot as plt
import seaborn as sns

sns.scatterplot(x="total_bill", 
                y="tip", 
                data=tips)

plt.show()

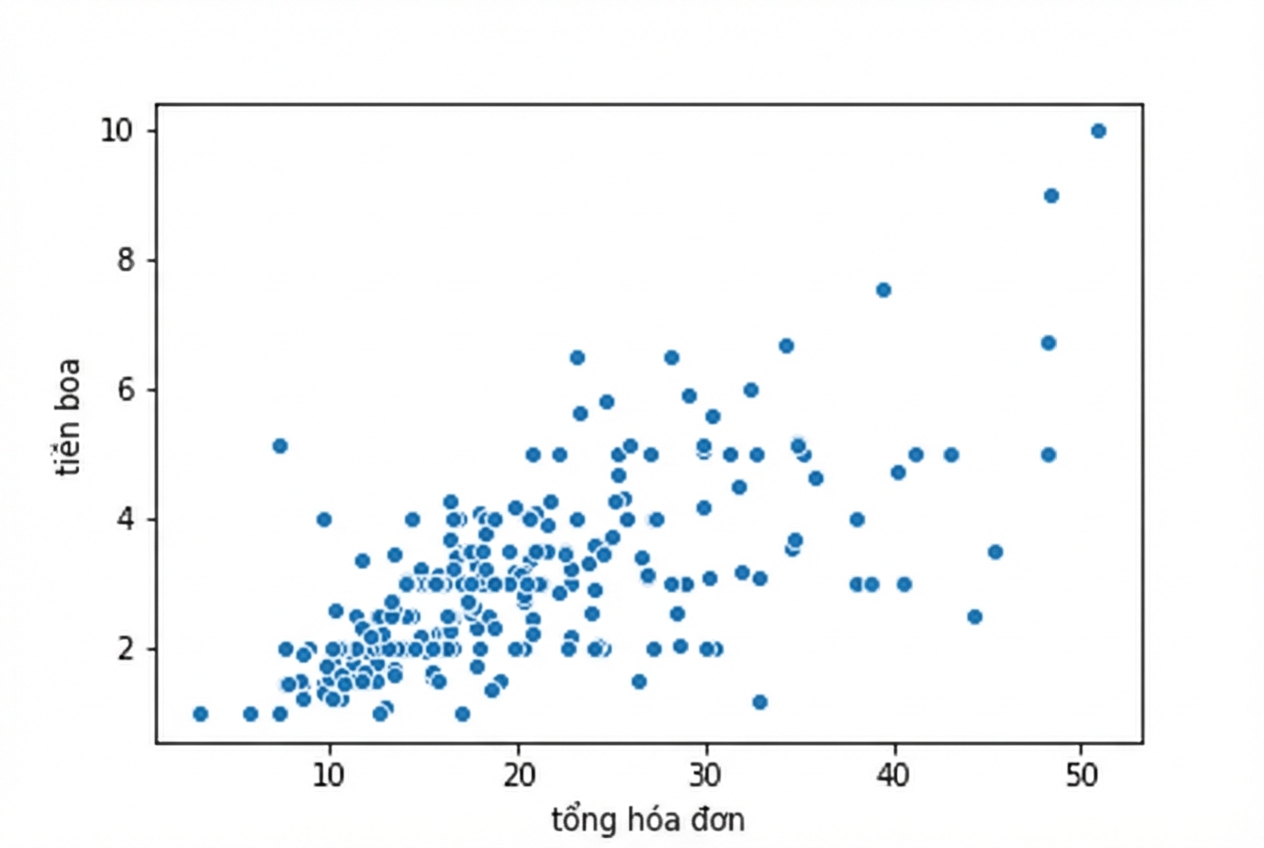
Biểu đồ phân tán tổng hóa đơn so với tiền tip

1 Waskom, M. L. (2021). seaborn: statistical data visualization. https://seaborn.pydata.org/
Giới thiệu trực quan dữ liệu với Seaborn

Biểu đồ phân tán với hue

import matplotlib.pyplot as plt
import seaborn as sns

sns.scatterplot(x="total_bill", 
                y="tip", 
                data=tips,
                hue="smoker")

plt.show()

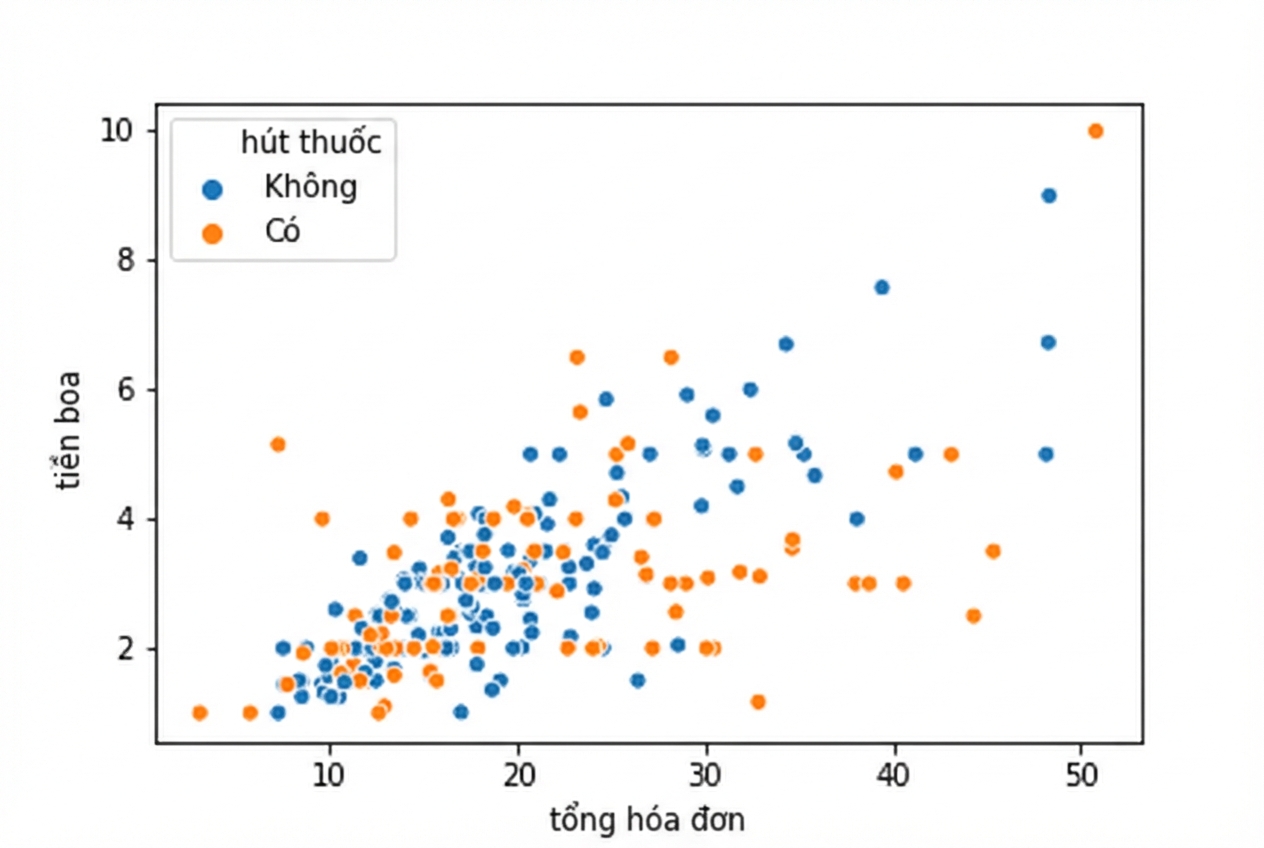
Biểu đồ phân tán với điểm màu theo trạng thái hút thuốc

1 Waskom, M. L. (2021). seaborn: statistical data visualization. https://seaborn.pydata.org/
Giới thiệu trực quan dữ liệu với Seaborn

Thiết lập thứ tự hue

import matplotlib.pyplot as plt
import seaborn as sns

sns.scatterplot(x="total_bill", 
                y="tip", 
                data=tips,
                hue="smoker",
                hue_order=["Yes", 
                           "No"])

plt.show()

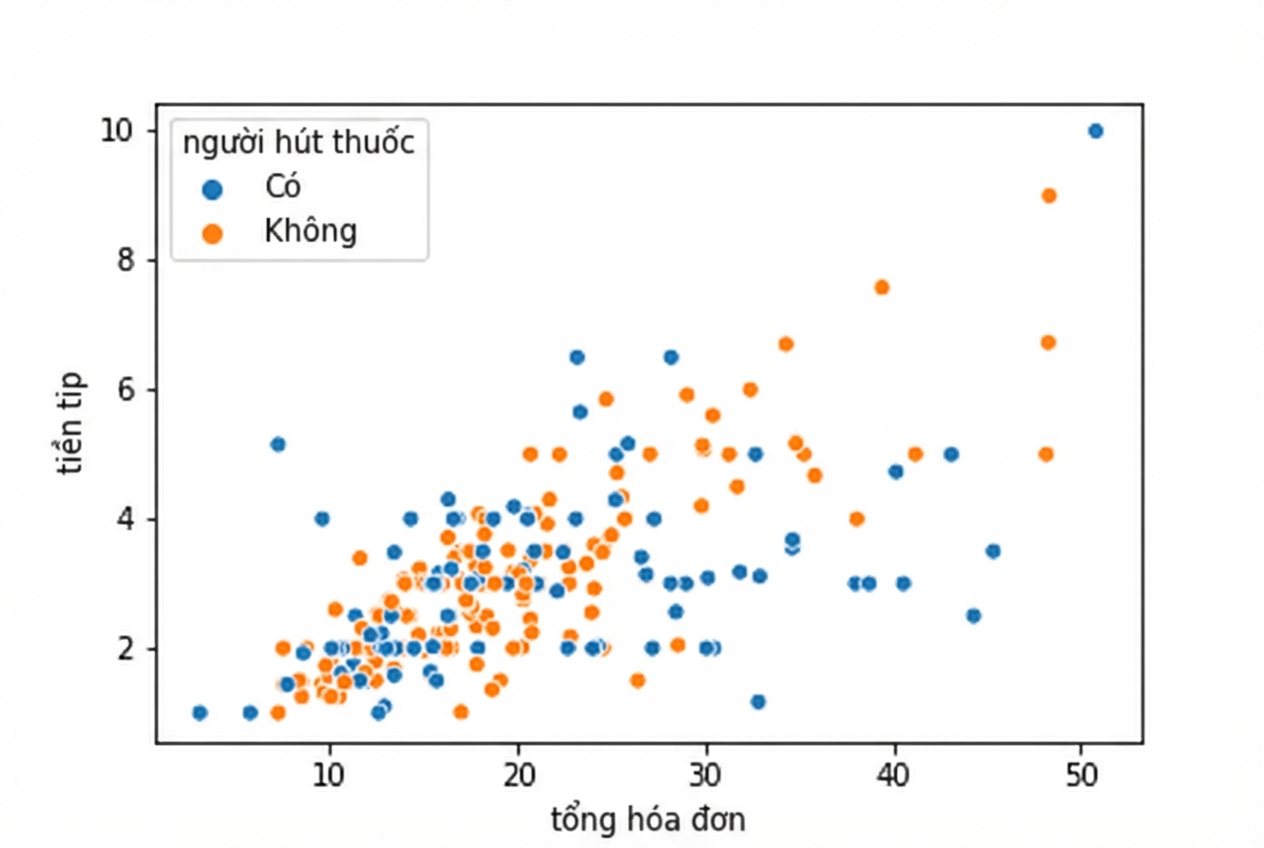
Biểu đồ phân tán với người hút thuốc trước người không hút trong chú giải

1 Waskom, M. L. (2021). seaborn: statistical data visualization. https://seaborn.pydata.org/
Giới thiệu trực quan dữ liệu với Seaborn

Chỉ định màu cho hue

import matplotlib.pyplot as plt
import seaborn as sns

hue_colors = {"Yes": "black", "No": "red"}
sns.scatterplot(x="total_bill", y="tip", data=tips, hue="smoker", palette=hue_colors) plt.show()

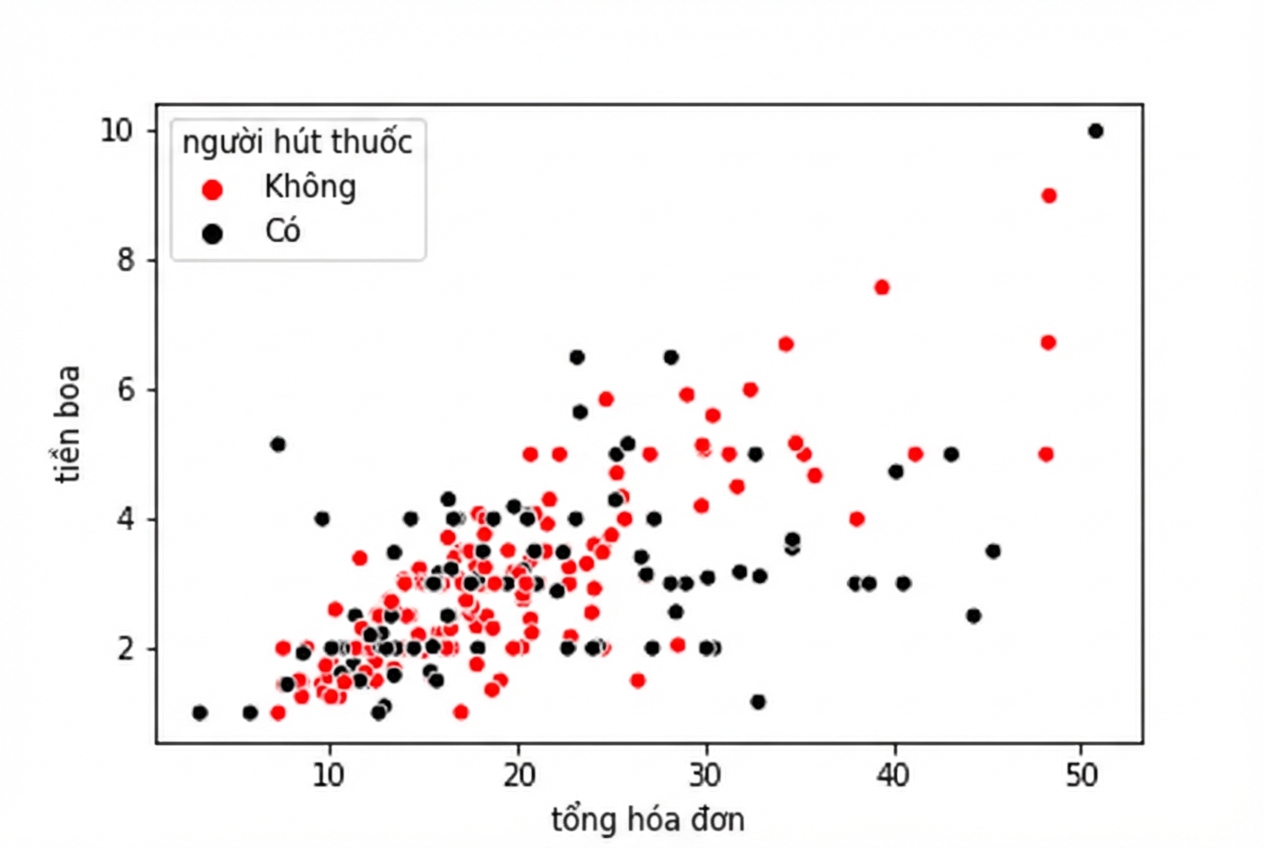
Biểu đồ phân tán với màu hue đen và đỏ

1 Waskom, M. L. (2021). seaborn: statistical data visualization. https://seaborn.pydata.org/
Giới thiệu trực quan dữ liệu với Seaborn

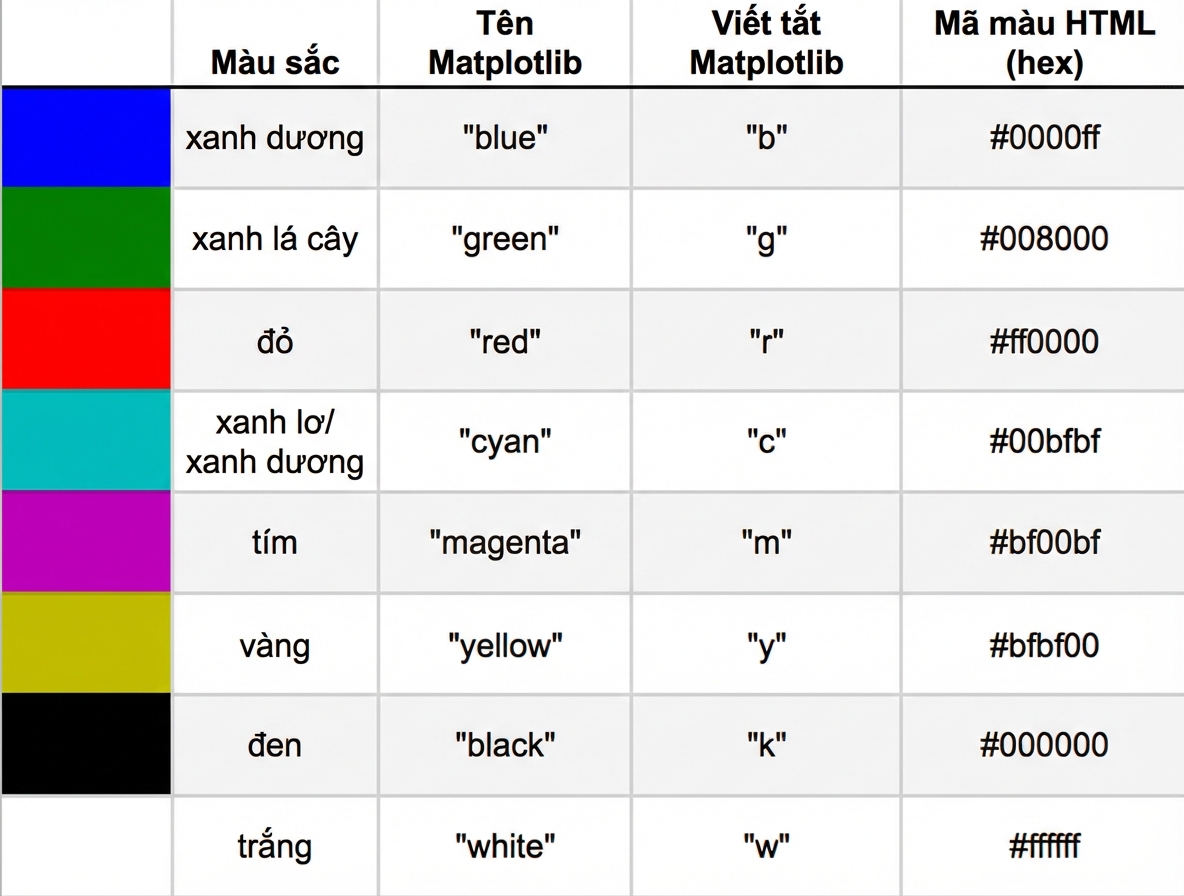
Bảng tên màu và mã hex

Giới thiệu trực quan dữ liệu với Seaborn

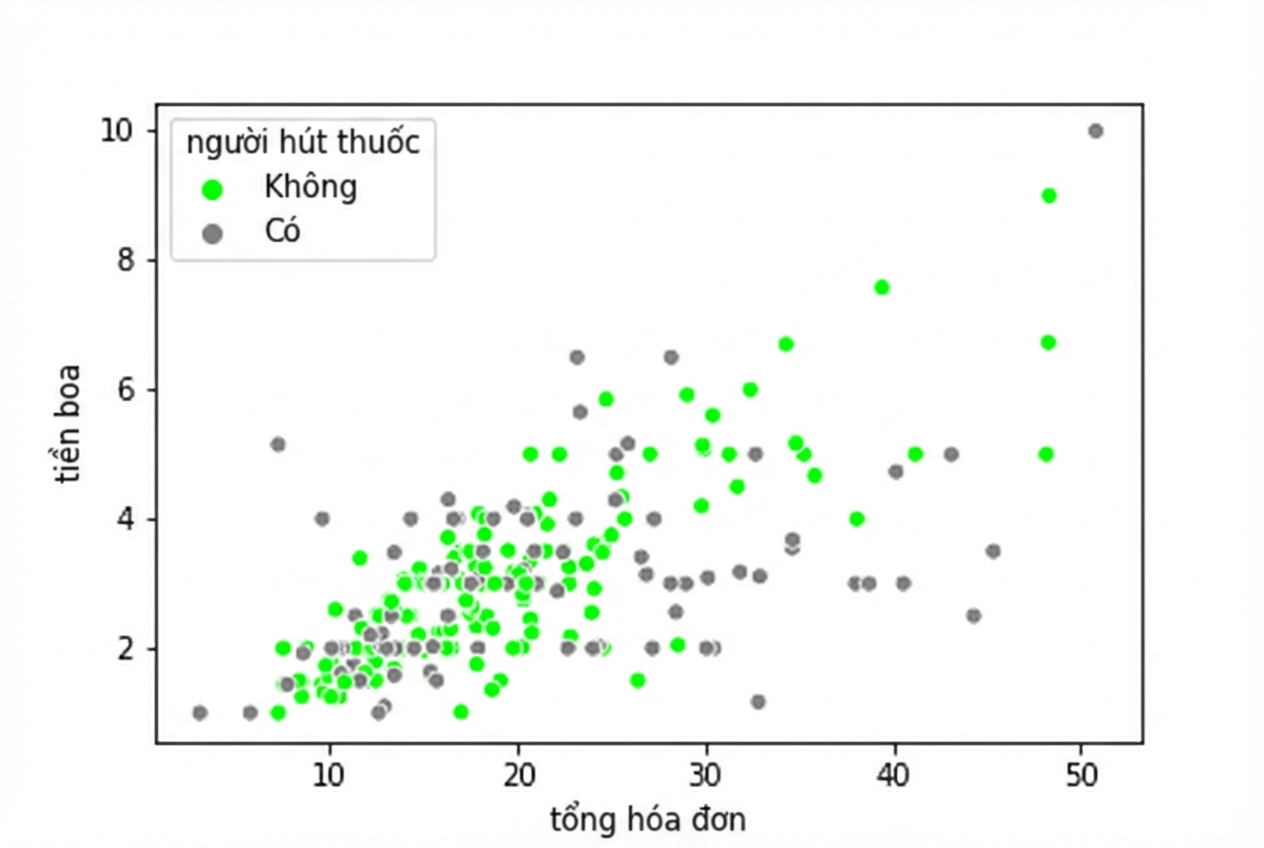
Dùng mã màu hex HTML với hue

import matplotlib.pyplot as plt
import seaborn as sns

hue_colors = {"Yes": "#808080", 
              "No": "#00FF00"}

sns.scatterplot(x="total_bill", 
                y="tip", 
                data=tips,
                hue="smoker",
                palette=hue_colors)

plt.show()

Biểu đồ phân tán với màu hex

1 Waskom, M. L. (2021). seaborn: statistical data visualization. https://seaborn.pydata.org/
Giới thiệu trực quan dữ liệu với Seaborn

Dùng hue với countplot

import matplotlib.pyplot as plt
import seaborn as sns

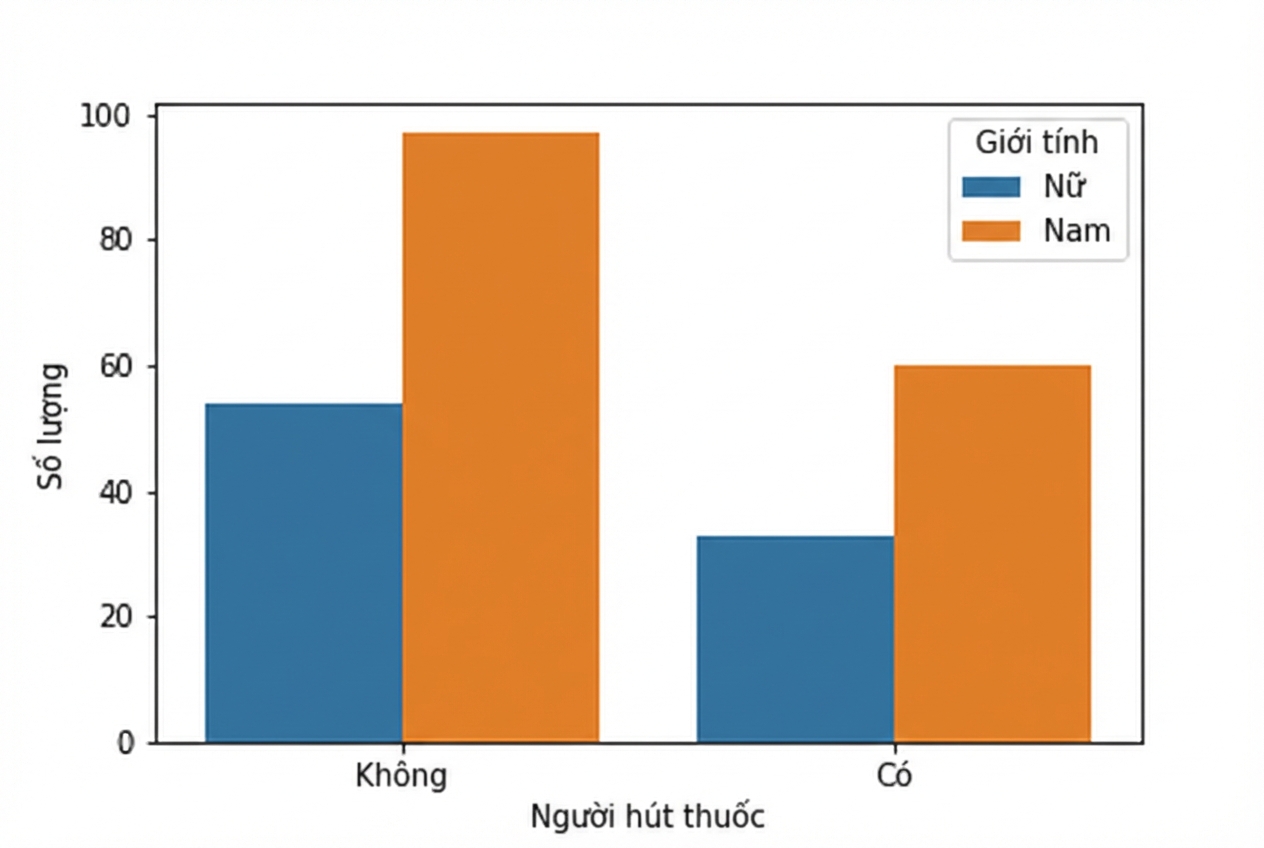
sns.countplot(x="smoker", 
              data=tips, 
              hue="sex")

plt.show()

Biểu đồ cột đếm trạng thái hút thuốc với nhóm phụ nam và nữ

1 Waskom, M. L. (2021). seaborn: statistical data visualization. https://seaborn.pydata.org/
Giới thiệu trực quan dữ liệu với Seaborn

Ayo berlatih!

Giới thiệu trực quan dữ liệu với Seaborn

Preparing Video For Download...