Thêm tiêu đề và nhãn: Phần 2

Giới thiệu trực quan dữ liệu với Seaborn

Content Team

DataCamp

Thêm tiêu đề cho AxesSubplot

FacetGrid
g = sns.catplot(x="Region", 
                y="Birthrate", 
                data=gdp_data, 
                kind="box") 

g.figure.suptitle("New Title", y=1.03)
AxesSubplot
g = sns.boxplot(x="Region", 
                y="Birthrate", 
                data=gdp_data)

g.set_title("New Title", y=1.03)
Giới thiệu trực quan dữ liệu với Seaborn

Tiêu đề cho subplot

g = sns.catplot(x="Region", 
                y="Birthrate", 
                data=gdp_data, 
                kind="box",
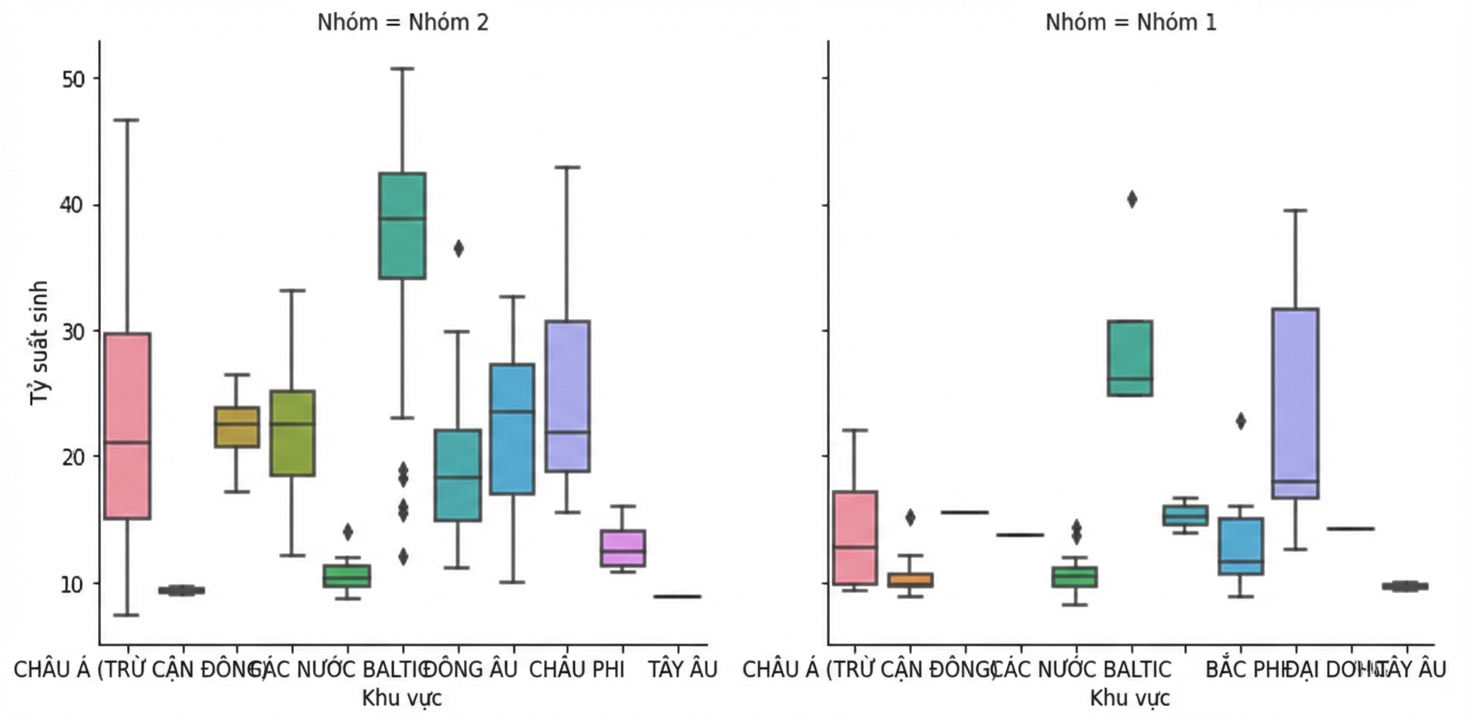
                col="Group") 

Biểu đồ hộp tỷ lệ sinh theo nhóm

Giới thiệu trực quan dữ liệu với Seaborn

Tiêu đề cho subplot

g = sns.catplot(x="Region", 
                y="Birthrate", 
                data=gdp_data, 
                kind="box",
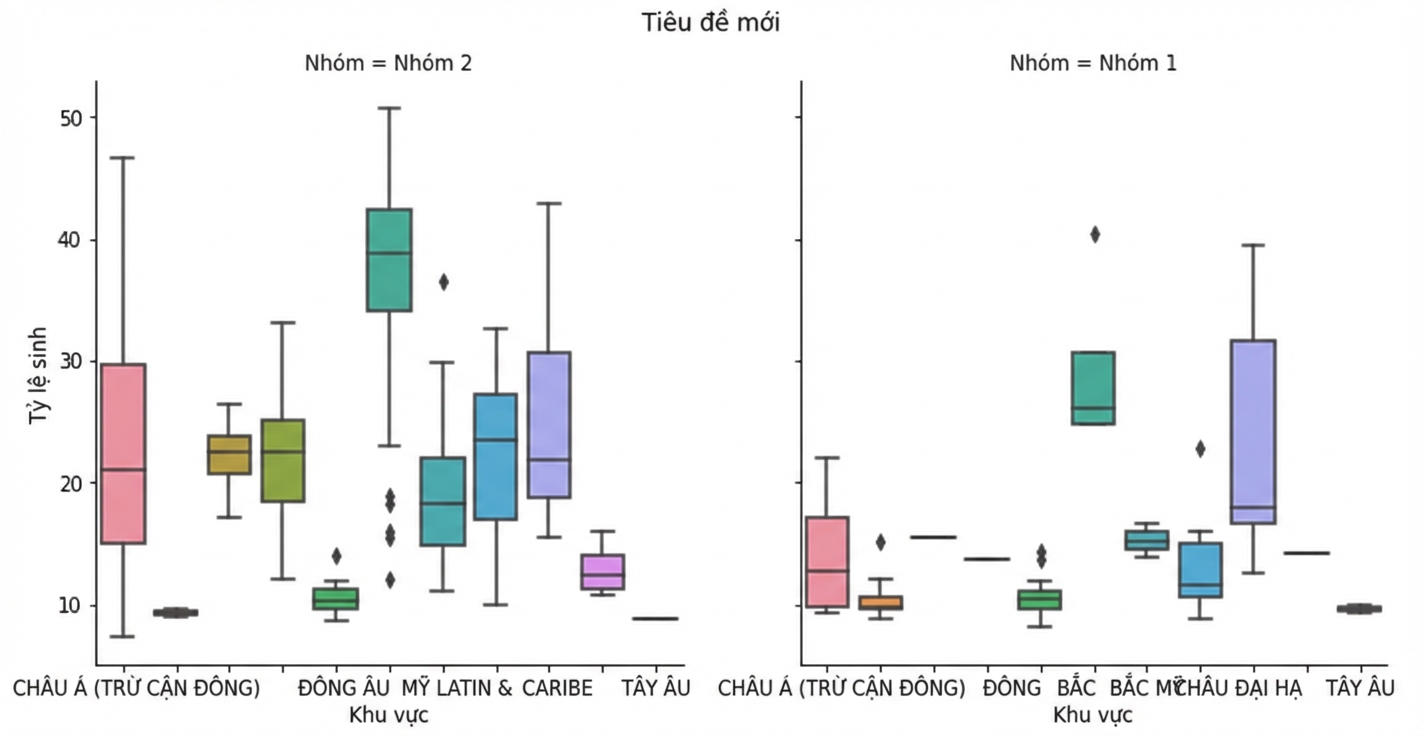
                col="Group") 

g.figure.suptitle("New Title", y=1.03)

Biểu đồ hộp tỷ lệ sinh theo nhóm với tiêu đề hình

Giới thiệu trực quan dữ liệu với Seaborn

Tiêu đề cho subplot

g = sns.catplot(x="Region", 
                y="Birthrate", 
                data=gdp_data, 
                kind="box",
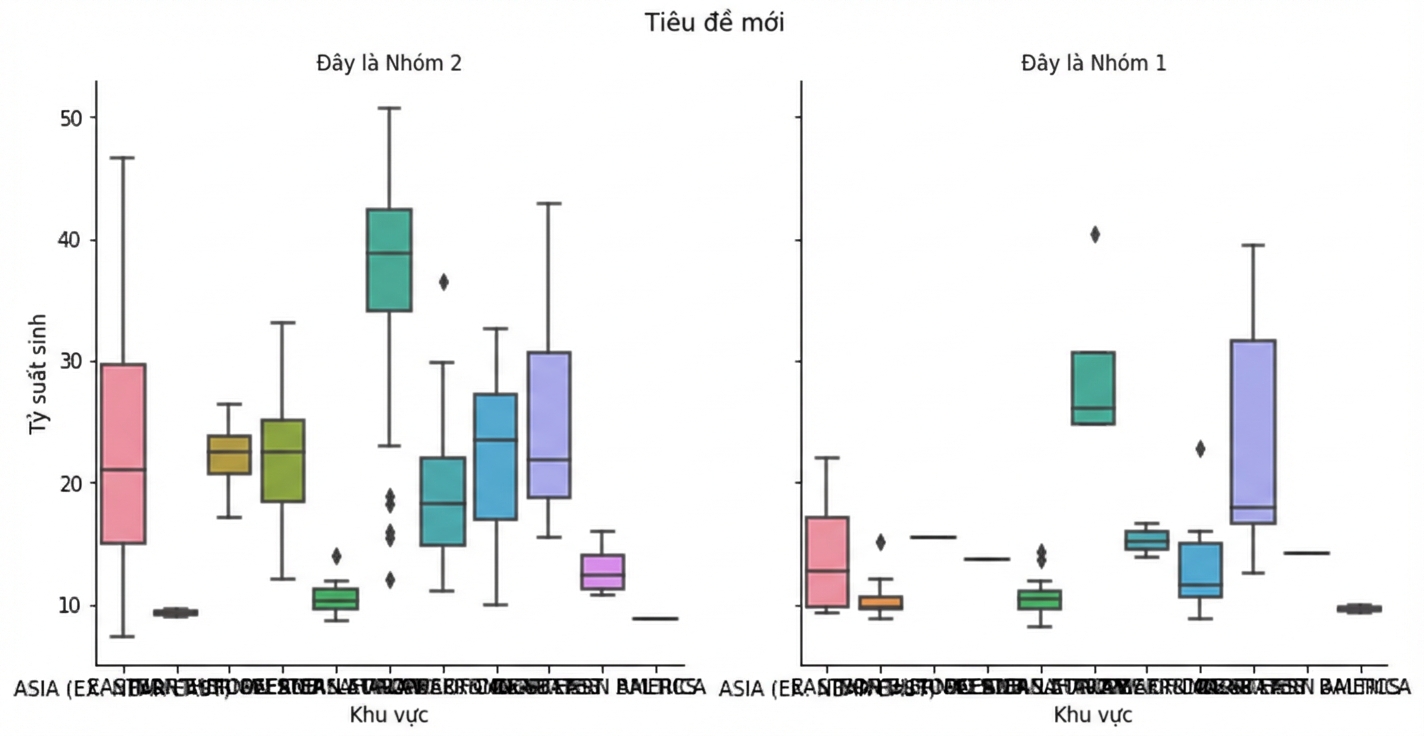
                col="Group") 

g.figure.suptitle("New Title", 
               y=1.03)

g.set_titles("This is {col_name}")

Biểu đồ hộp tỷ lệ sinh theo nhóm với tiêu đề từng ô

Giới thiệu trực quan dữ liệu với Seaborn

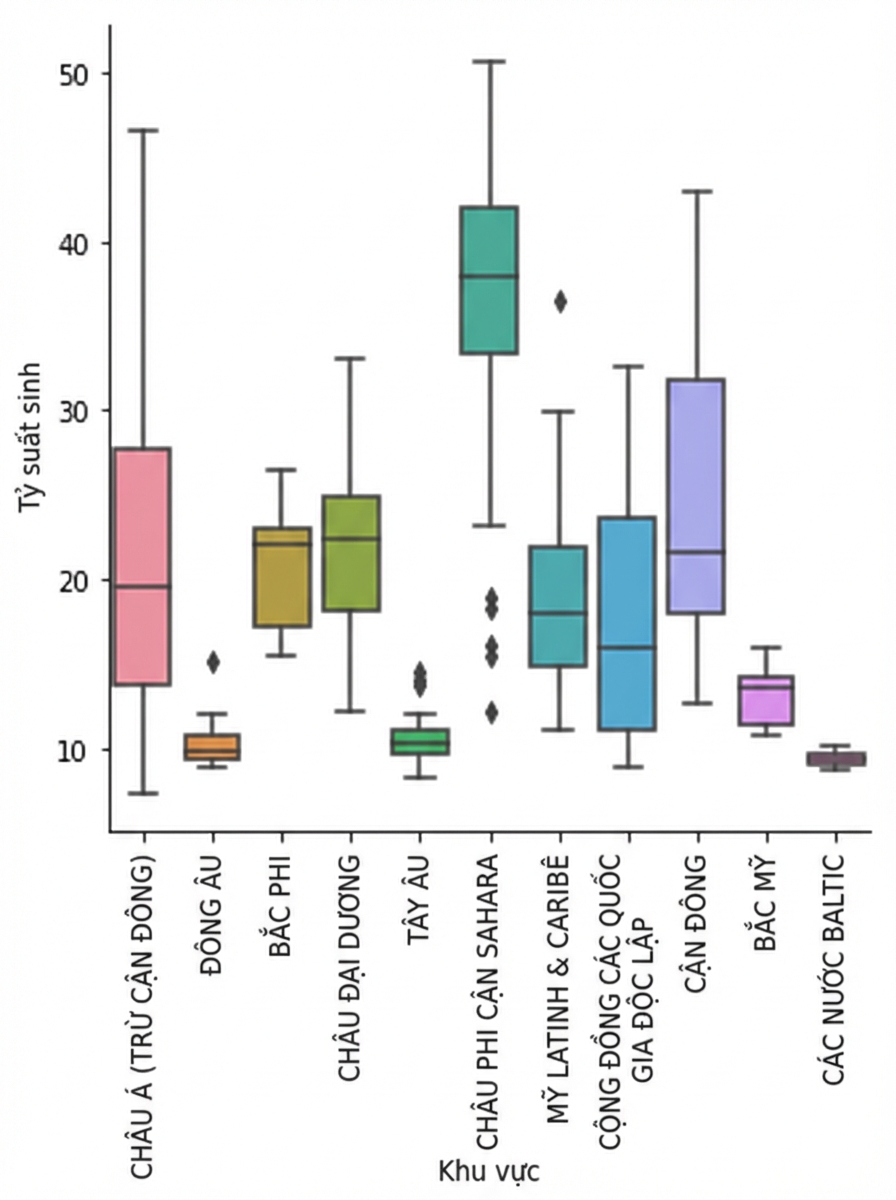
Thêm nhãn trục

g = sns.catplot(x="Region", 
                y="Birthrate", 
                data=gdp_data, 
                kind="box")
`

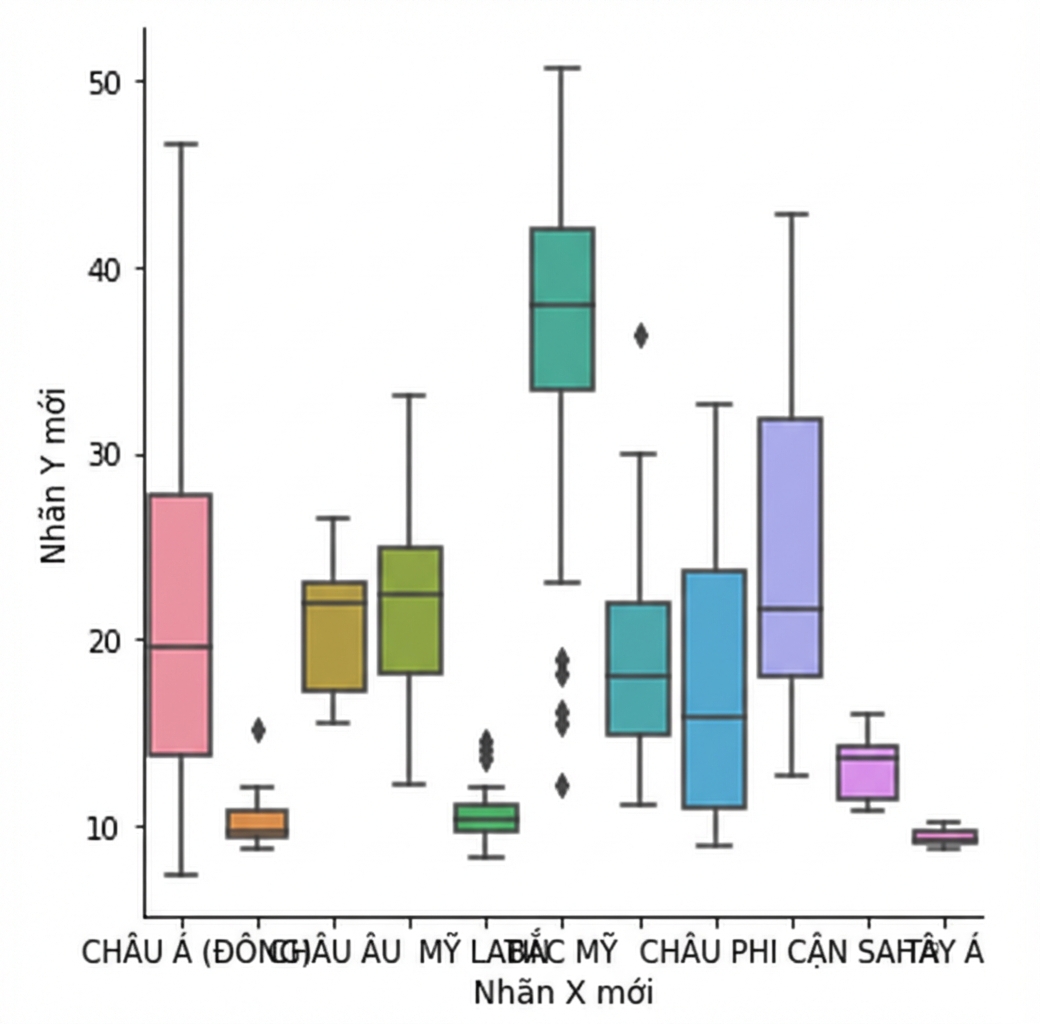
g.set(xlabel="New X Label", ylabel="New Y Label")
plt.show()

Biểu đồ hộp tỷ lệ sinh với nhãn trục

Giới thiệu trực quan dữ liệu với Seaborn

Xoay nhãn vạch trục x

g = sns.catplot(x="Region", 
                y="Birthrate", 
                data=gdp_data, 
                kind="box")

plt.xticks(rotation=90)
plt.show()

Biểu đồ hộp tỷ lệ sinh với nhãn vạch trục x xoay

Giới thiệu trực quan dữ liệu với Seaborn

Ayo berlatih!

Giới thiệu trực quan dữ liệu với Seaborn

Preparing Video For Download...