Hàm là gì?
Nhập môn Khoa học Dữ liệu với Python

Hillary Green-Lerman
Lead Data Scientist, Looker
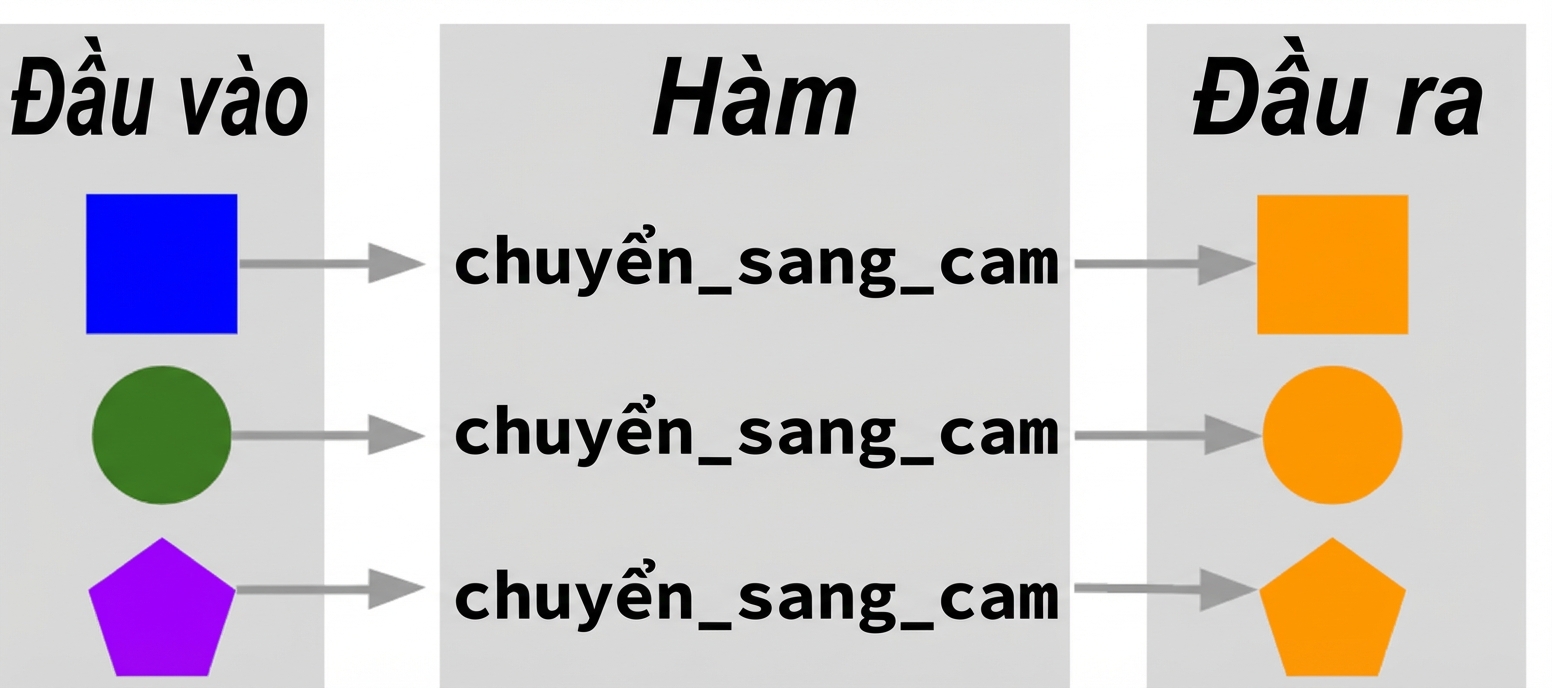
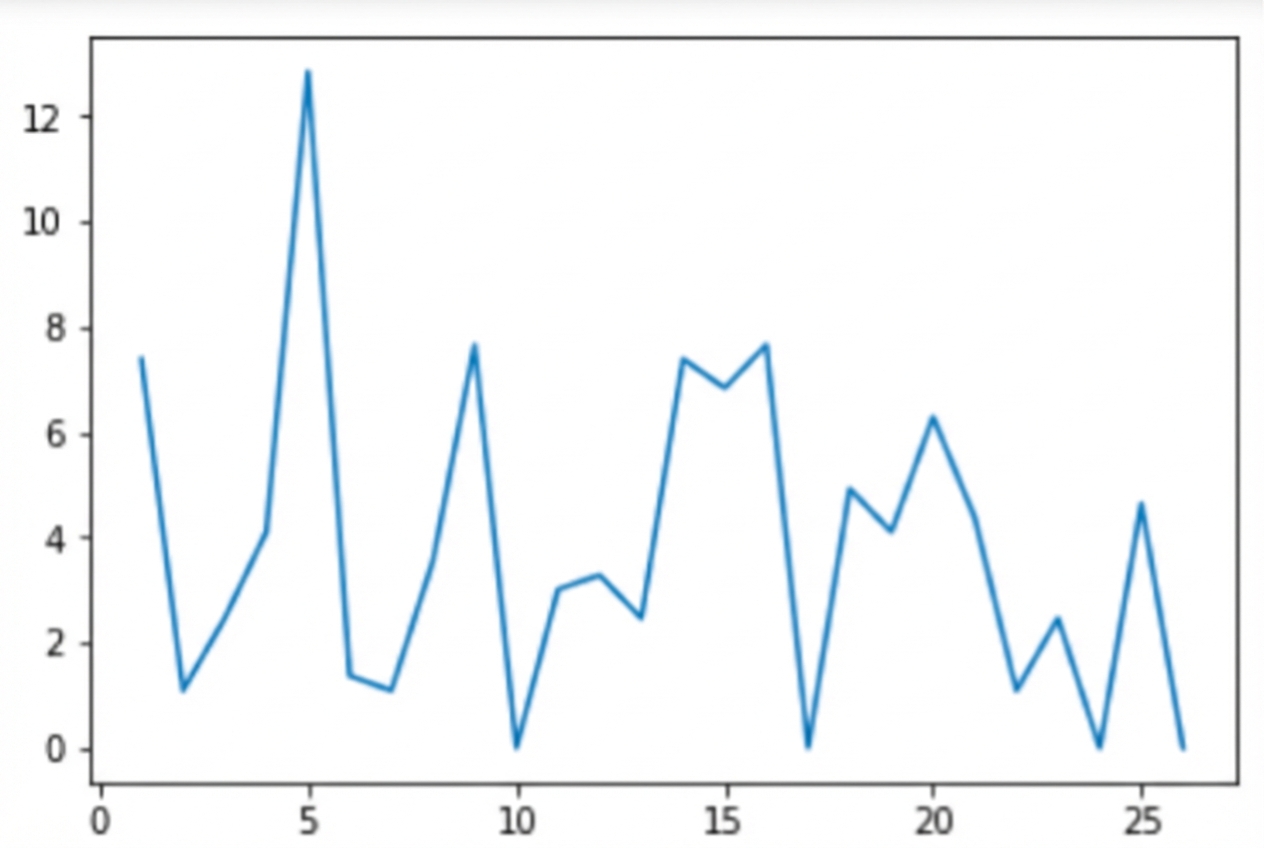
Hàm là một hành động
Cấu trúc hàm: tên hàm
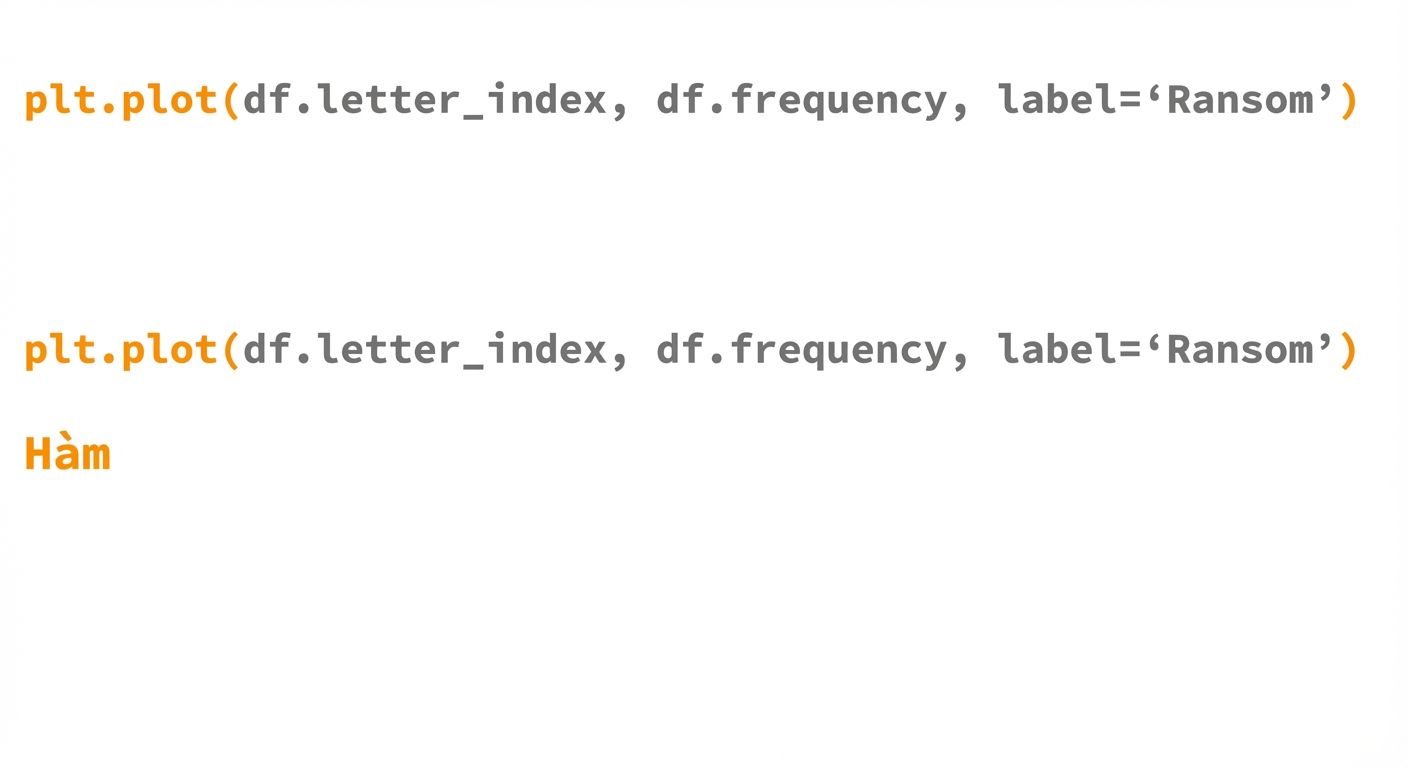
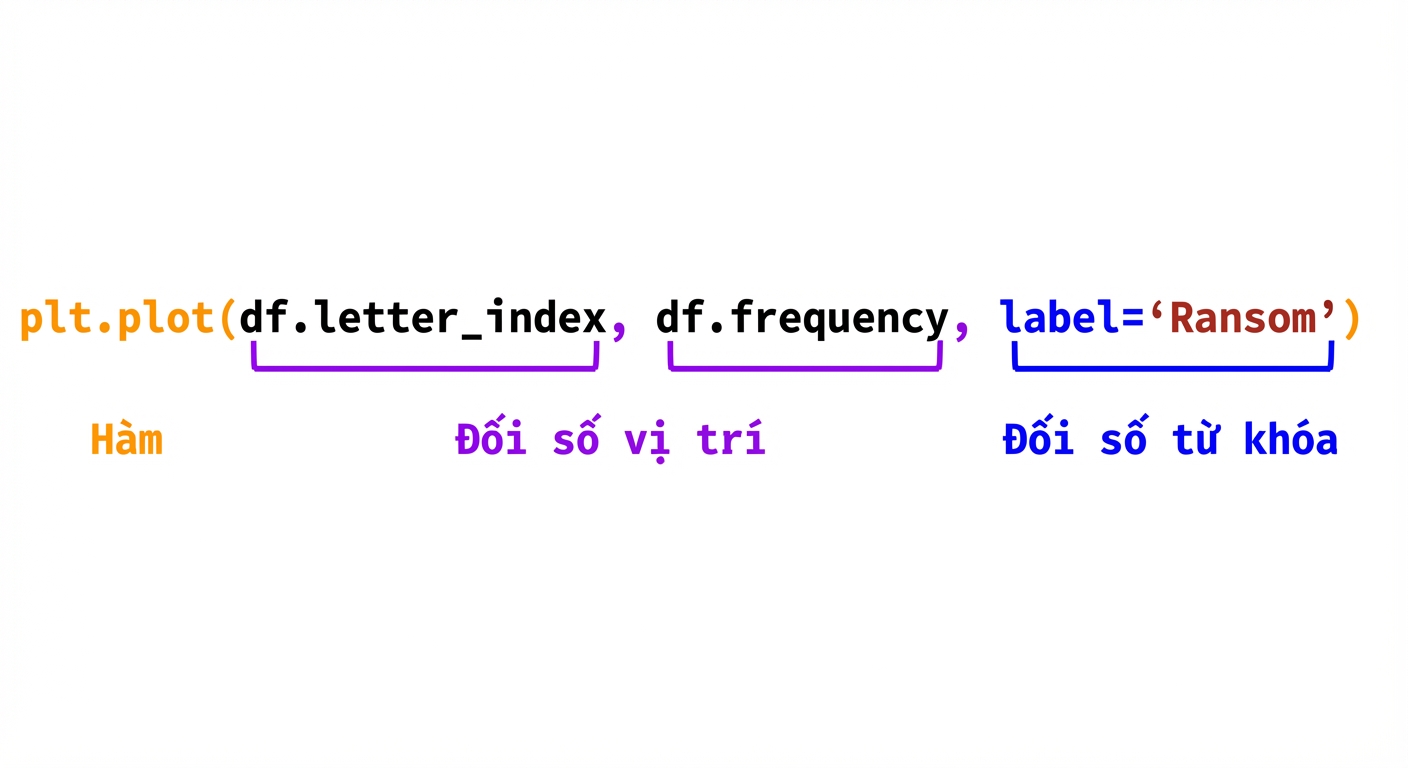
Tên hàm:
- Bắt đầu bằng module chứa hàm (
plt) - Tiếp theo là tên hàm (
plot) - Tên hàm luôn theo sau bởi dấu ngoặc đơn
()
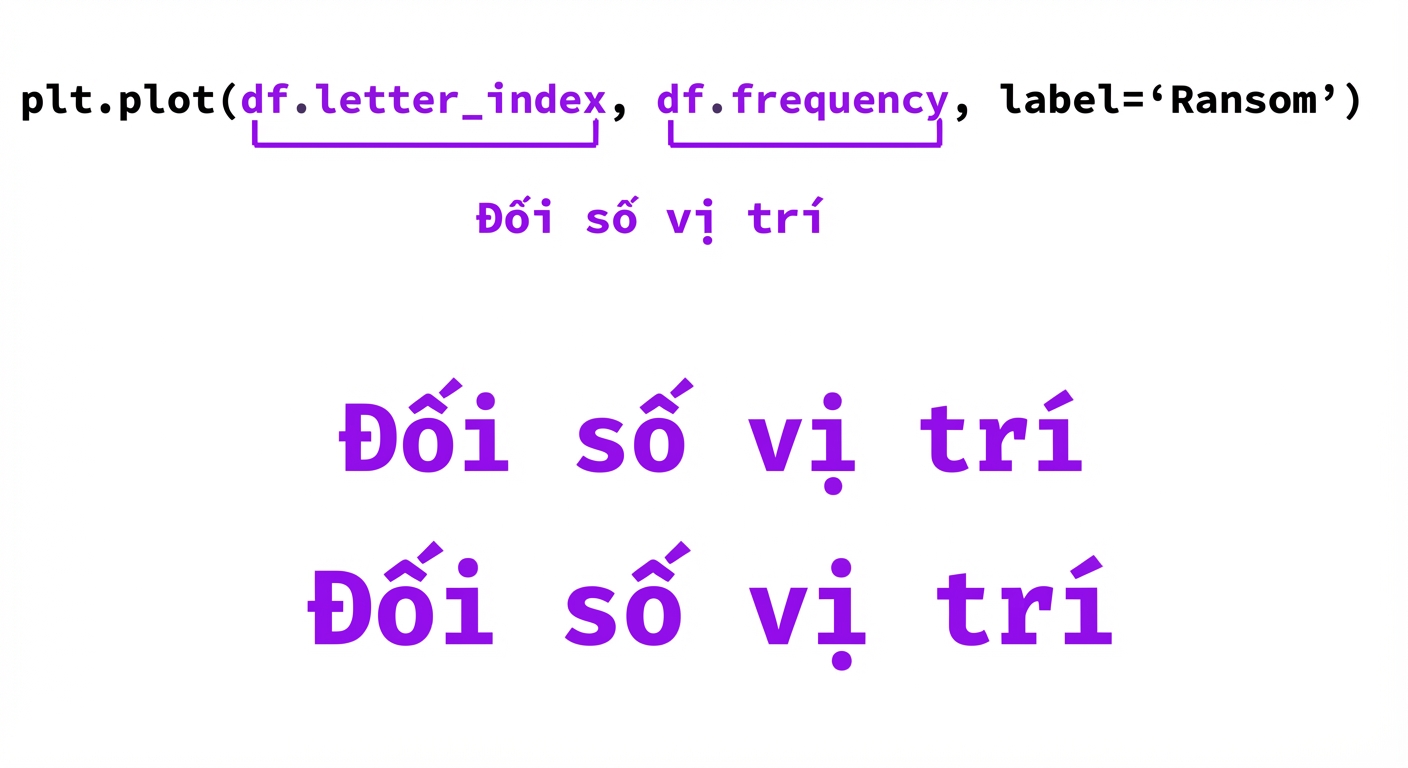
Cấu trúc hàm: đối số vị trí
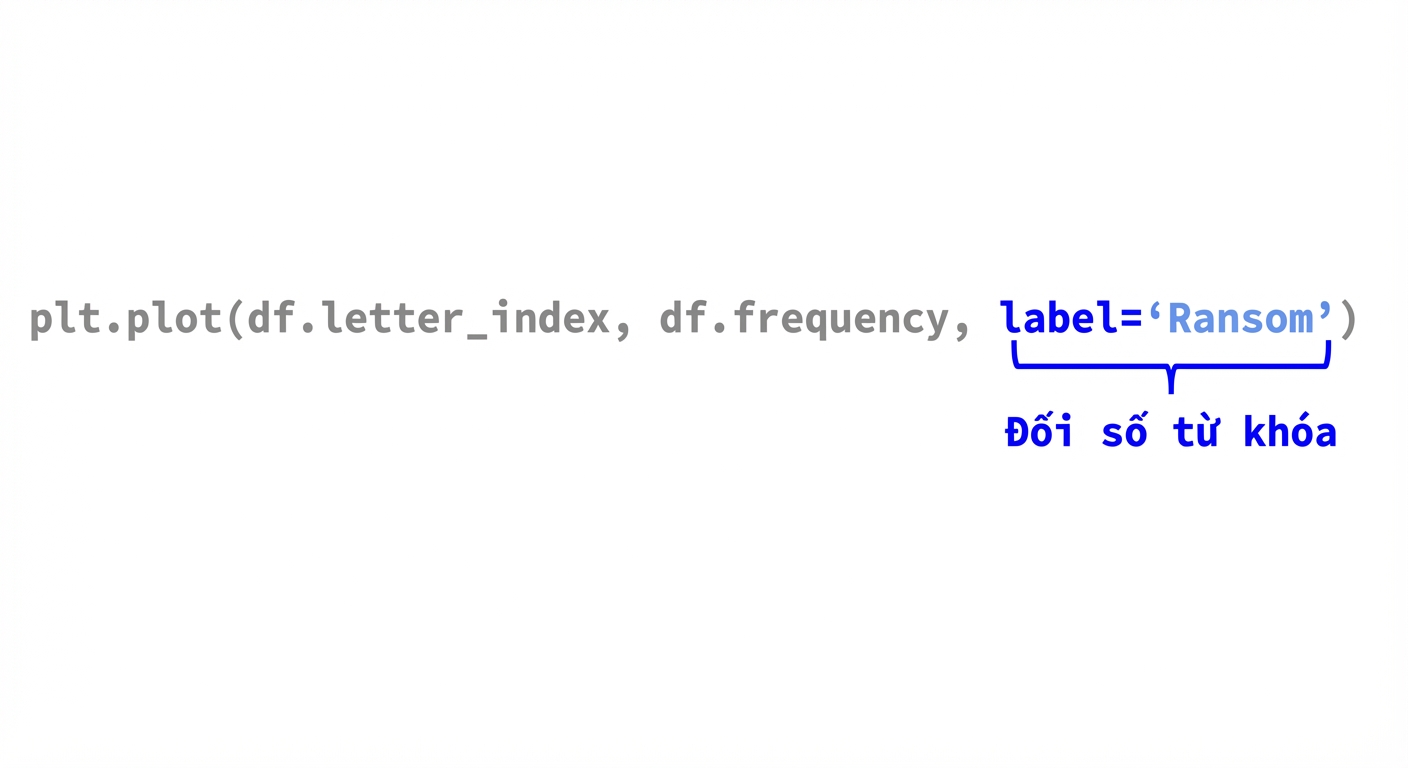
Cấu trúc hàm: đối số từ khóa
Lỗi hàm thường gặp
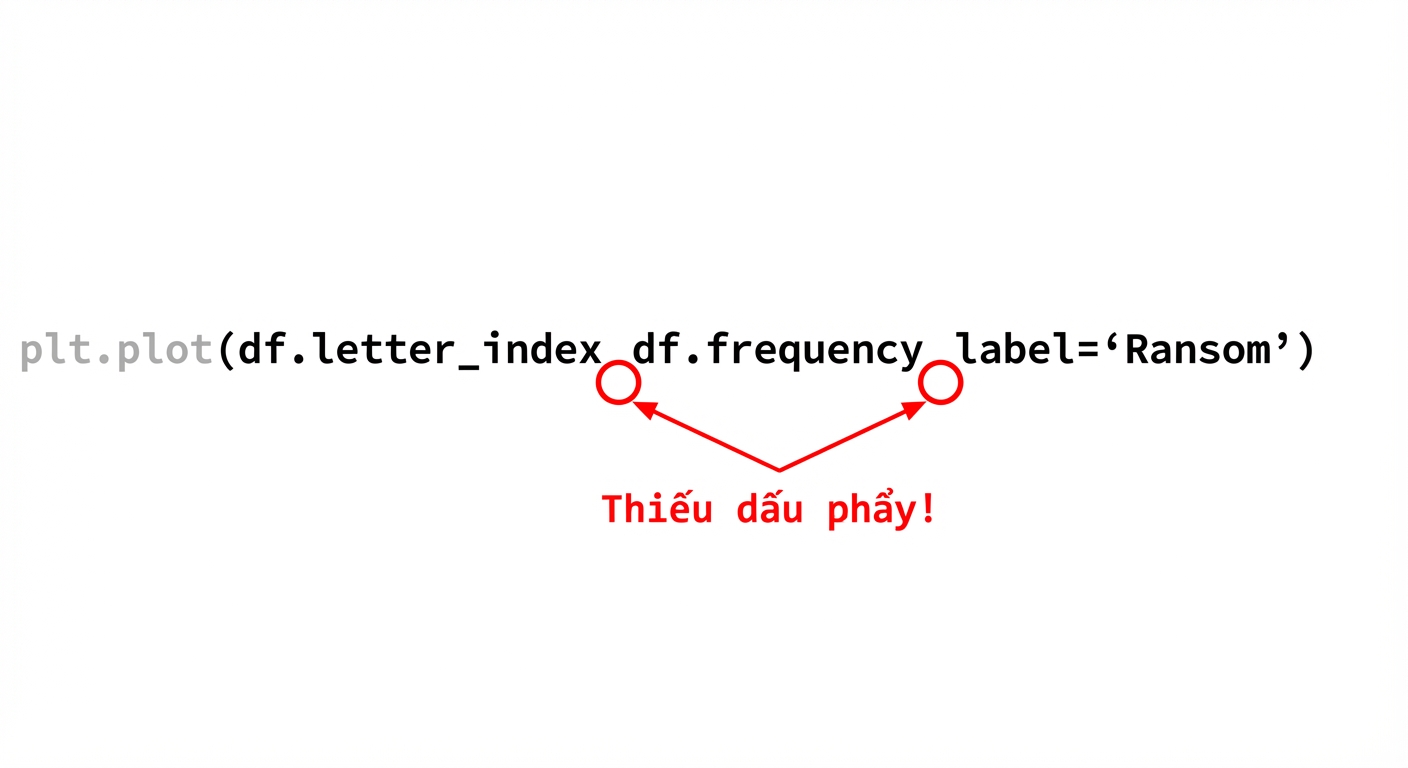
- Thiếu dấu phẩy giữa các đối số
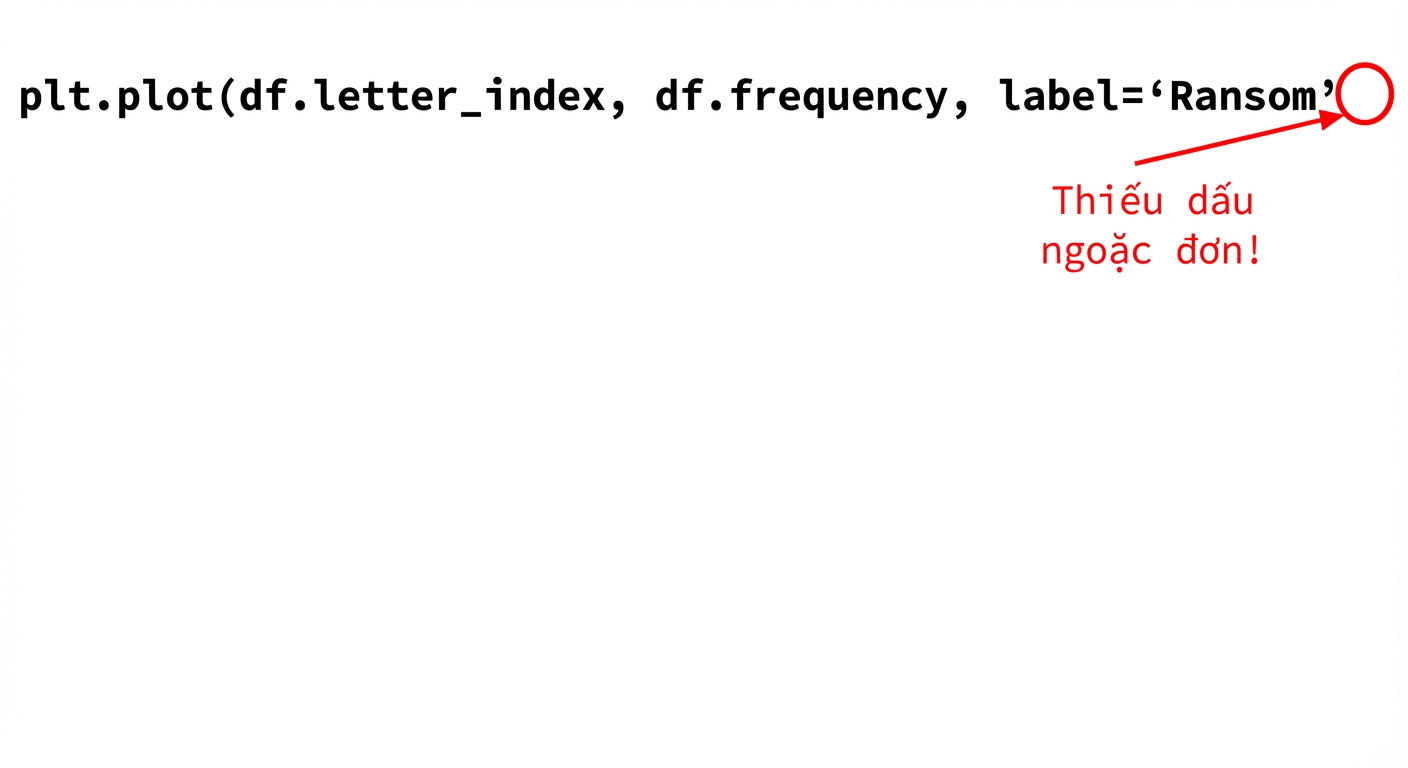
- Thiếu dấu ngoặc đóng