Building CloudWatch dashboards
Monitoring and troubleshooting AWS

John Q. Martin
Principal Consultant
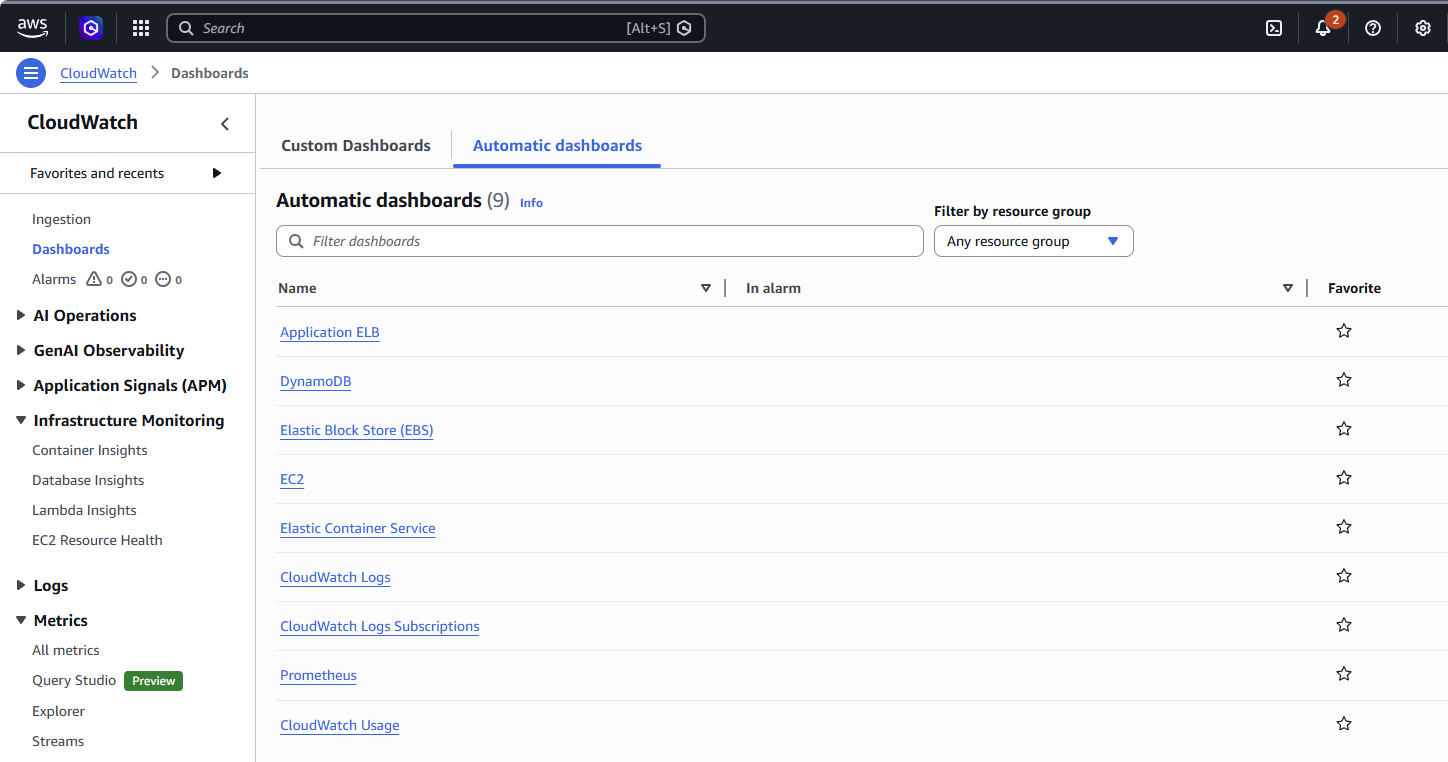
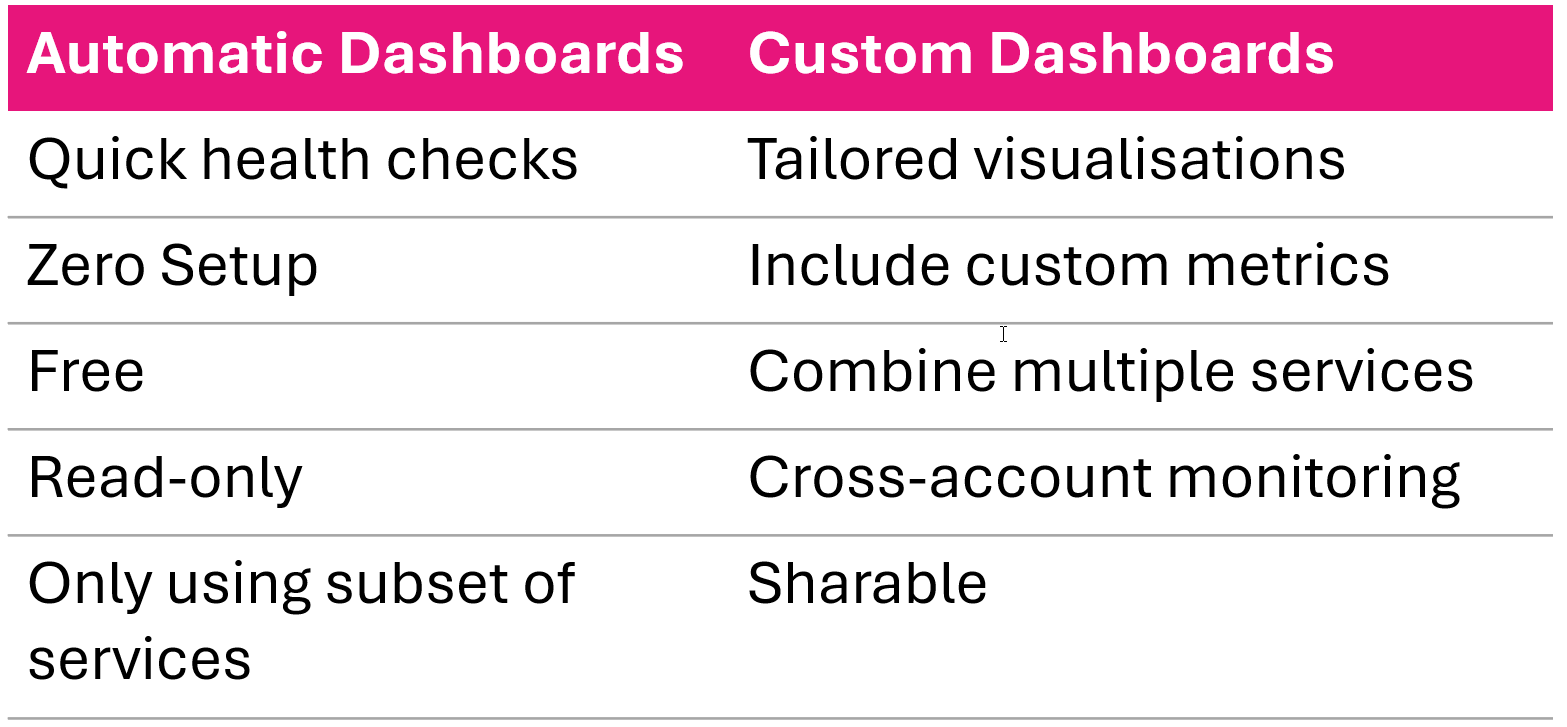
Automatic dashboards
Custom dashboards
When to use automatic vs. custom
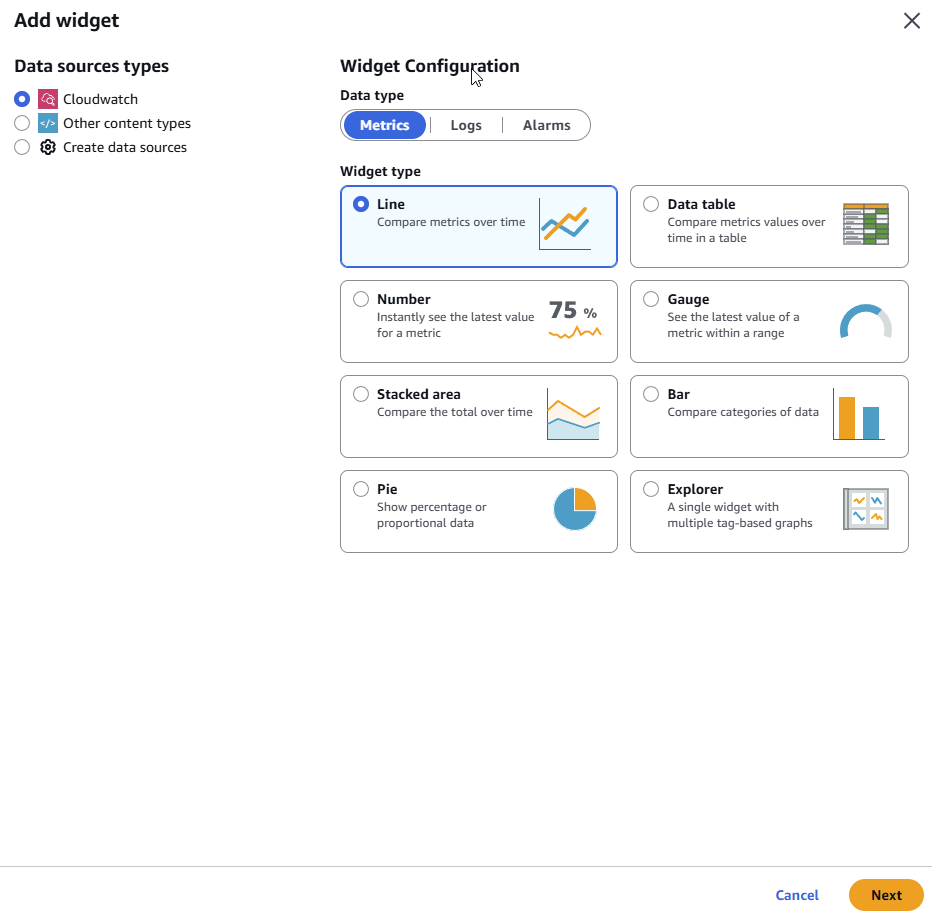
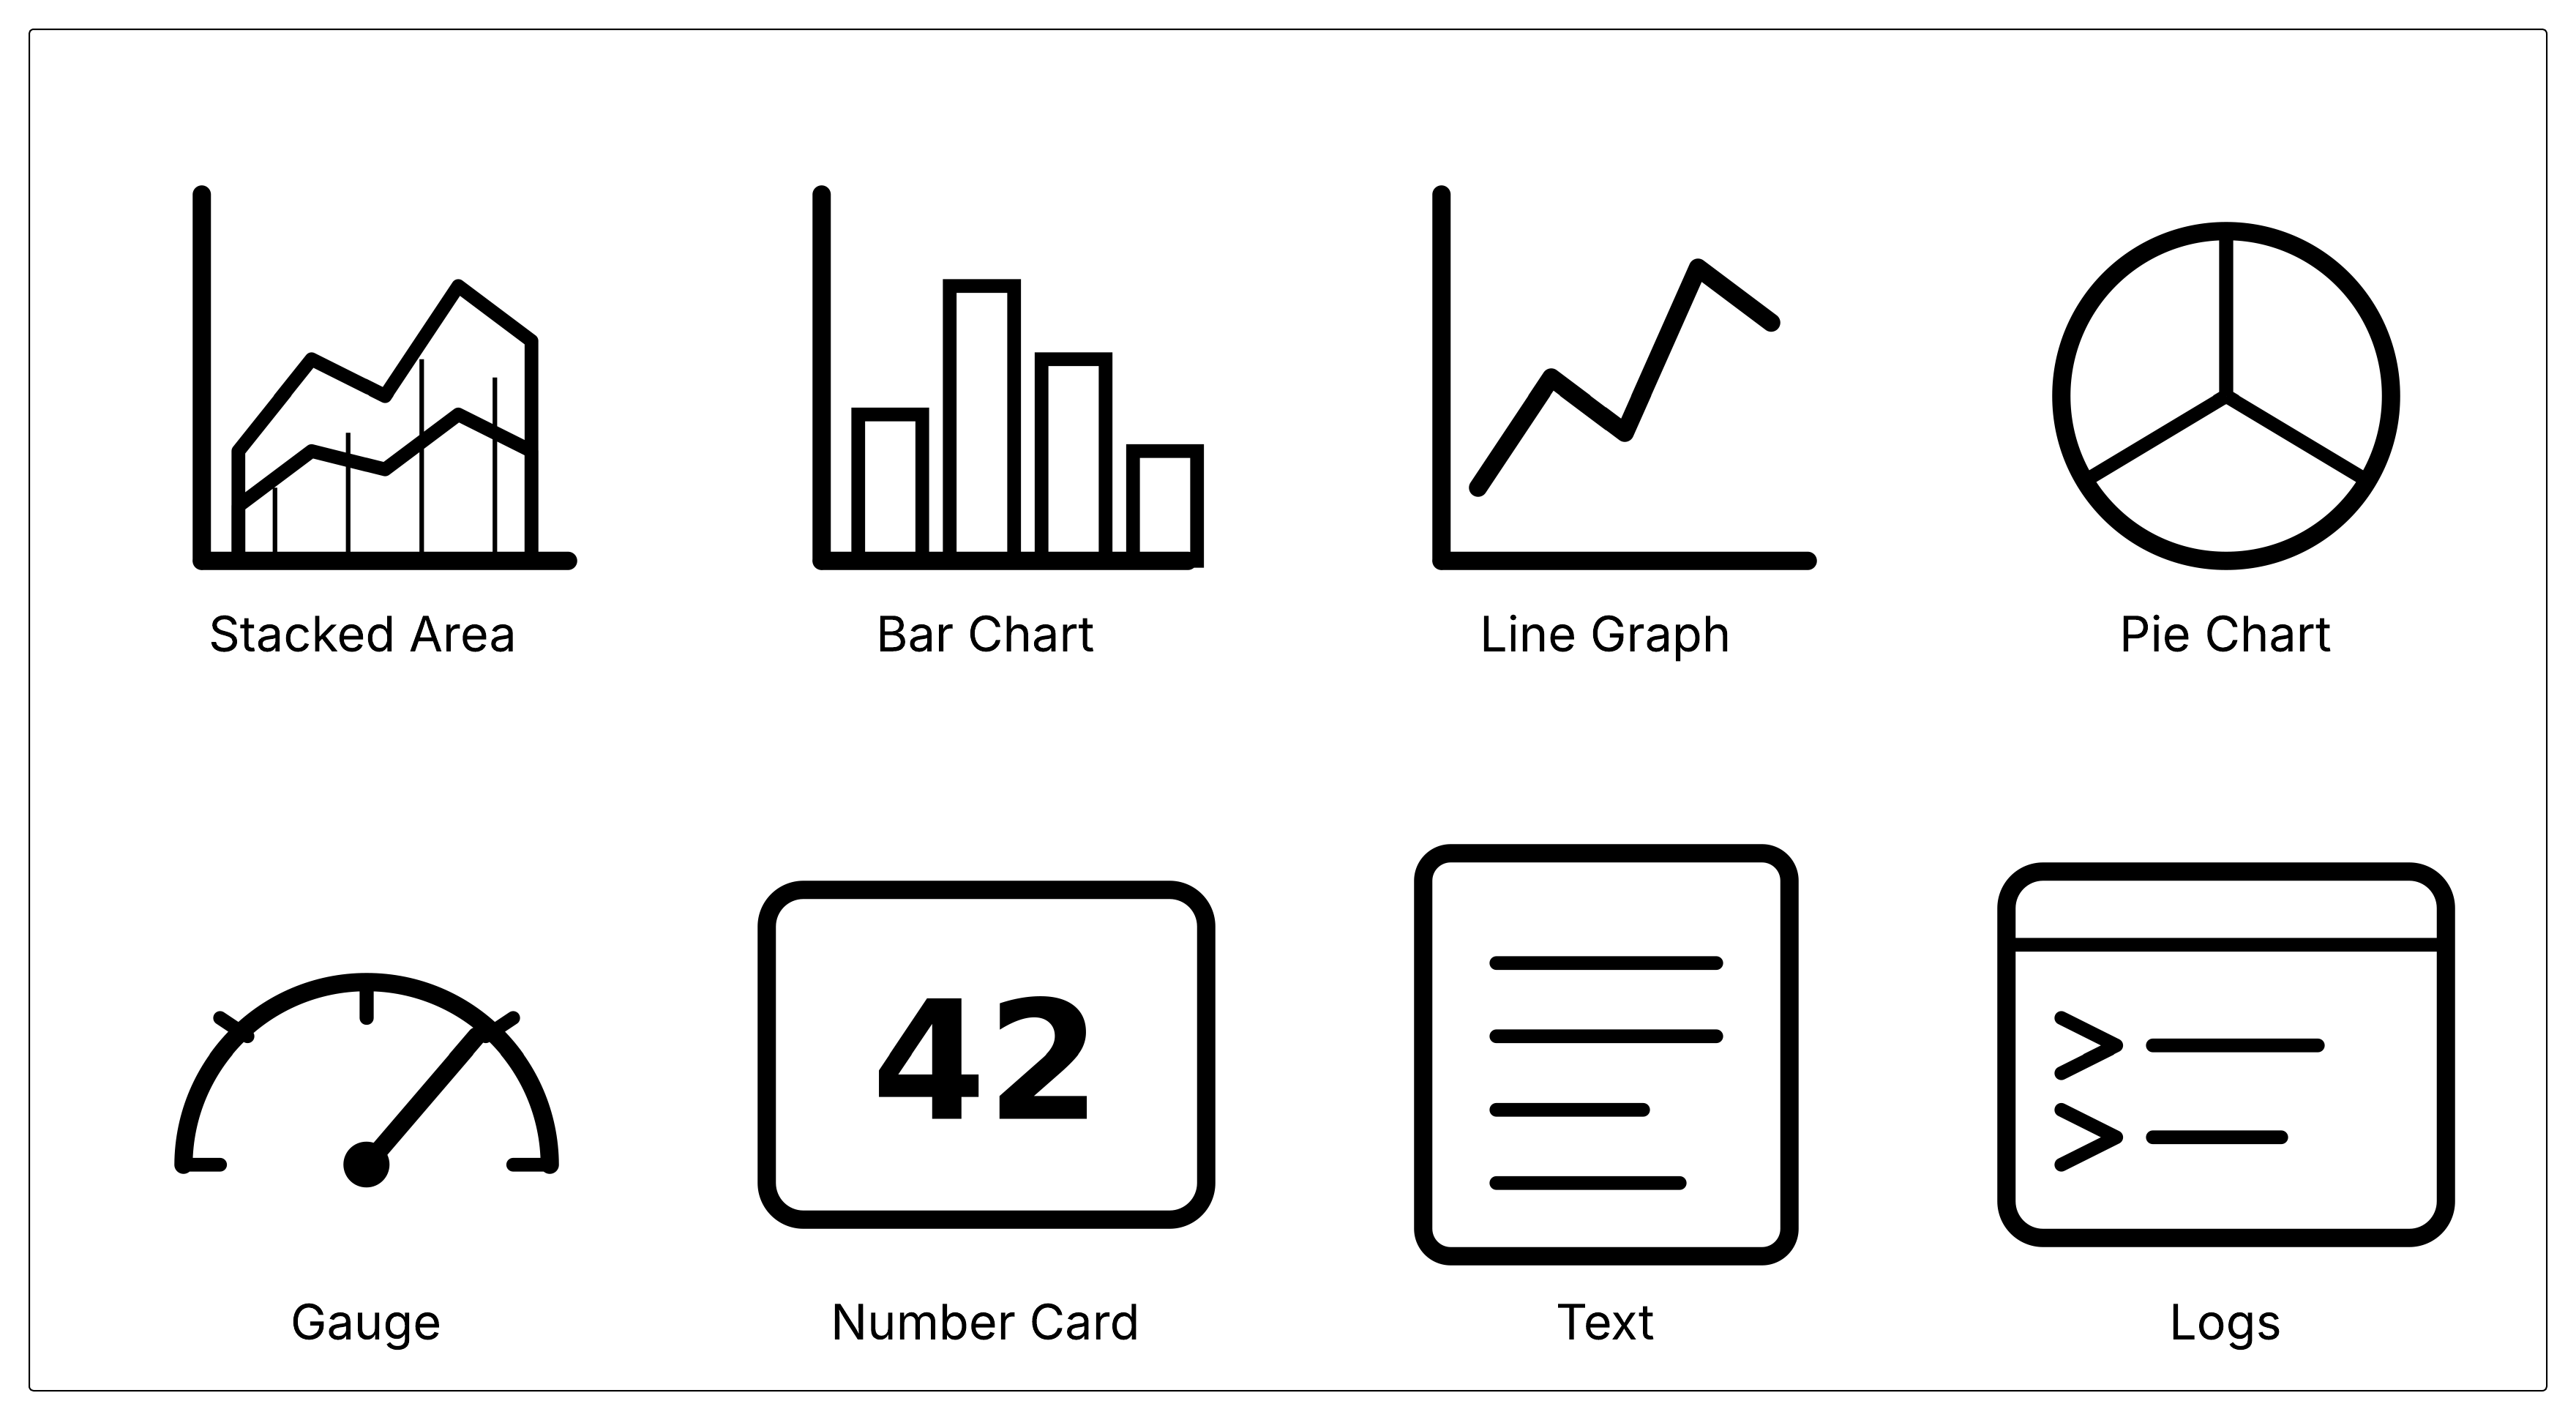
Custom dashboard widgets
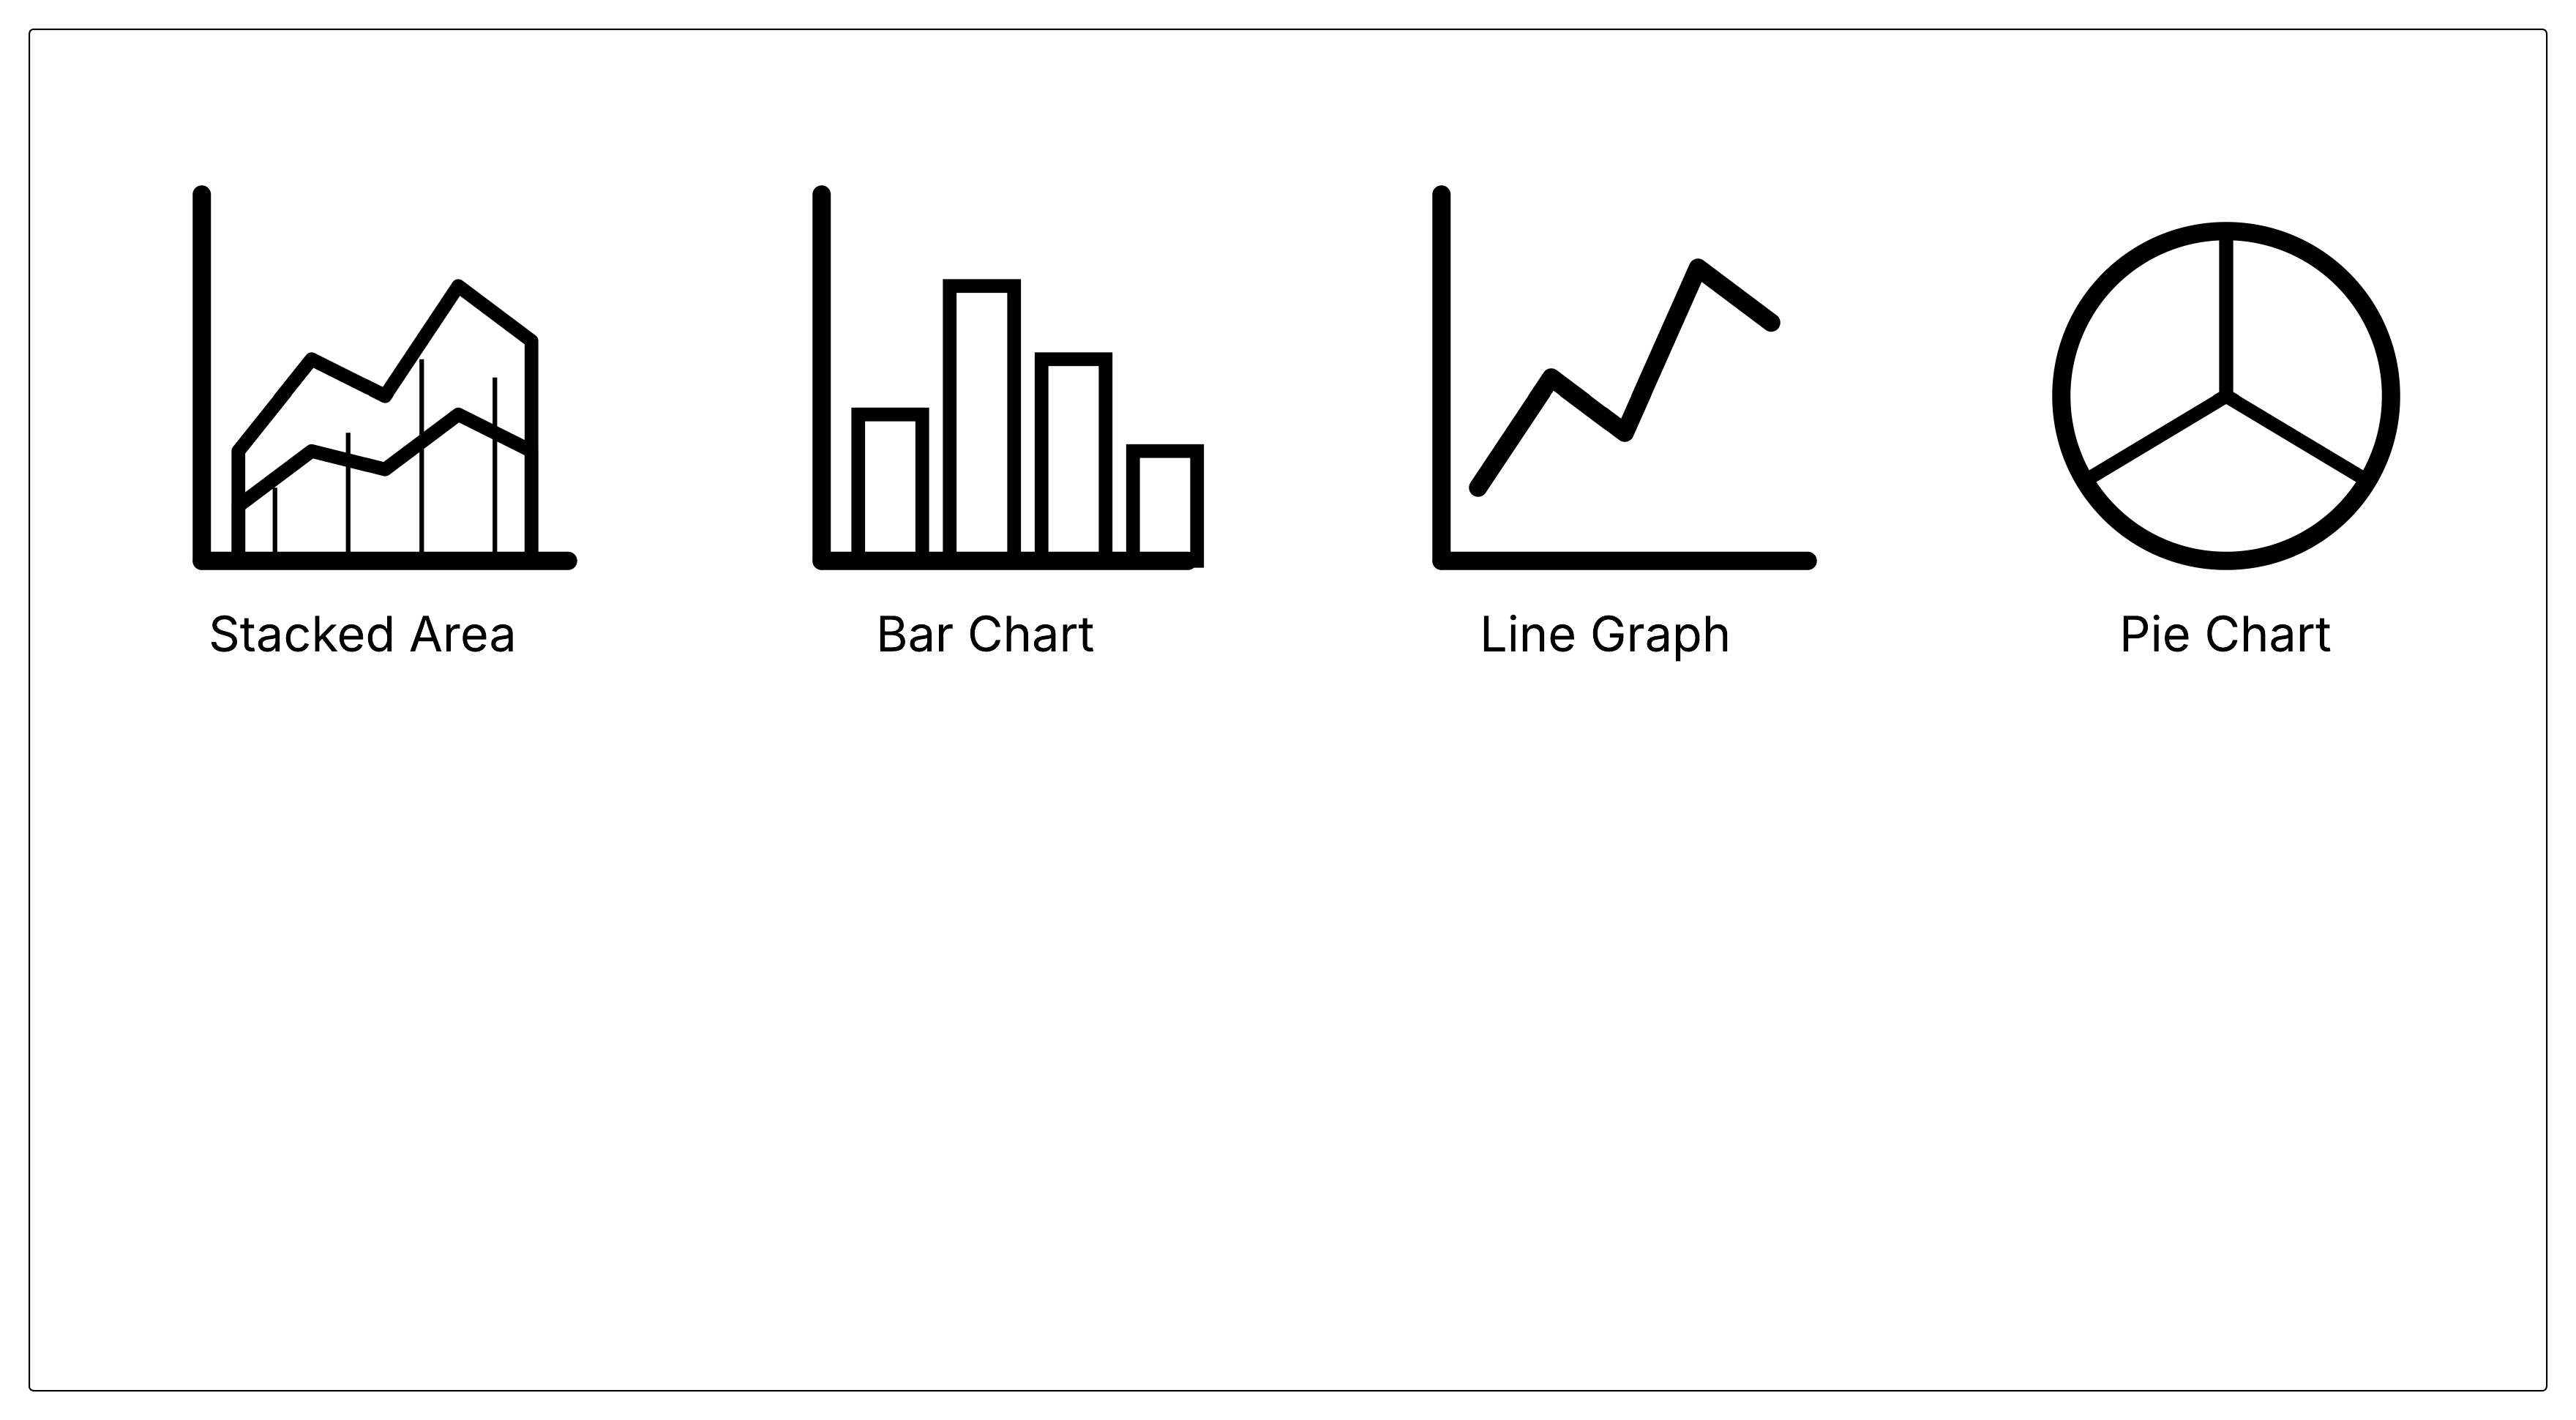
Custom dashboard widgets
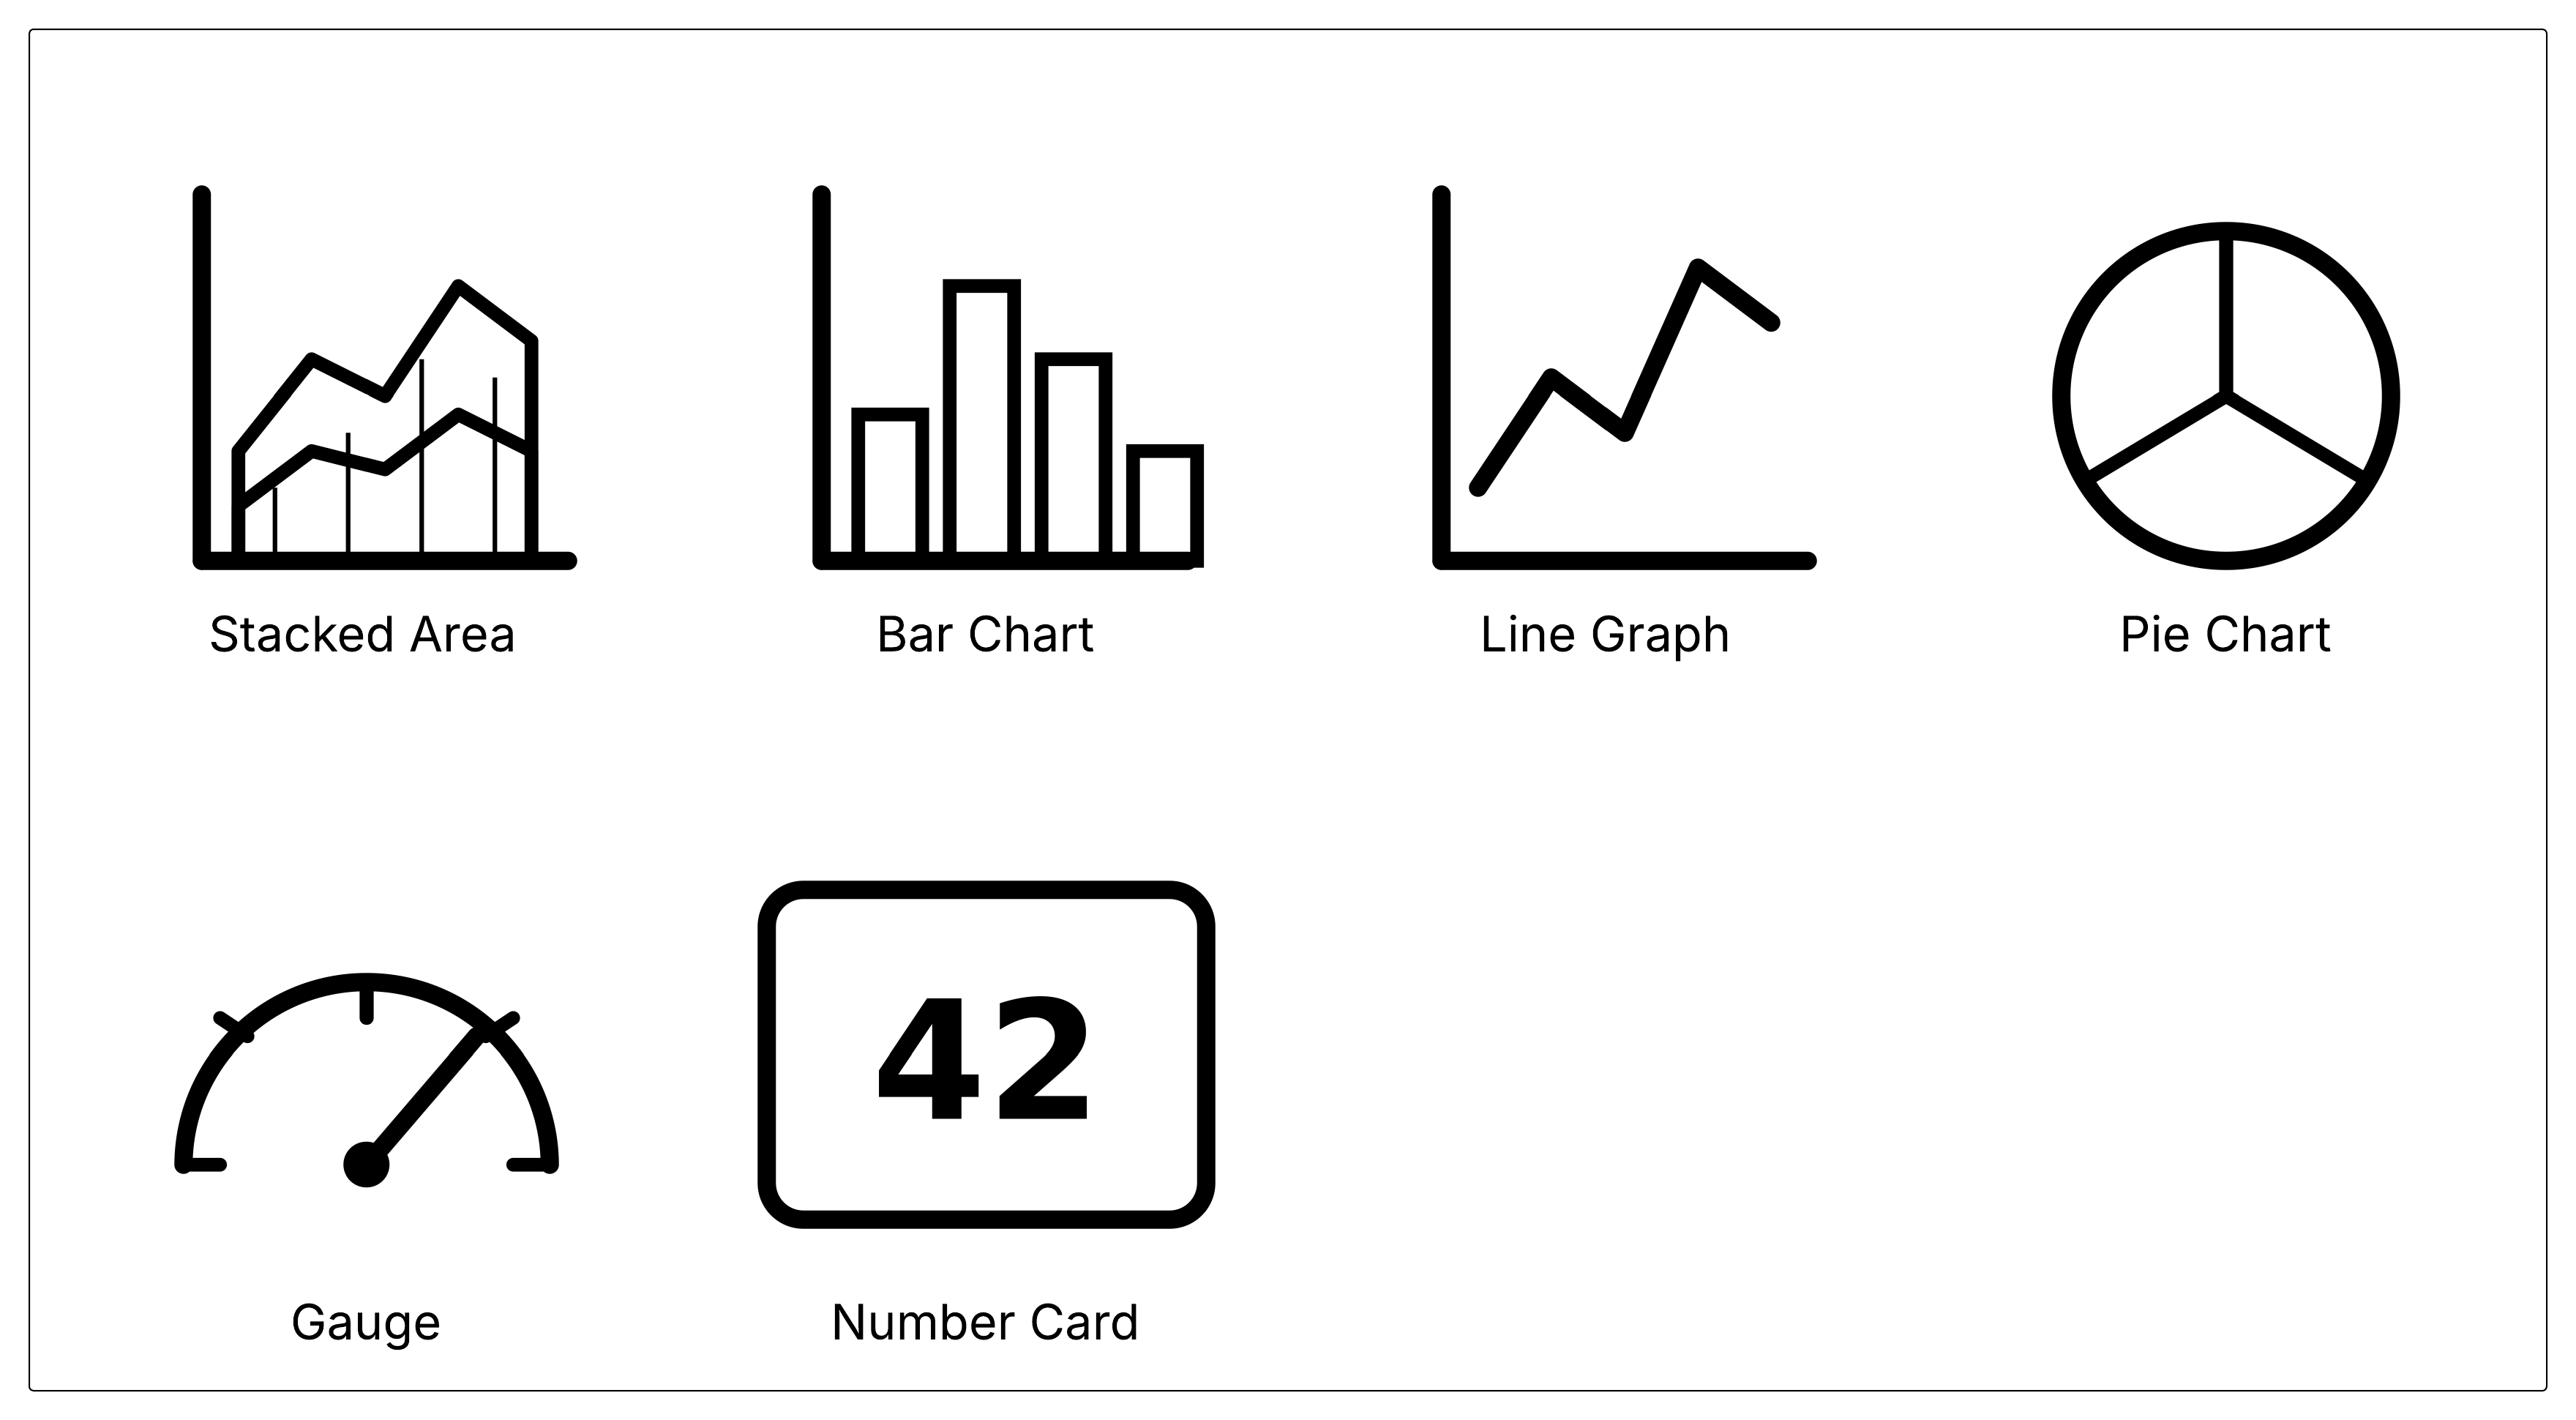
Custom dashboard widgets
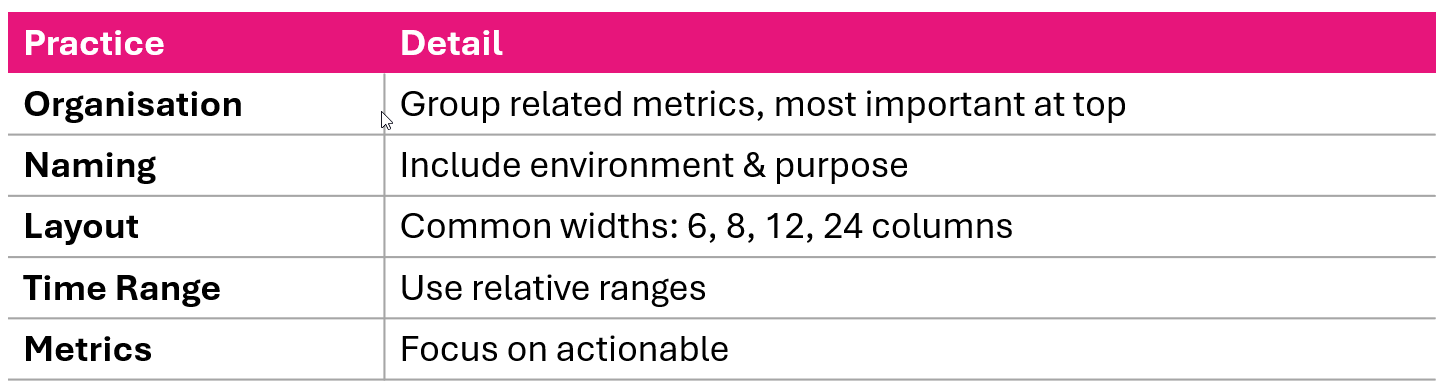
Dashboard design principles
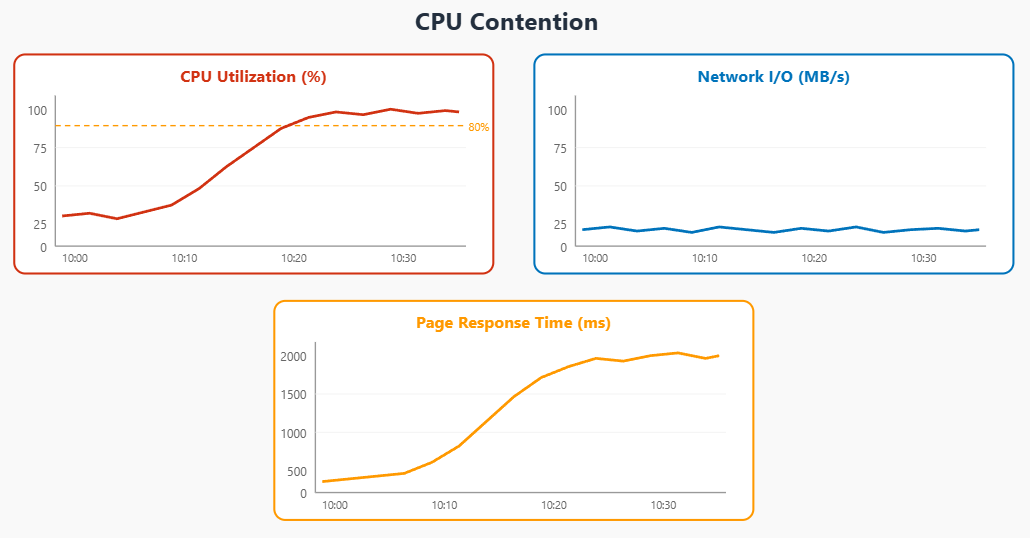
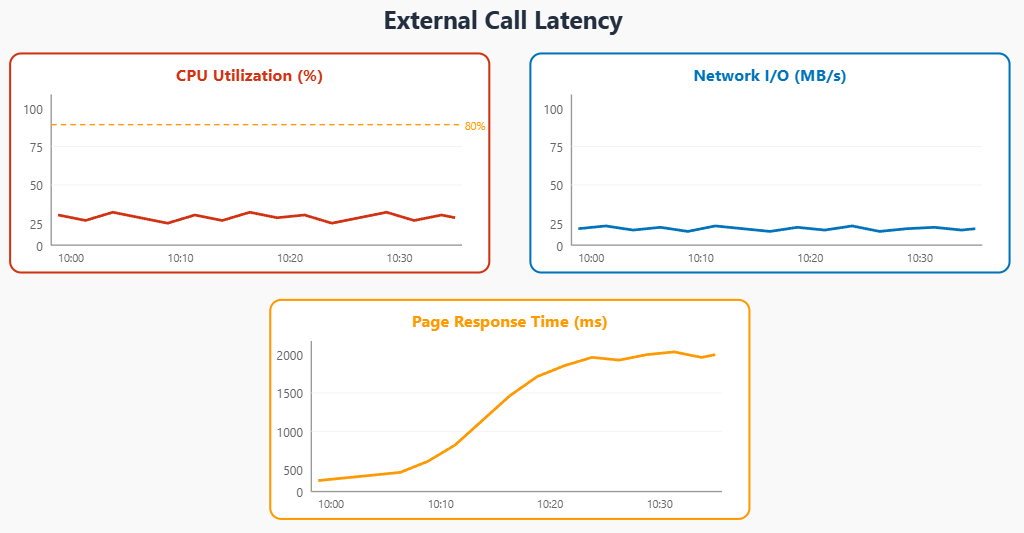
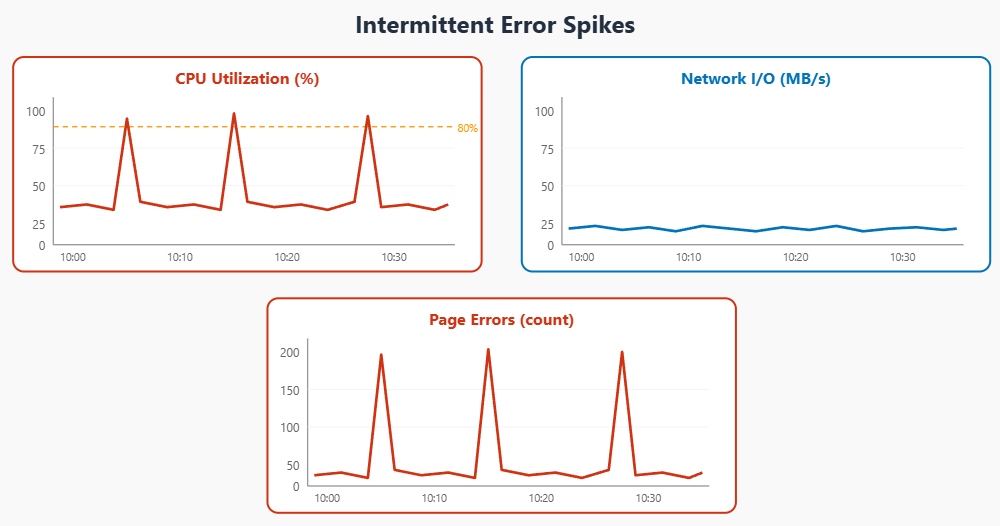
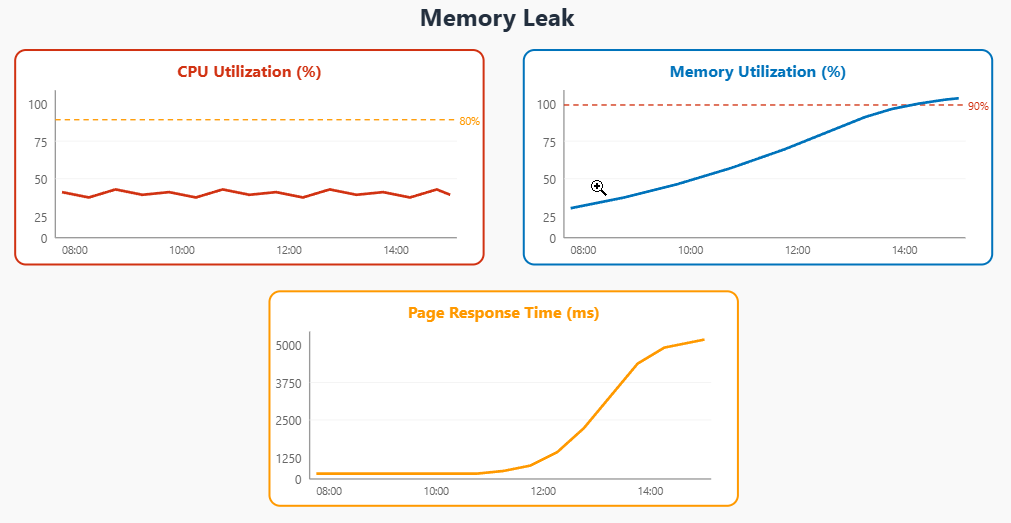
Detecting performance issues
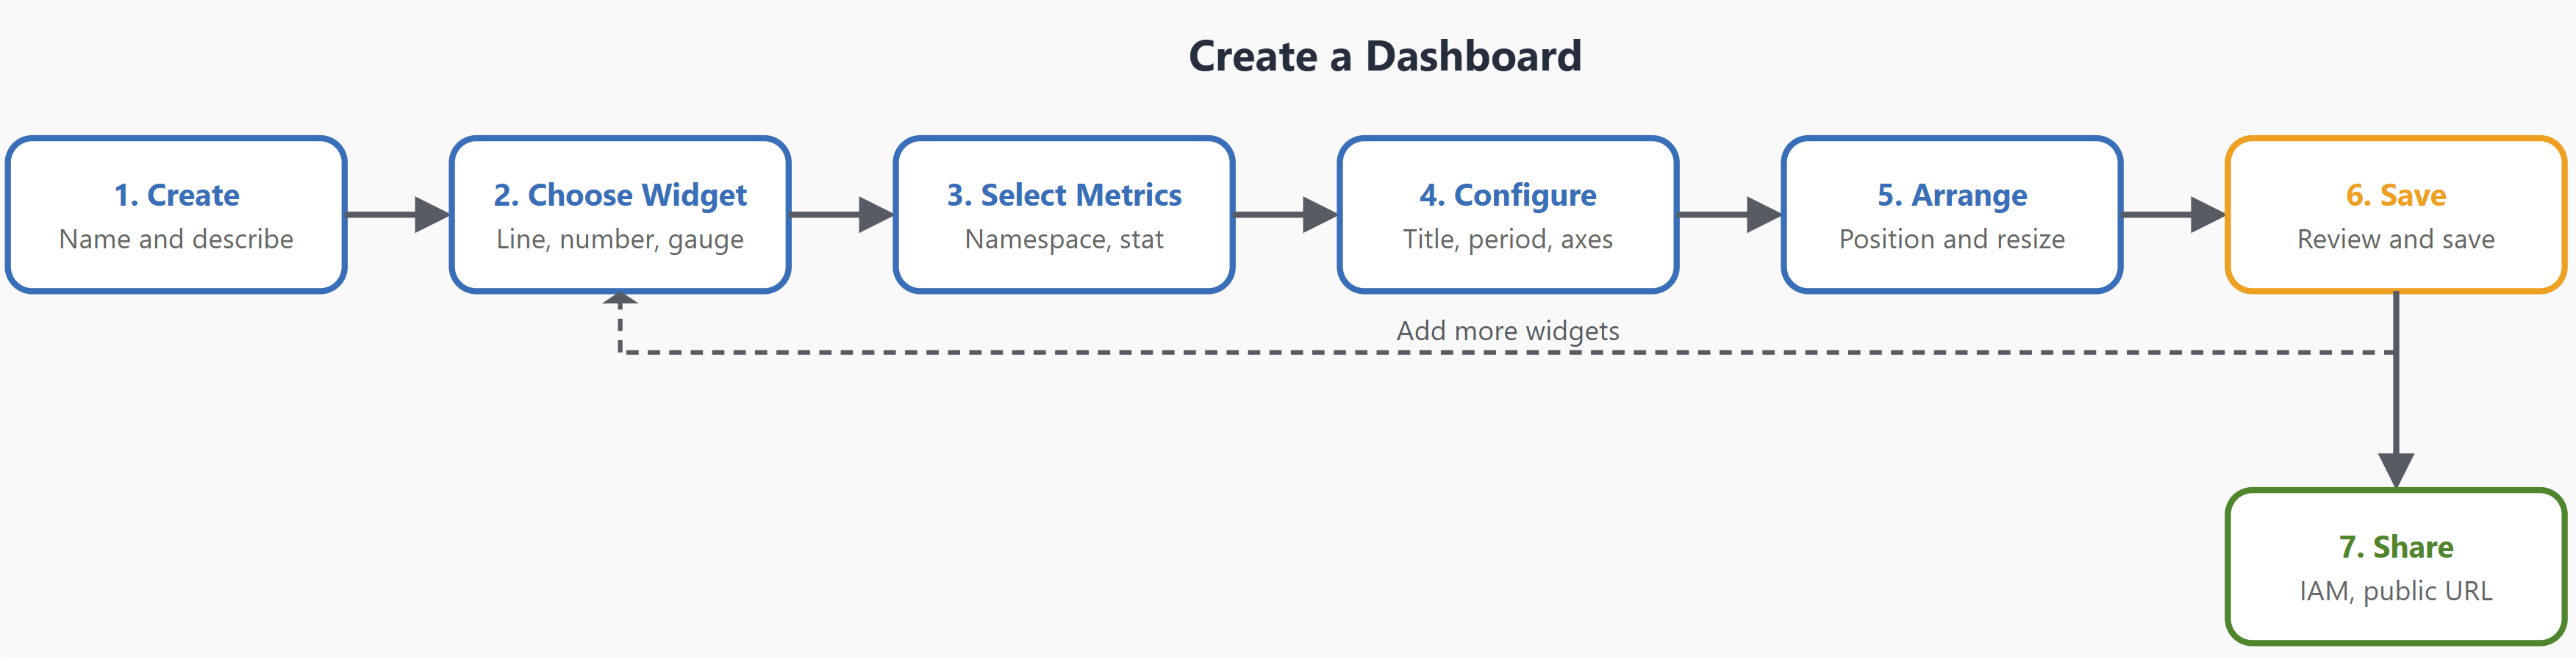
Create a custom dashboard
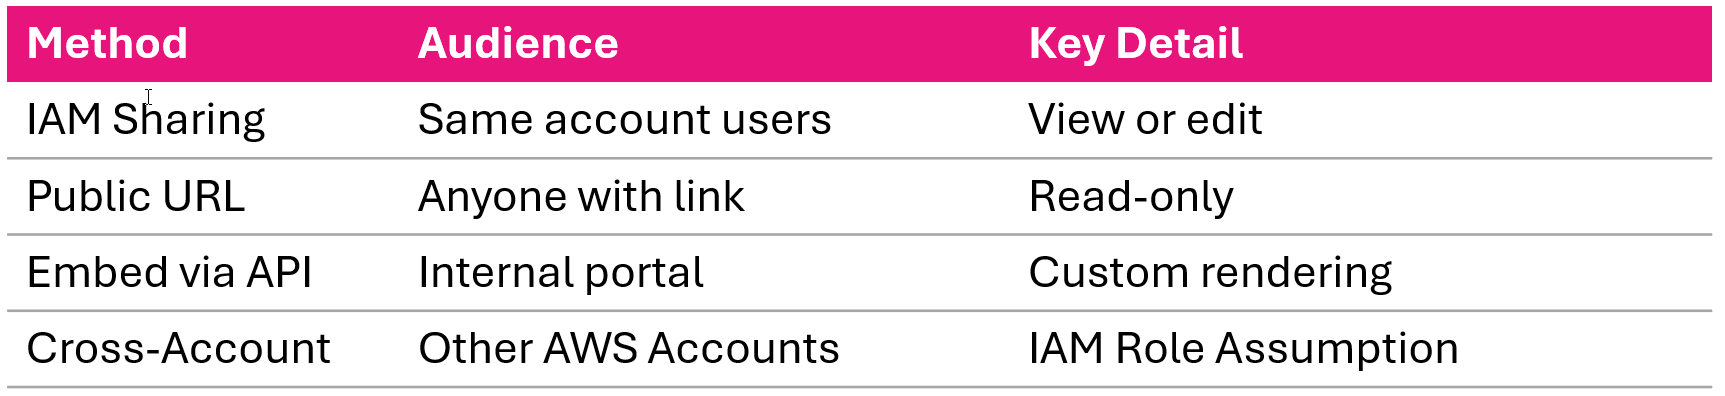
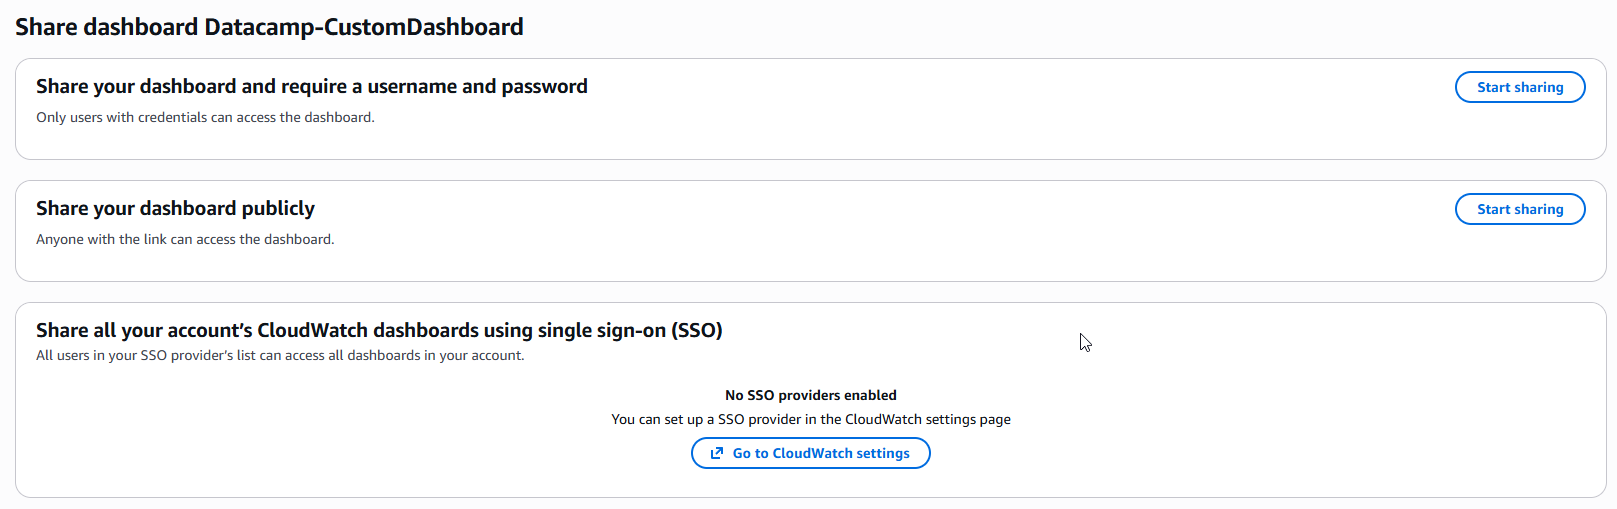
Sharing dashboards with others