Application health dashboards
Monitoring and troubleshooting AWS

John Q. Martin
Principal Consultant
Dashboard design: hierarchy of information
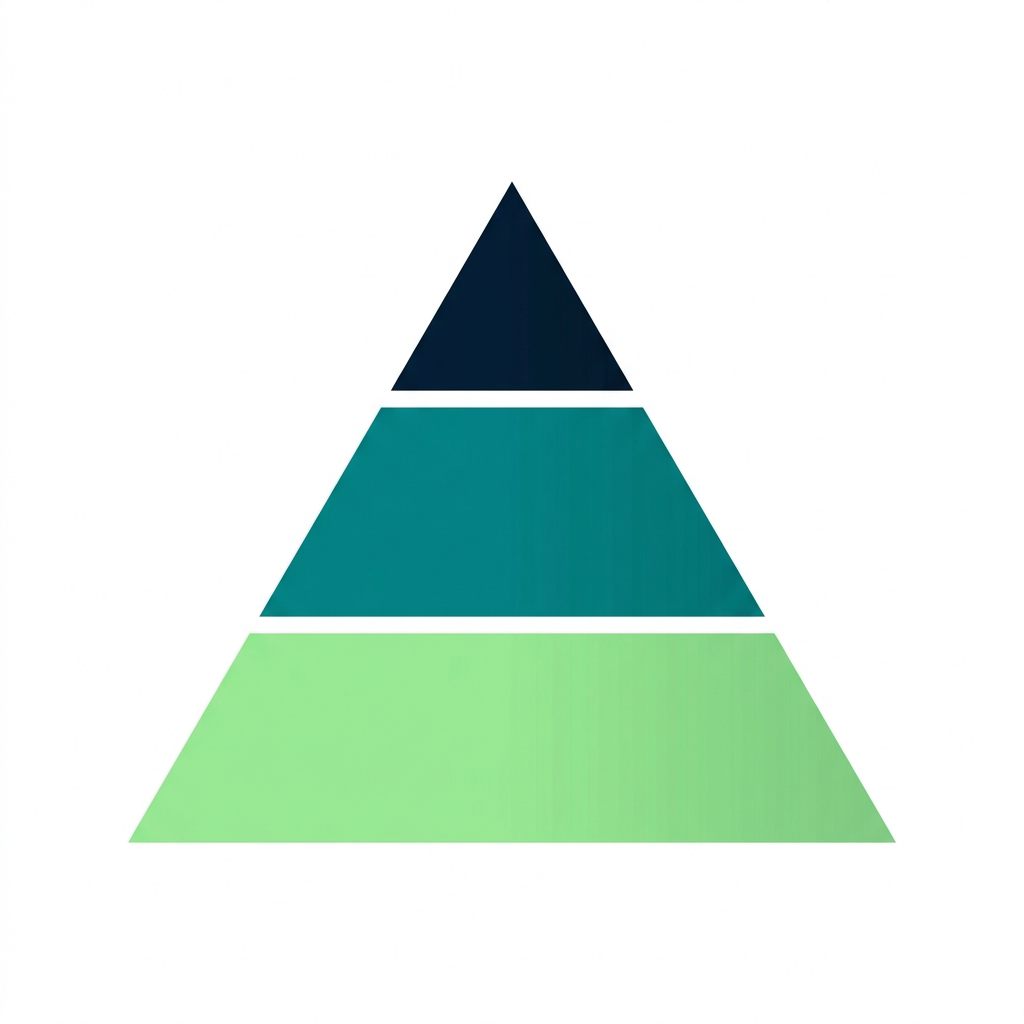
Like a hospital: reception → ward → consultant
The four golden signals
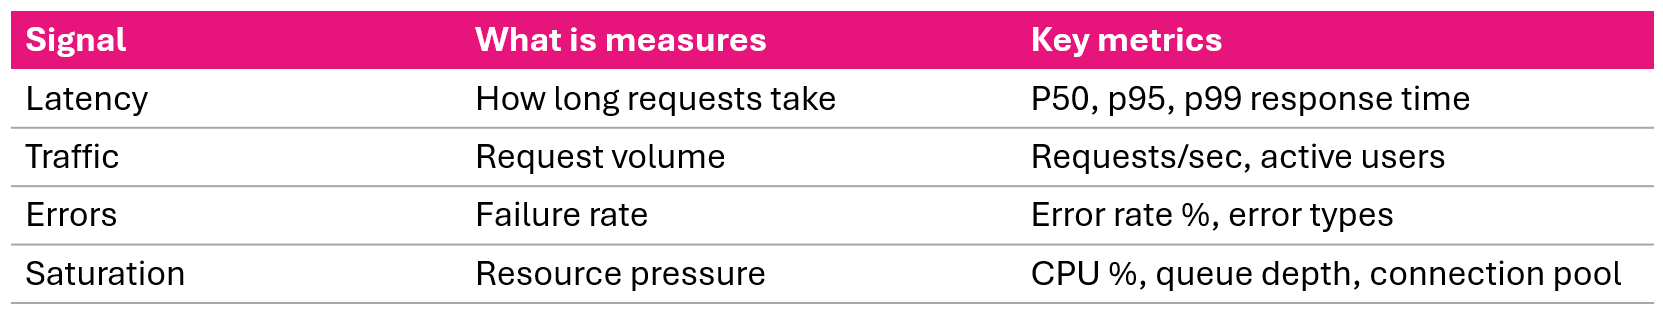
Cover these four and you cover the vast majority of problems you will encounter.
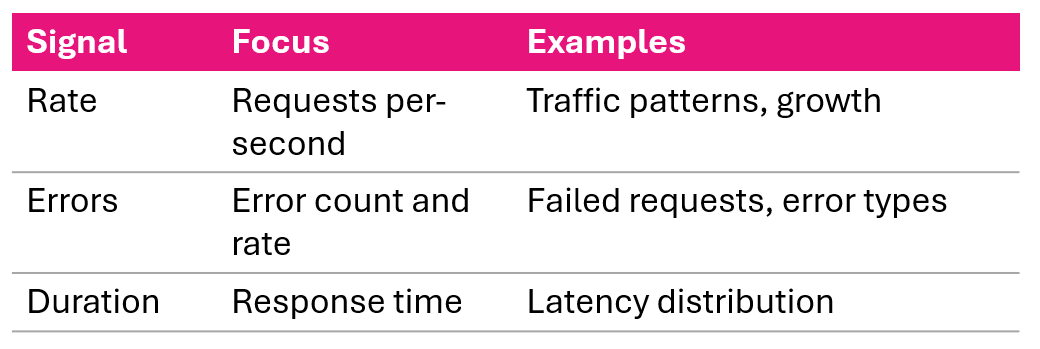
The RED method
RED for request-driven services:
Three data sources
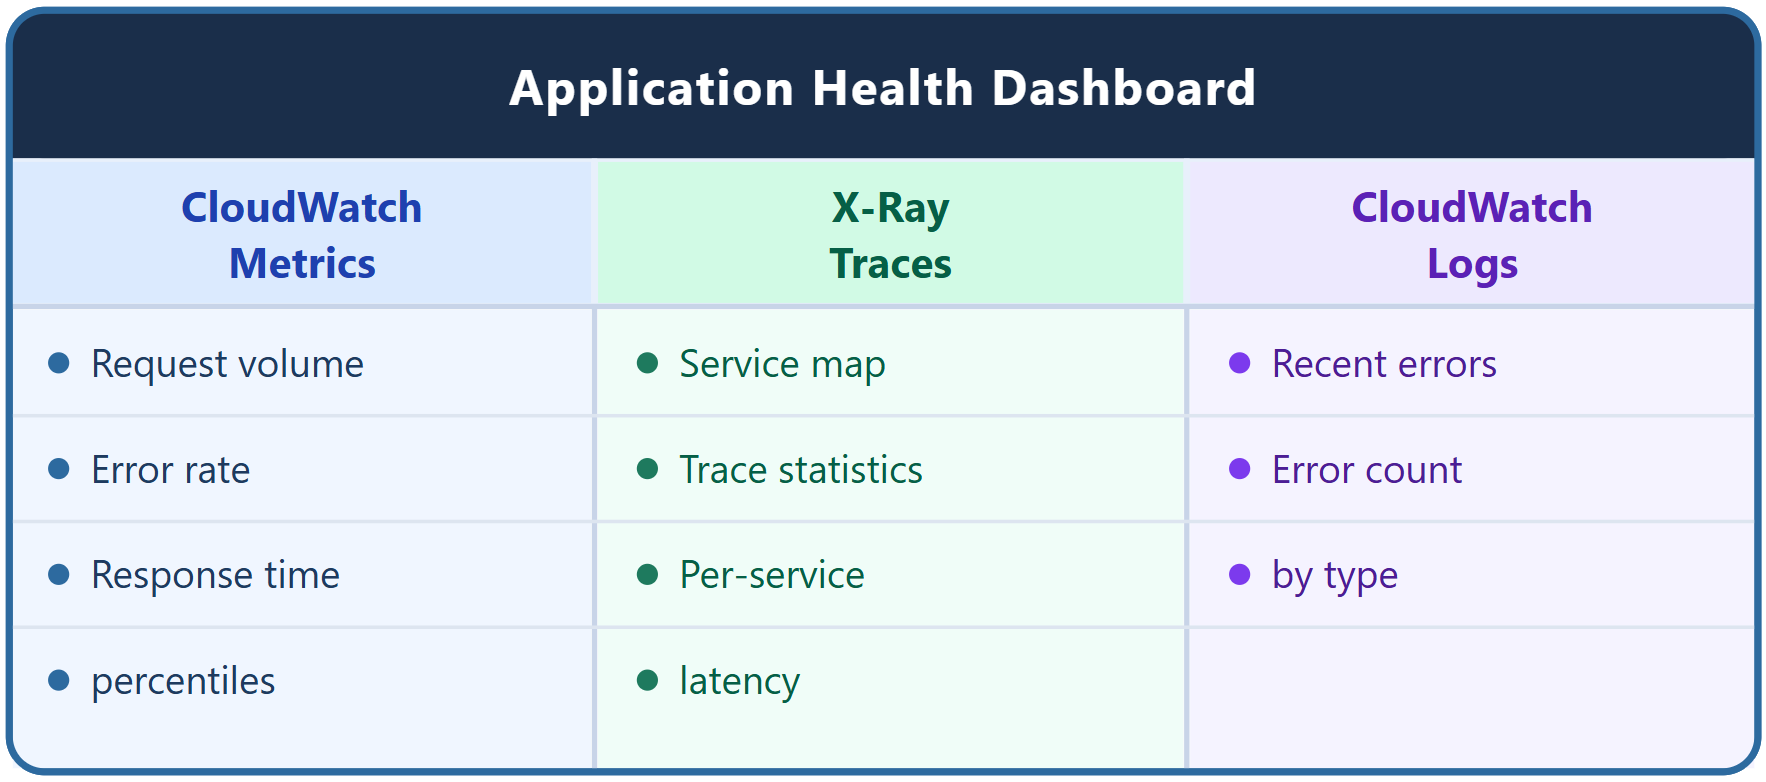
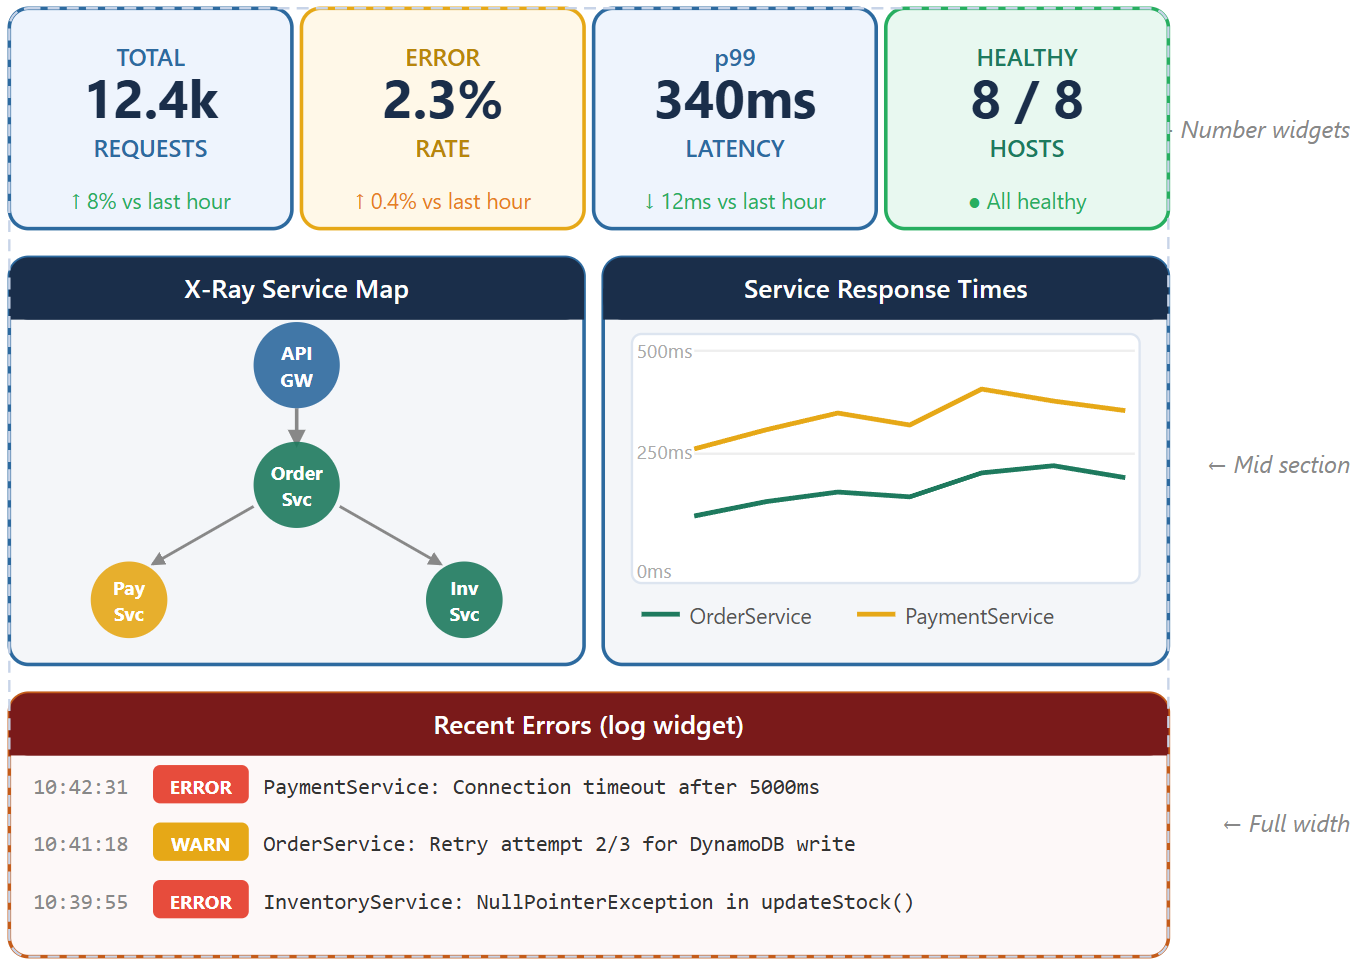
Complete dashboard layout
Incident troubleshooting workflow
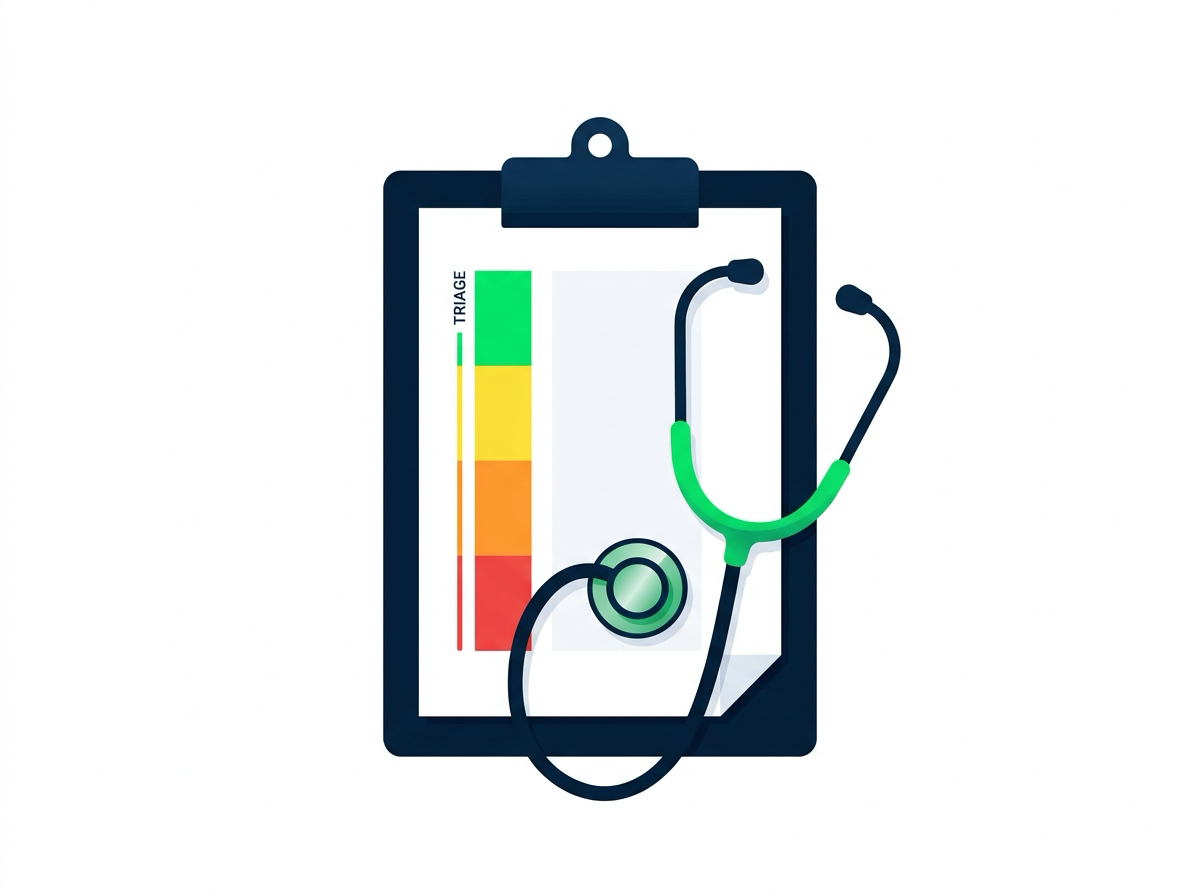
Like ER triage: stabilize → diagnose → treat → verify
Scenario 1: sudden traffic spike
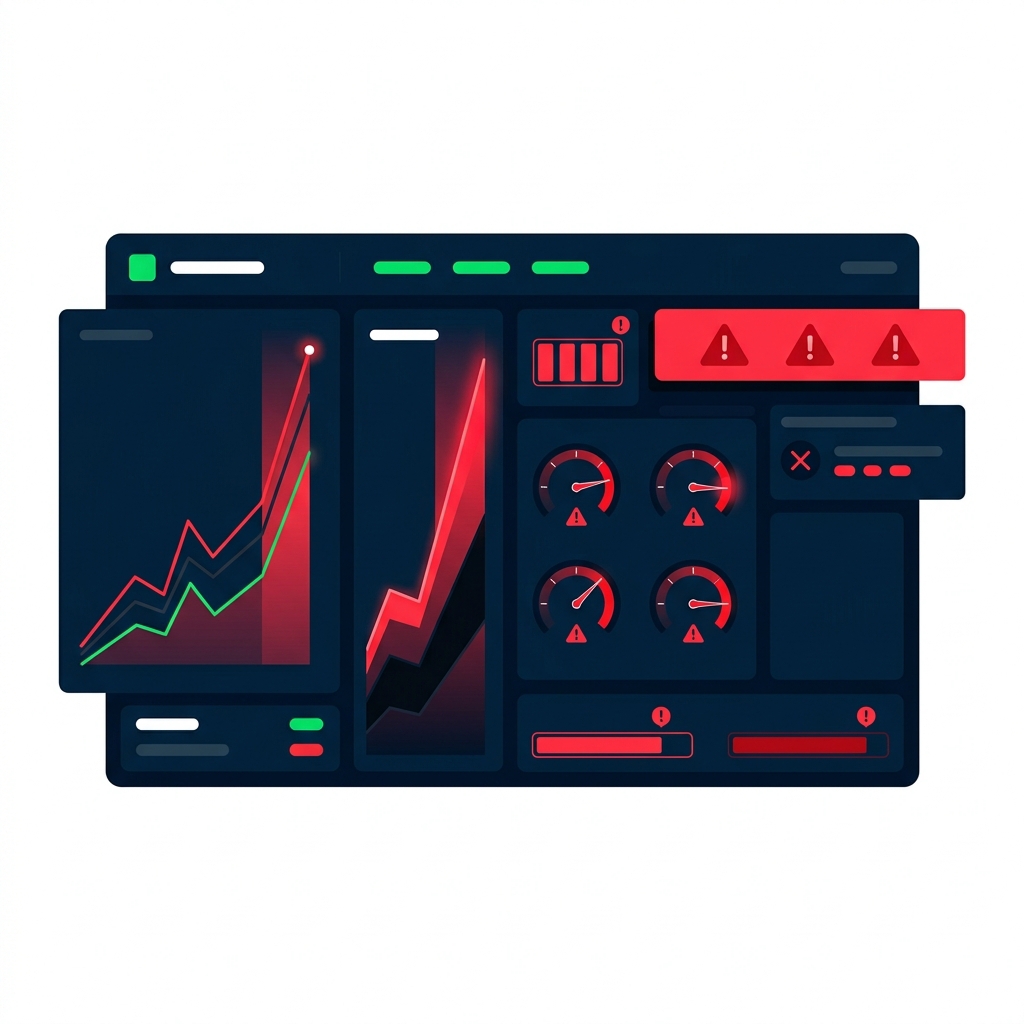
What you see on the dashboard:
- Request volume 10× normal
- Error rate 25%
- Latency 3000ms
- CPU 95%
Analysis: Resources overwhelmed by traffic surge
Scenario 2: database bottleneck
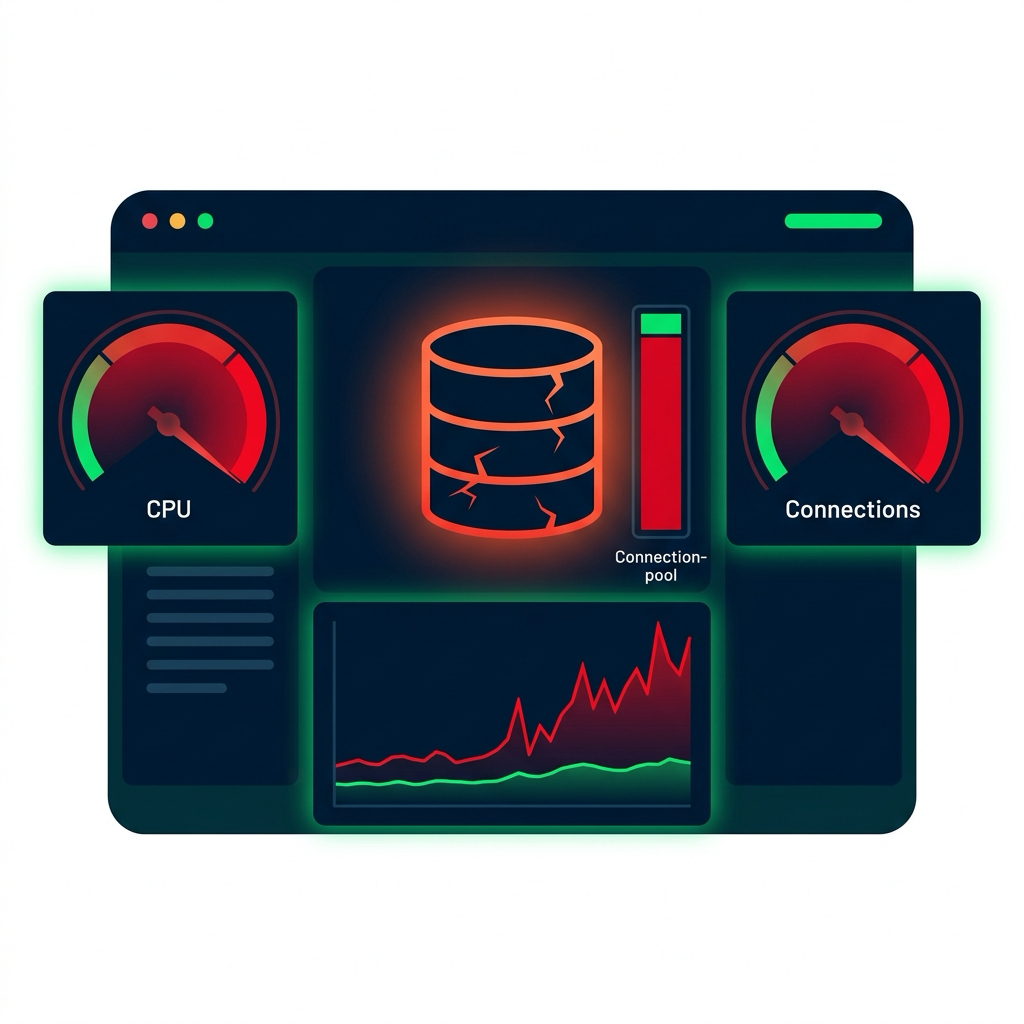
What you see on the dashboard:
- DB CPU 95%
- DB connections 95/100
- Query latency 5000ms
- App latency 5500ms
Analysis: Database is the bottleneck, slow queries exhausting the connection pool
Scenario 3: cascading failure
What you see on the service map:
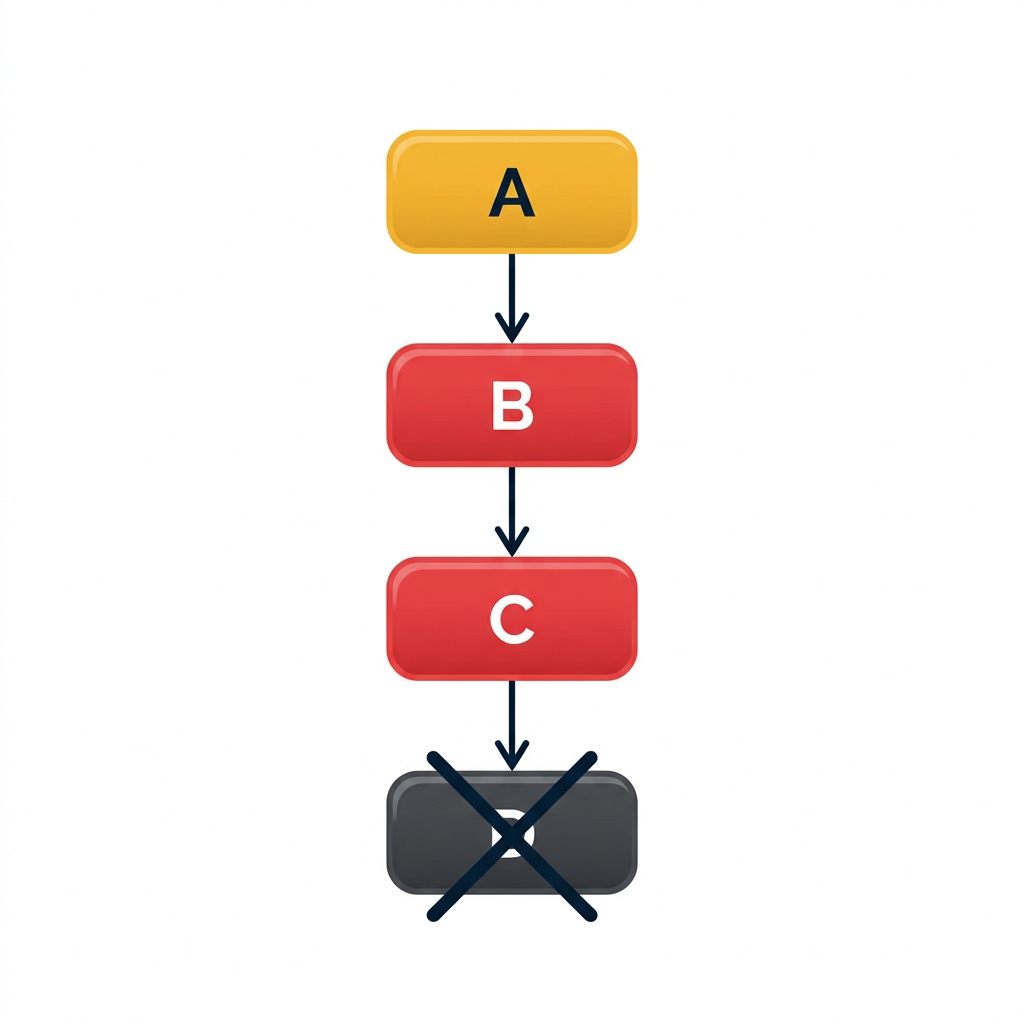
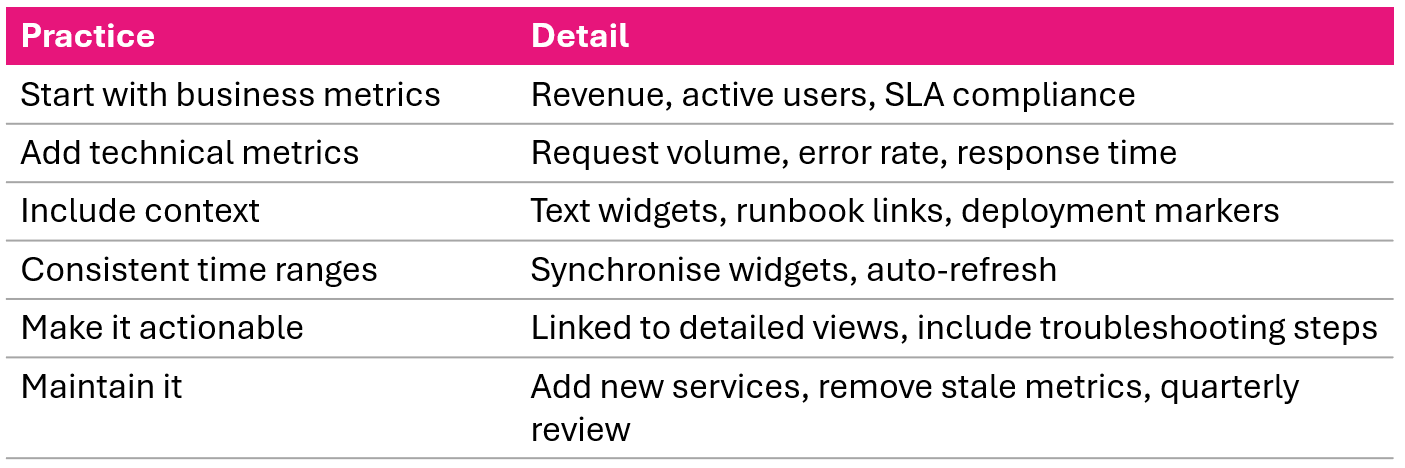
Dashboard best practices