CloudWatch Logs
Monitoring and troubleshooting AWS

John Q. Martin
Principal Consultant
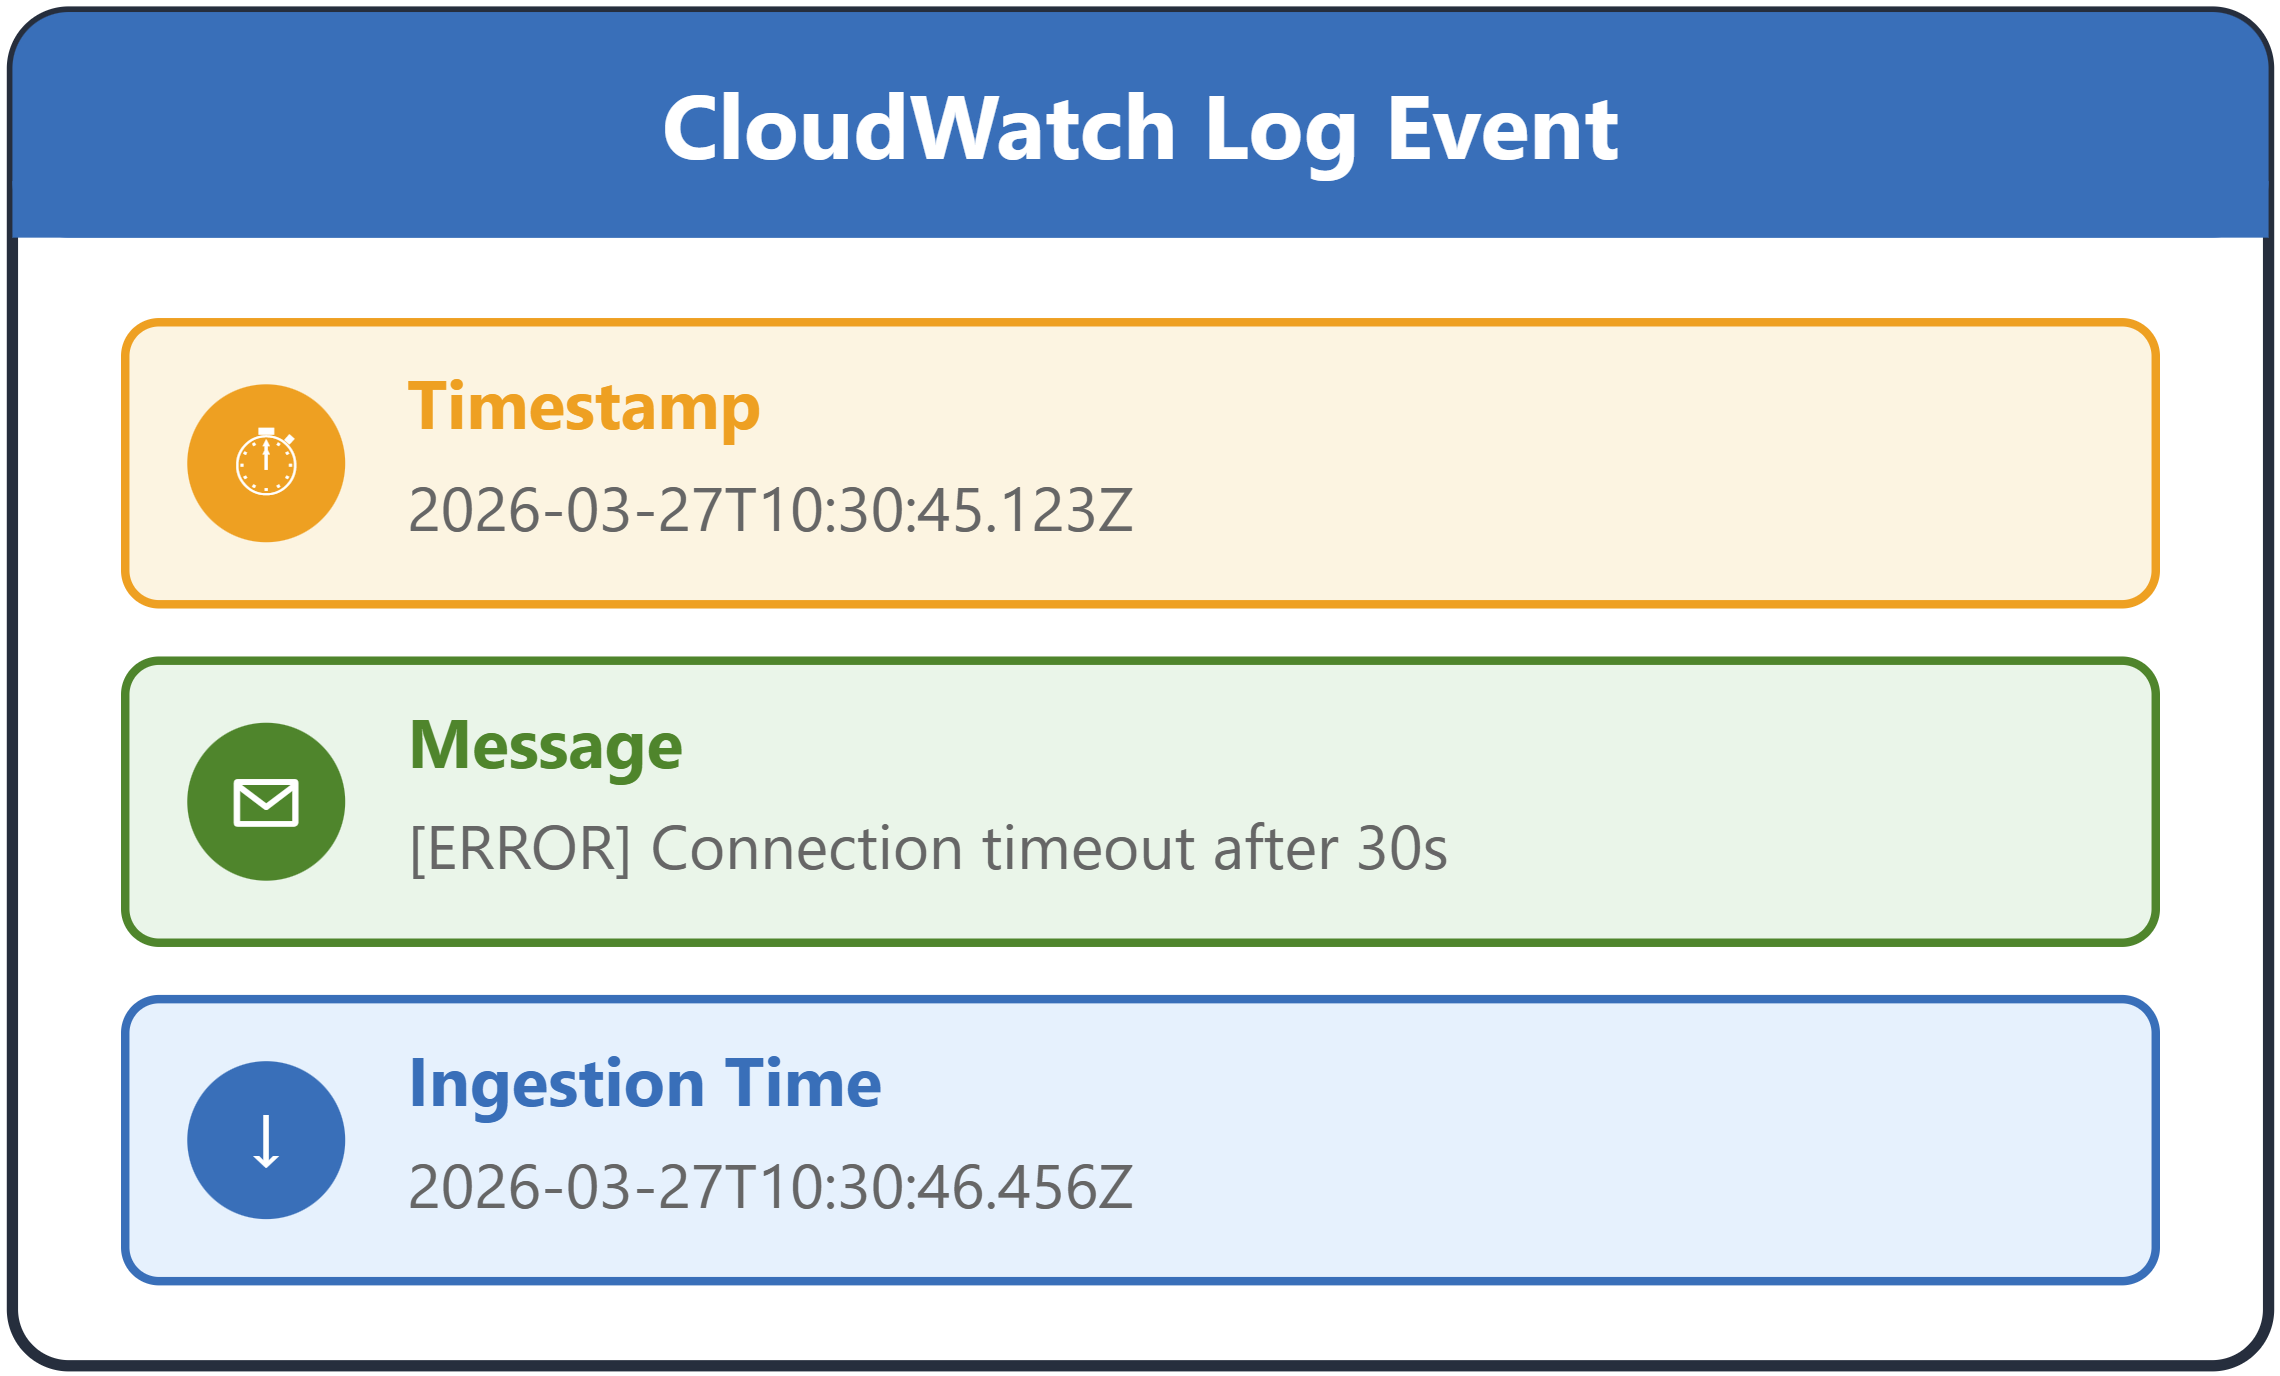
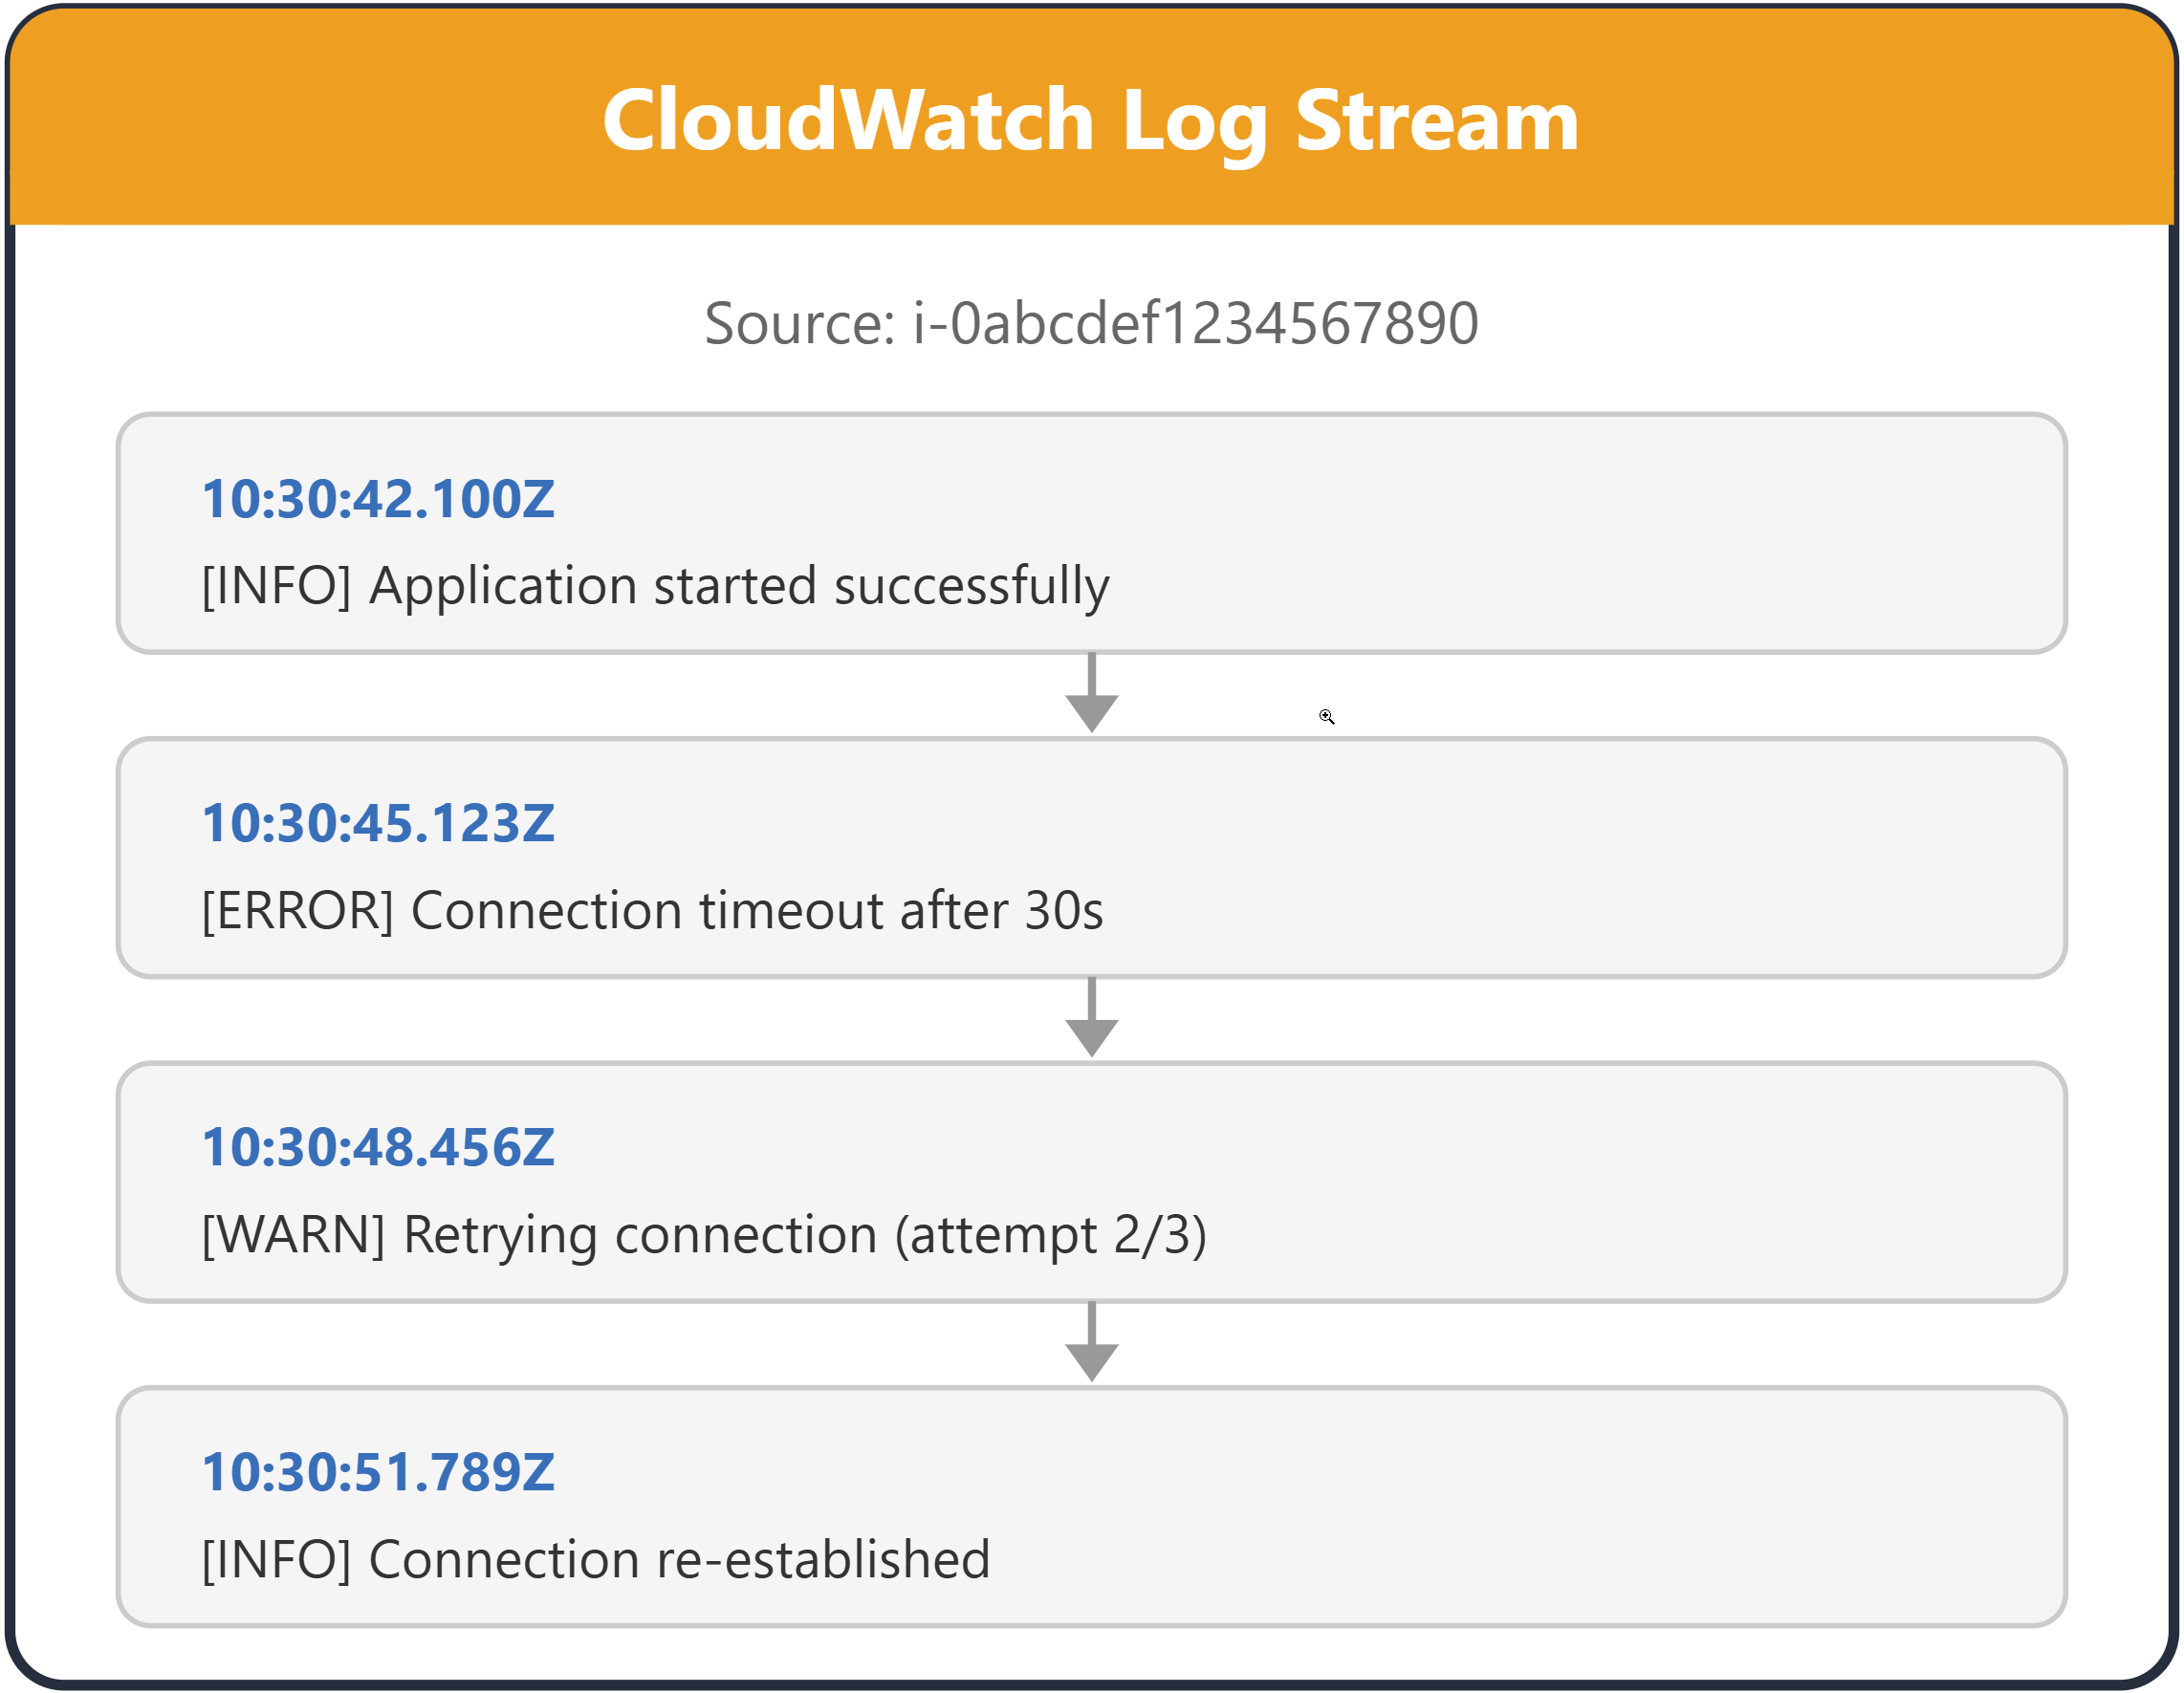
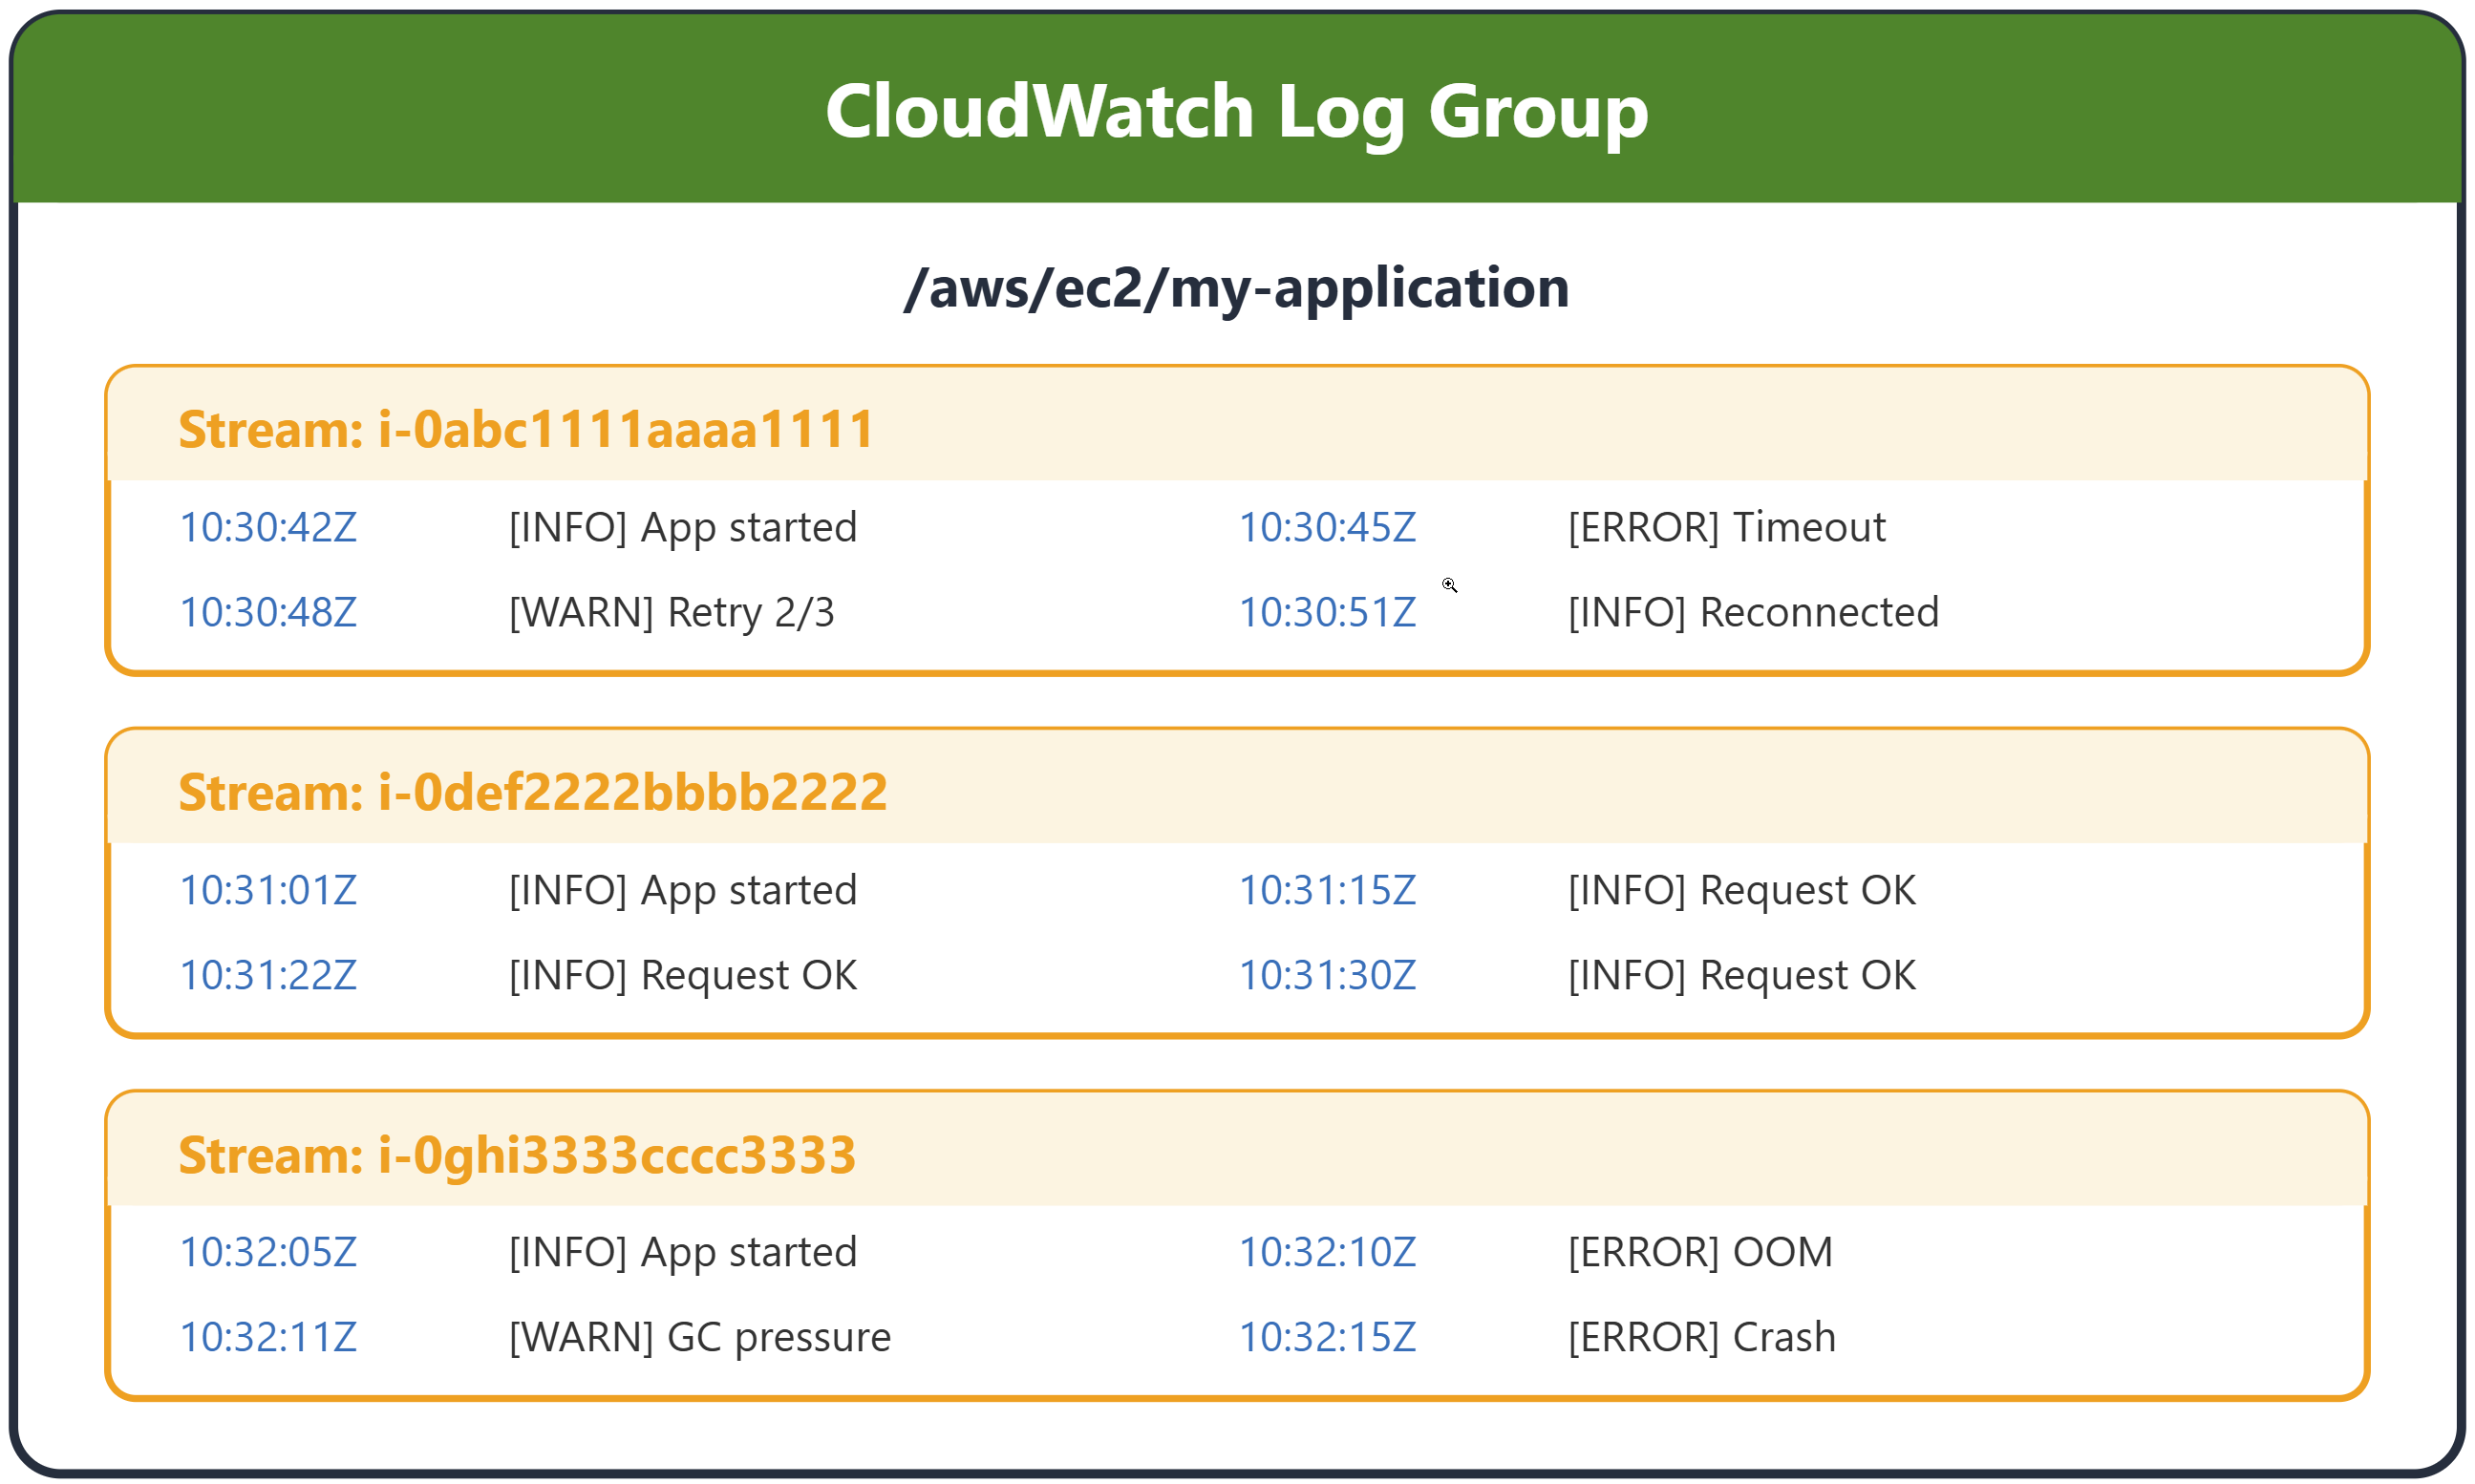
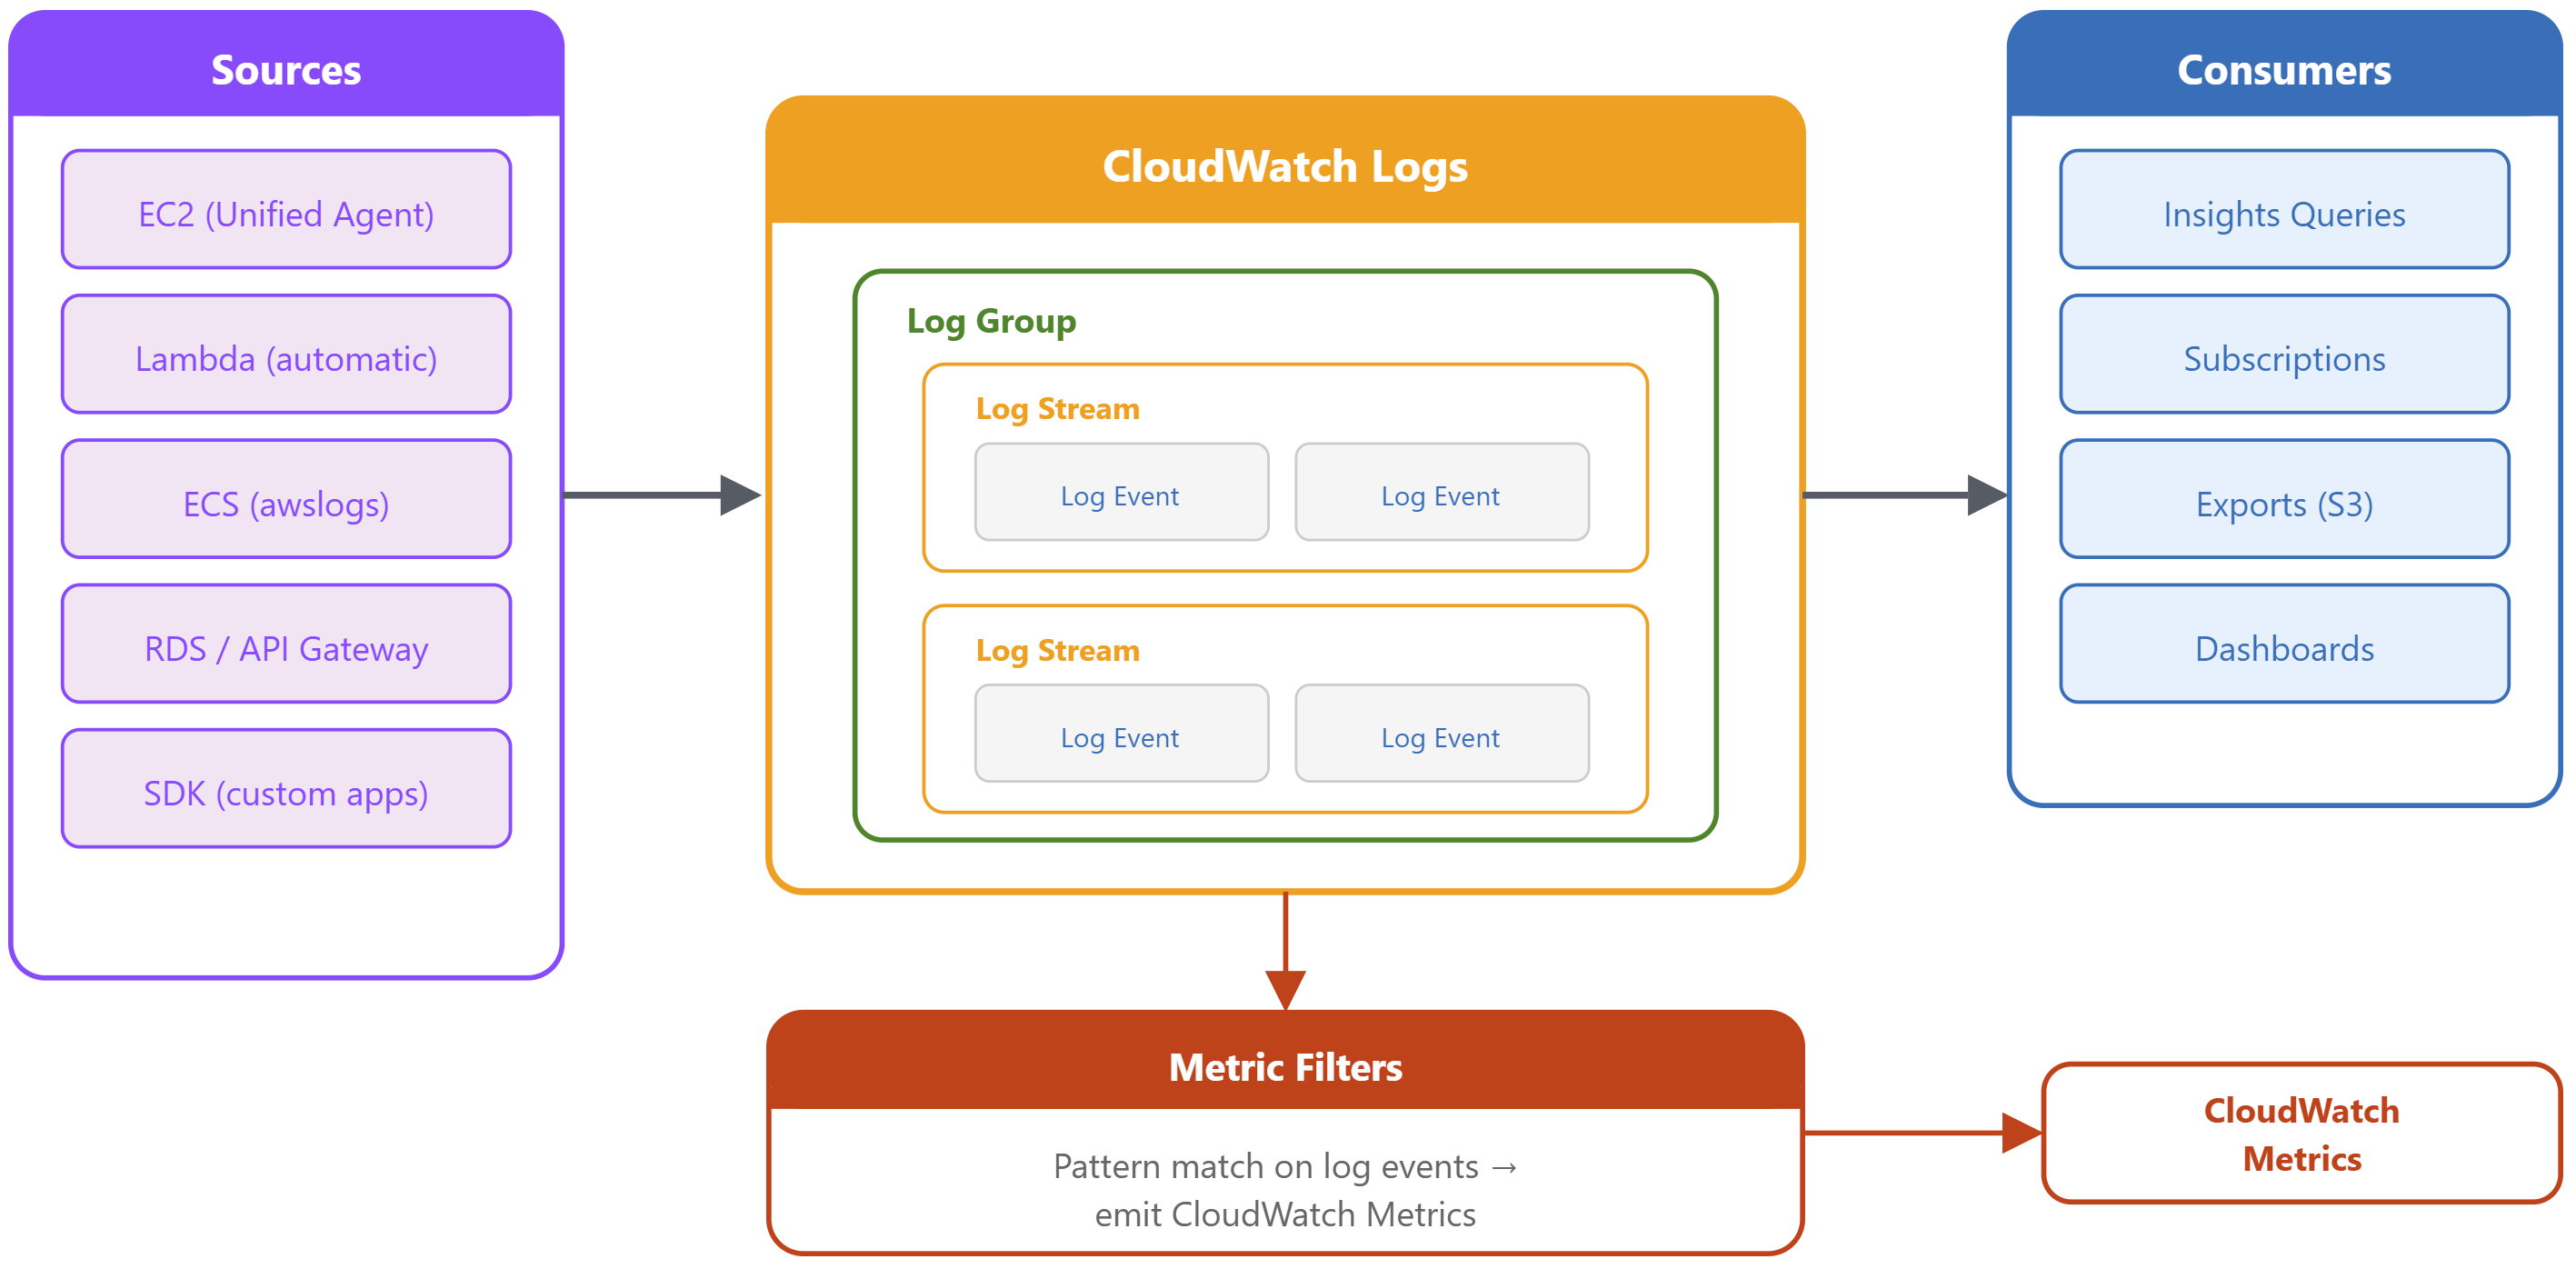
Core concepts: log events, streams, and groups
CloudWatch Logs architecture
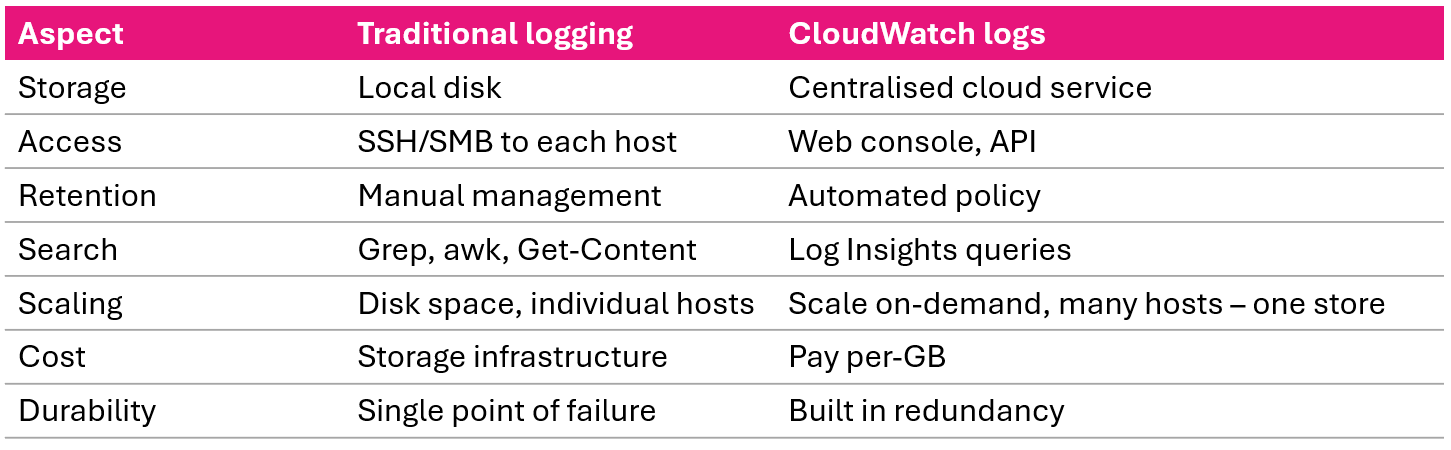
CloudWatch logs vs. traditional logging
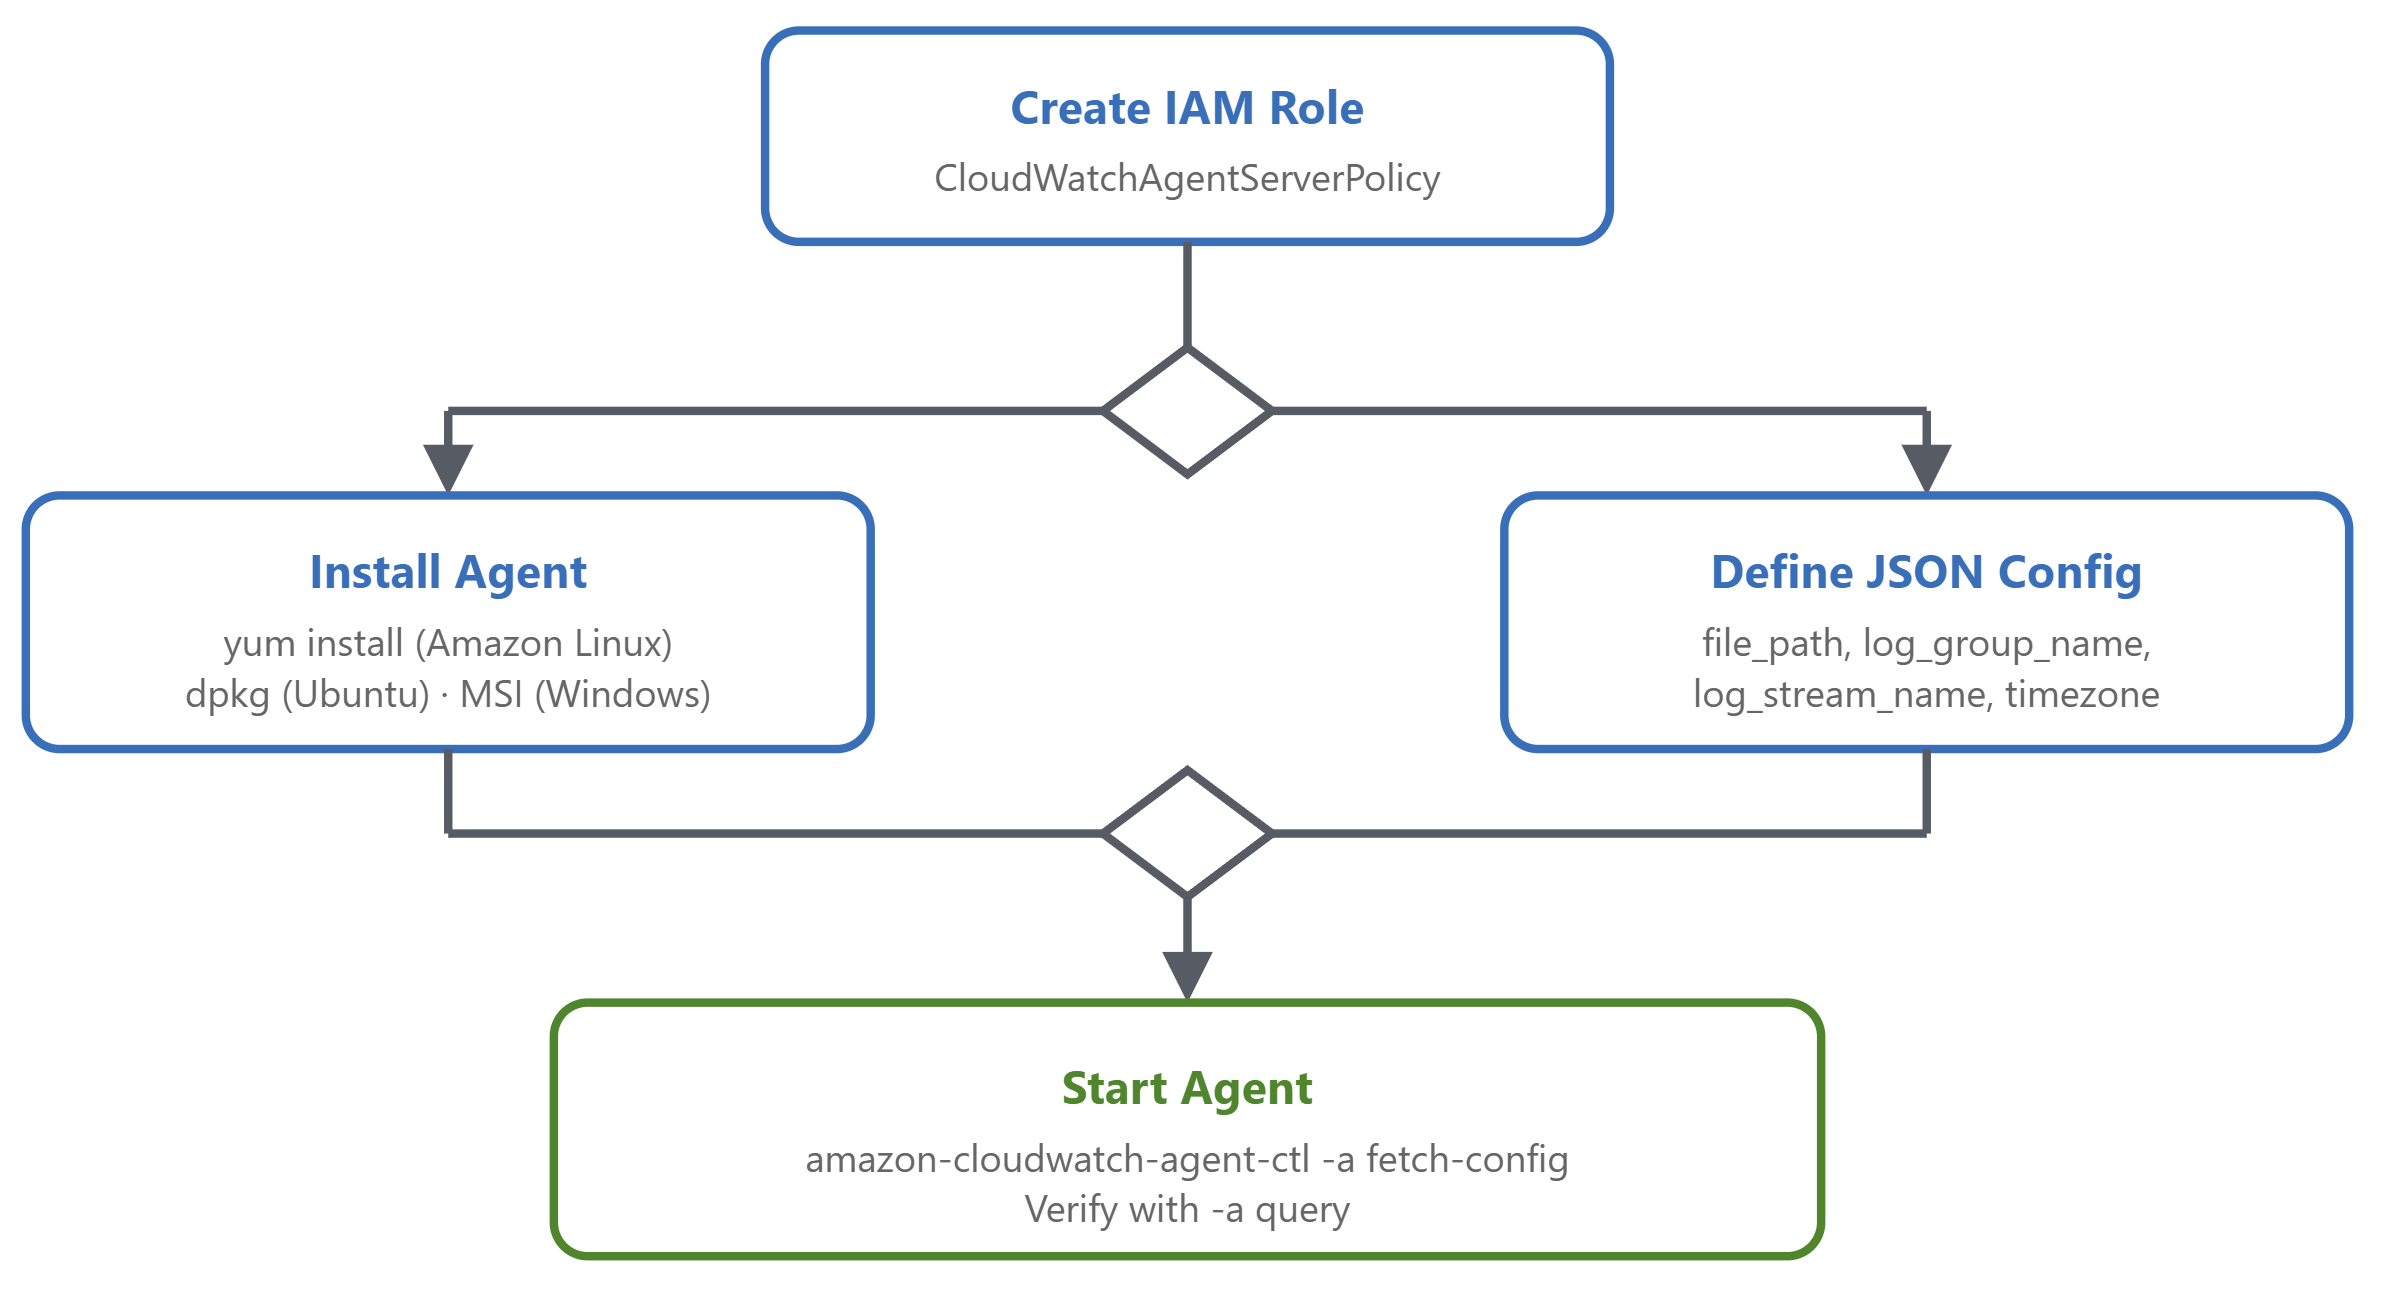
Unified agent setup: EC2
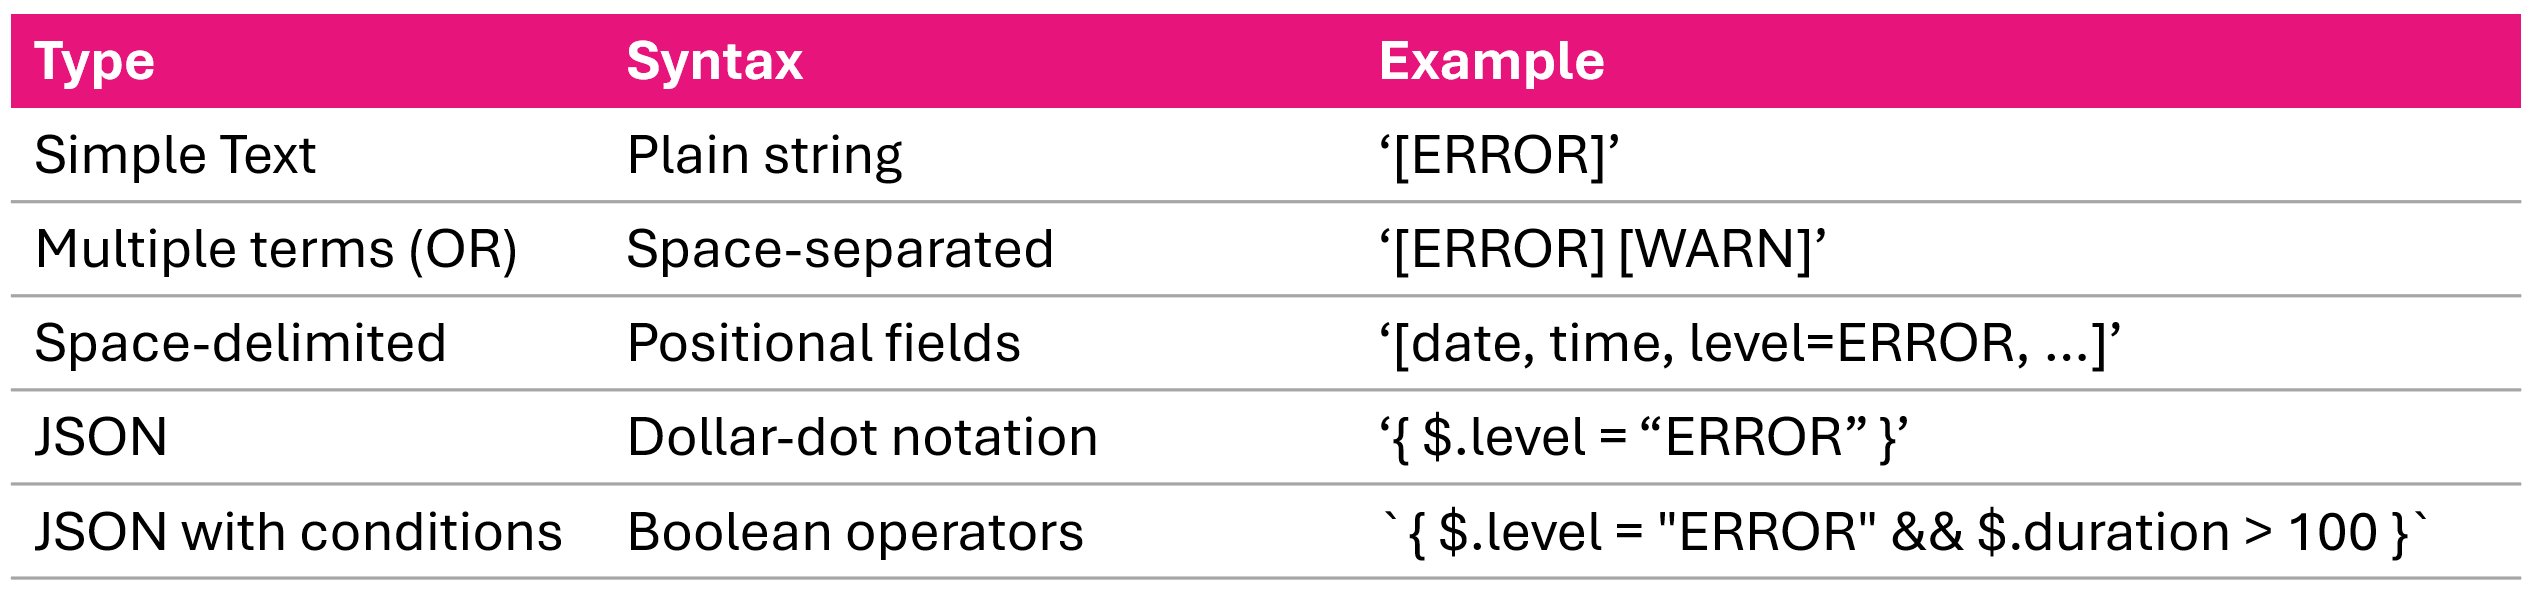
Filter pattern syntax
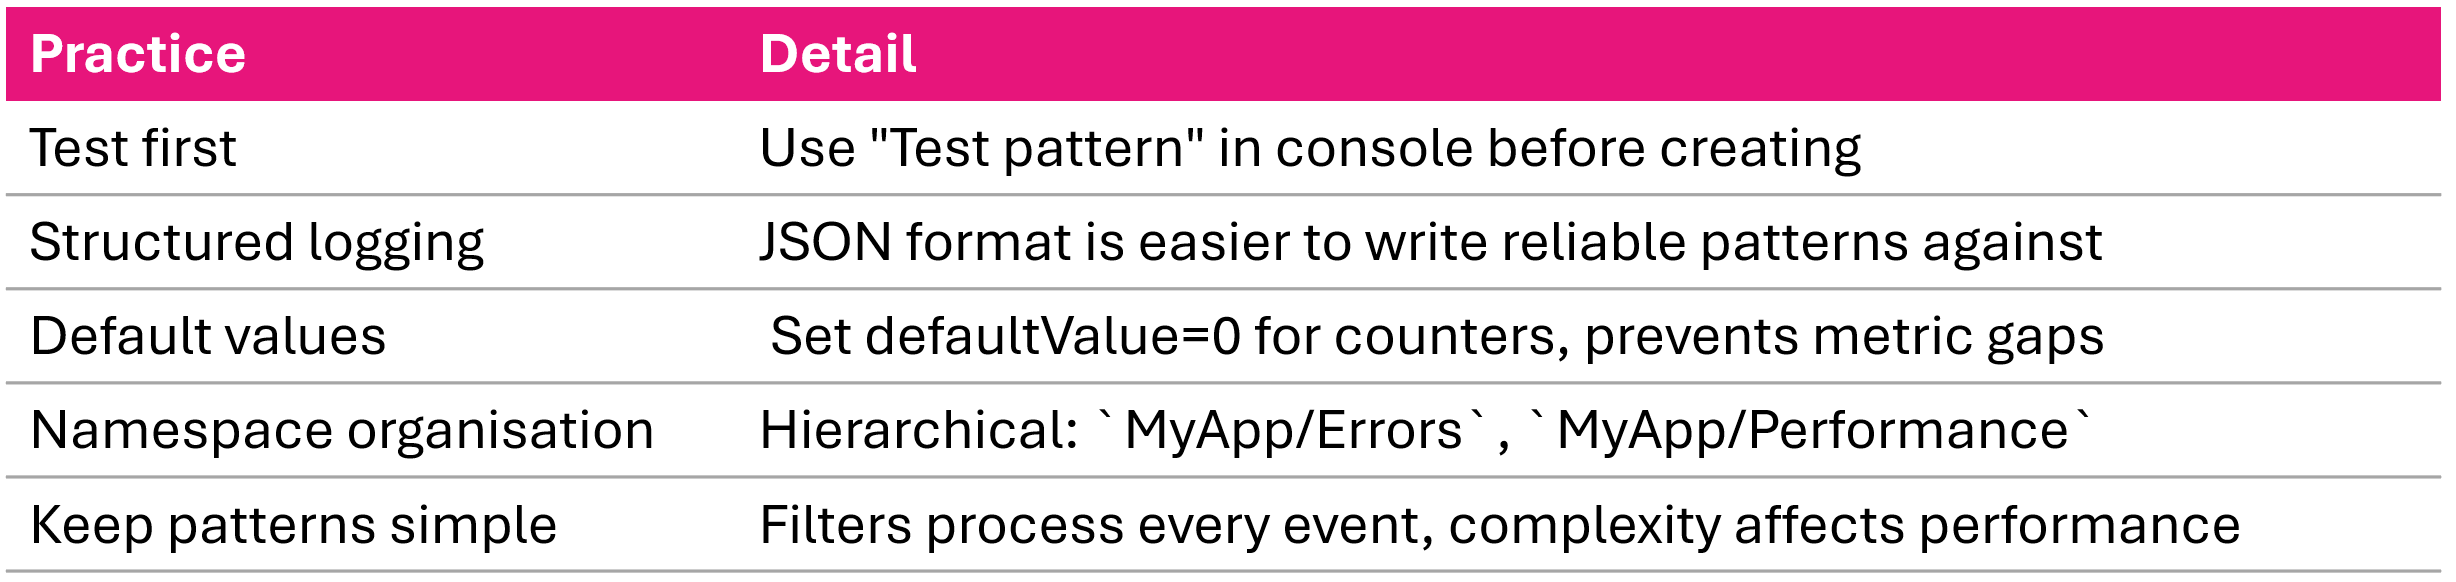
Metric filter recommended practices