Implementing X-Ray tracing
Monitoring and troubleshooting AWS

John Q. Martin
Principal Consultant
X-Ray SDK overview
Key facts:
- Supported languages: Python, Node.js, Java, .NET, Go, Ruby
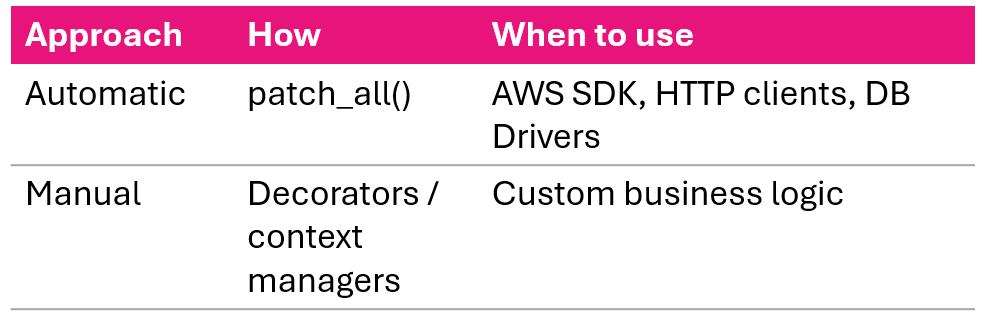
- Two approaches: automatic and manual instrumentation
- SDK communicates with daemon on UDP port 2000
- Never talks directly to the X-Ray API
Automatic vs. Manual:
Python SDK: Flask setup
from flask import Flask
from aws_xray_sdk.core import xray_recorder
from aws_xray_sdk.ext.flask.middleware import XRayMiddleware

app = Flask(__name__)

xray_recorder.configure(
    service='MyFlaskApp',
    sampling=True,
    context_missing='LOG_ERROR',
    daemon_address='127.0.0.1:2000'
)

XRayMiddleware(app, xray_recorder)
Four recorder settings:
- service - name shown in service map
- sampling - enable/disable sampling
- context_missing - LOG_ERROR prevents crashes
- daemon_address - where to send segments
Once middleware is attached, all incoming requests are automatically traced.
Automatic instrumentation: Python
# Instrument all supported libraries
from aws_xray_sdk.core import patch_all
patch_all()
# Or selectively
from aws_xray_sdk.core import patch
patch(['boto3', 'requests', 'psycopg2'])
Supported libraries:
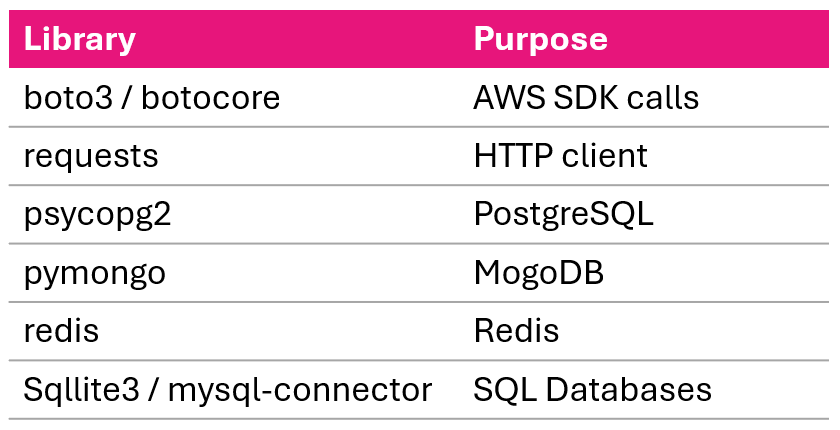
Manual instrumentation: Python
Decorator approach:
@xray_recorder.capture('process_order')
def process_order(order_id):
    order = get_order(order_id)
    return process_payment(order)
Context manager approach:
def process_order(order_id):
    with xray_recorder.capture('fetch_order'):
        order = db.query(Order).filter_by(
            id=order_id).first()
    with xray_recorder.capture('process_payment'):
        return payment_service.charge(order.total)
Annotations and metadata in code
Adding annotations:
xray_recorder.put_annotation(
    'order_id', order_id)
xray_recorder.put_annotation(
    'user_id', user_id)
Adding metadata (detailed context):
xray_recorder.put_metadata(
    'order_details',
    {'items': order.items,
     'total': order.total})
- Annotations are indexes, metadata is not
- Annotations are typed, metadata is any JSON
- Use indexes for filtering, metadata for debug context
Error handling in traces
def process_order(order_id):
    try:
        order = get_order(order_id)
        payment = process_payment(order)
        return payment
    except PaymentError as e:
        xray_recorder.put_annotation(
            'error_type', 'payment_failed')
        xray_recorder.put_metadata(
            'error_details',
            {'message': str(e), 'order_id': order_id})
        raise
- Exceptions inside traced functions are automatically captured
- Add an annotation for the error type to filter in the console
- Add metadata for the full error details
- Always re-raise, your application's error handling still needs to run
Node.js SDK: Express setup
const AWSXRay = require('aws-xray-sdk-core');
const xrayExpress = require('aws-xray-sdk-express');
const app = require('express')();

AWSXRay.config([AWSXRay.plugins.EC2Plugin]);

// Open segment for all incoming requests
app.use(xrayExpress.openSegment('MyExpressApp'));

app.get('/api/orders/:id', async (req, res) => {
    const order = await fetchOrder(req.params.id);
    res.json({ order });
});

// Close segment after response
app.use(xrayExpress.closeSegment());

// Automatic instrumentation
const AWS = AWSXRay.captureAWS(require('aws-sdk'));
const https = AWSXRay.captureHTTPs(require('https'));
Lambda implementation
from aws_xray_sdk.core import xray_recorder
from aws_xray_sdk.core import patch_all

patch_all()  # instrument AWS SDK calls

def lambda_handler(event, context):
    xray_recorder.put_annotation(
        'user_id', event['user_id'])

    result = process_user(event['user_id'])

    return {
        'statusCode': 200,
        'body': json.dumps(result)
    }
Key facts:
- Lambda sends basic traces automatically when Active Tracing is enabled, no SDK required for that
- Install the X-Ray SDK to add subsegments, annotations, and instrument downstream calls
- Enable in console: Configuration → Monitoring tools
- Or in template:
Tracing: Active
ECS and Fargate: sidecar pattern
Task structure:
ECS Task
|_ Application Container
|   sends to xray-daemon:2000
|_ X-Ray Daemon Container
    forwards to X-Ray service
App container config:
xray_recorder.configure(
    service='MyECSApp',
    daemon_address='xray-daemon:2000'
)
Task definition includes:
- Daemon container:
amazon/aws-xray-daemonimage, UDP port 2000 - App container: env var
AWS_XRAY_DAEMON_ADDRESS=xray-daemon:2000
Why sidecar?
- Daemon scales with your tasks
- Failures are isolated per task
Installing the X-Ray daemon
Install by platform:
- Amazon Linux 2
- sudo yum install -y aws-xray-daemon-3.x.rpm
- Ubuntu
- sudo dpkg -i aws-xray-daemon-3.x.deb
- Windows
- xray.exe -f cfg.yaml install
- Docker
- docker run -p 2000:2000/udp amazon/aws-xray-daemon
Post-install:
sudo systemctl start xray
sudo systemctl enable xray
What the daemon does:
- Listens on UDP port 2000
- Buffers and batches segments
- Forwards to X-Ray API over HTTPS
- Handles retries, your app doesn't need to
Daemon configuration
TotalBufferSizeMB: 24
Concurrency: 8
Region: "us-east-1"
Socket:
  UDPAddress: "127.0.0.1:2000"
  TCPAddress: "127.0.0.1:2000"
Logging:
  LogLevel: "info"
  LogPath: "/var/log/xray/xray-daemon.log"
LocalMode: false
- Buffer size, increase for high traffic
- Concurrency sets parallel connections to X-Ray
- For containers, set UDP address to 0.0.0.0
- Local mode, true for local dev without credentials
IAM permissions
{
  "Effect": "Allow",
  "Action": [
    "xray:PutTraceSegments",
    "xray:PutTelemetryRecords",
    "xray:GetSamplingRules",
    "xray:GetSamplingTargets",
    "xray:GetSamplingStatisticSummaries"
  ],
  "Resource": "*"
}
Easiest approach
Use the managed policy AWSXRayDaemonWriteAccess
Attach to:
- EC2 instance role
- ECS task role
- Lambda execution role
Without correct permissions, the daemon runs but silently fails to deliver segments.
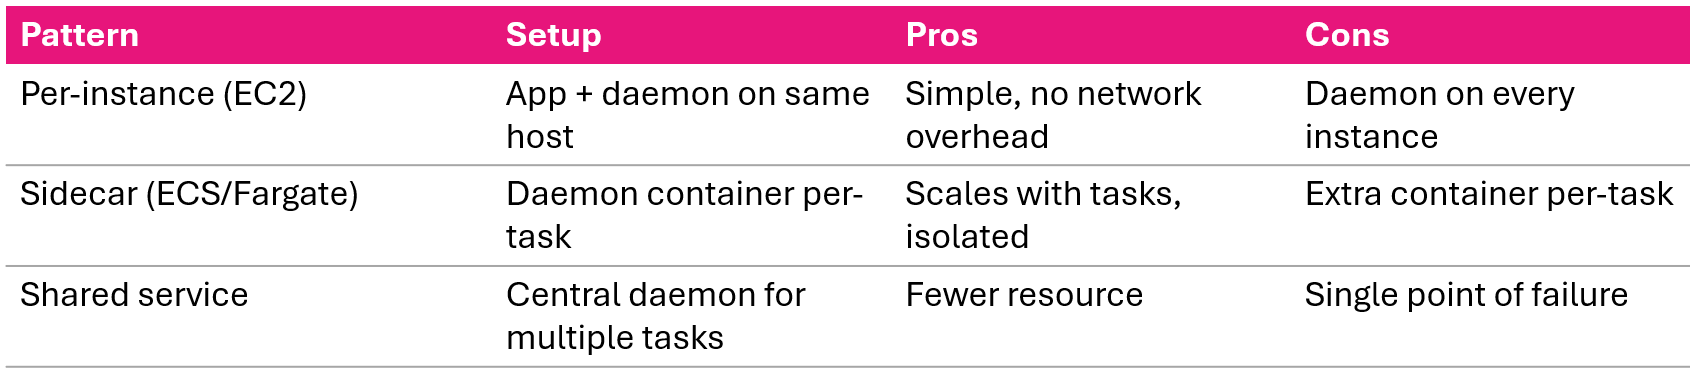
Daemon deployment patterns
Lesson summary
- SDK: automatic instrumentation with
patch_all(), manual with decorators and context managers - Annotations (indexed, searchable) vs. metadata (detailed, non-indexed)
- Lambda: sends basic traces automatically; install SDK for subsegments and downstream calls
- ECS/Fargate: sidecar daemon container pattern
- Daemon: configured via cfg.yaml, needs
AWSXRayDaemonWriteAccessIAM policy - Deployment: per-instance for EC2, sidecar for containers
Let's practice!
Monitoring and troubleshooting AWS

