Analyzing traces and service maps
Monitoring and troubleshooting AWS

John Q. Martin
Principal Consultant
What is a service map?
Auto-generated from your trace data: no manual setup
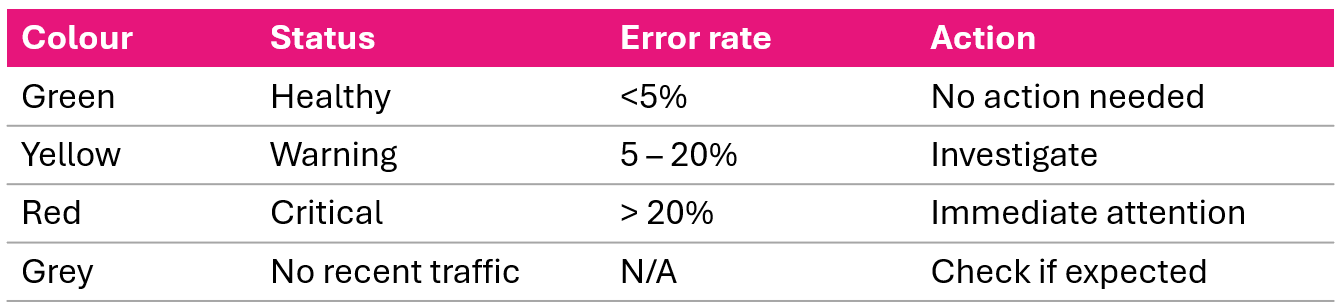
At a glance: green = on time · amber = delayed · red = stopped
Service map color coding
When you open a service map, go straight to anything that isn't green.
Click any node to see: response time distribution, HTTP status breakdown, error types.
Reading a service map
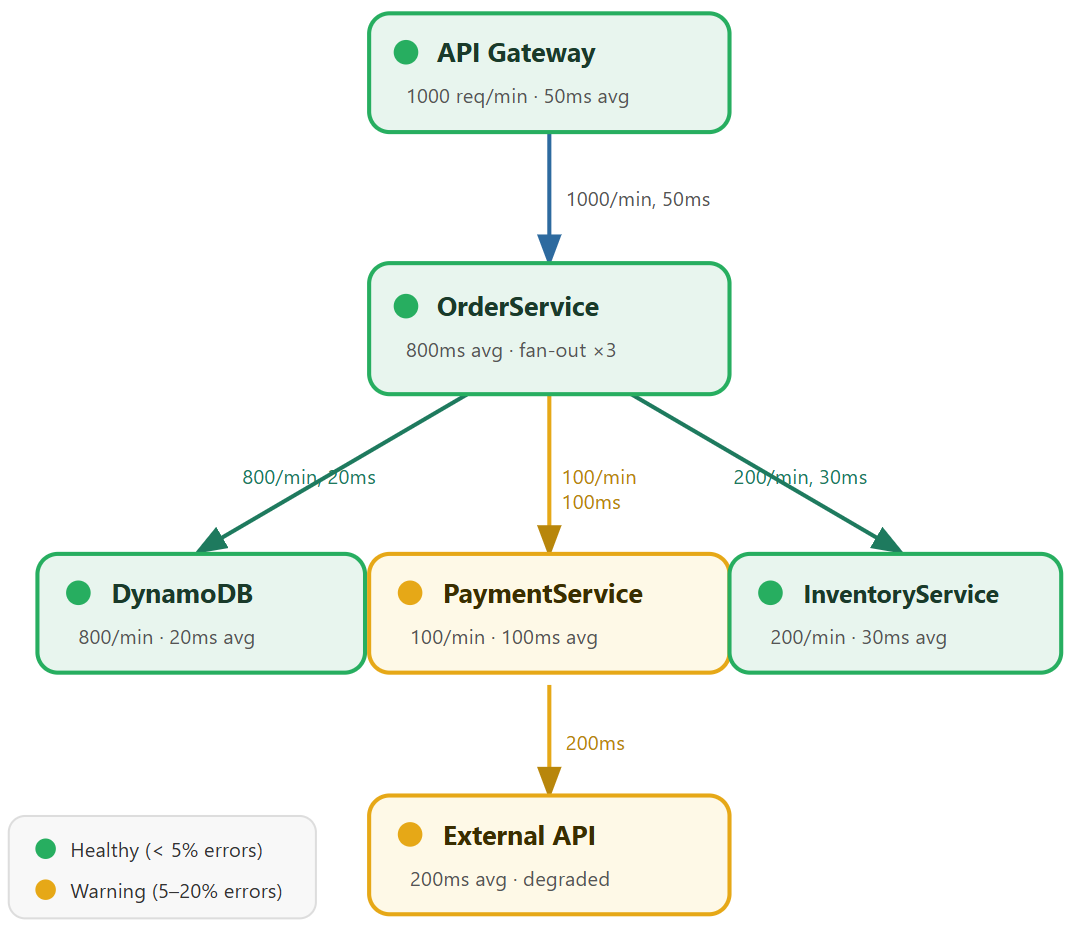
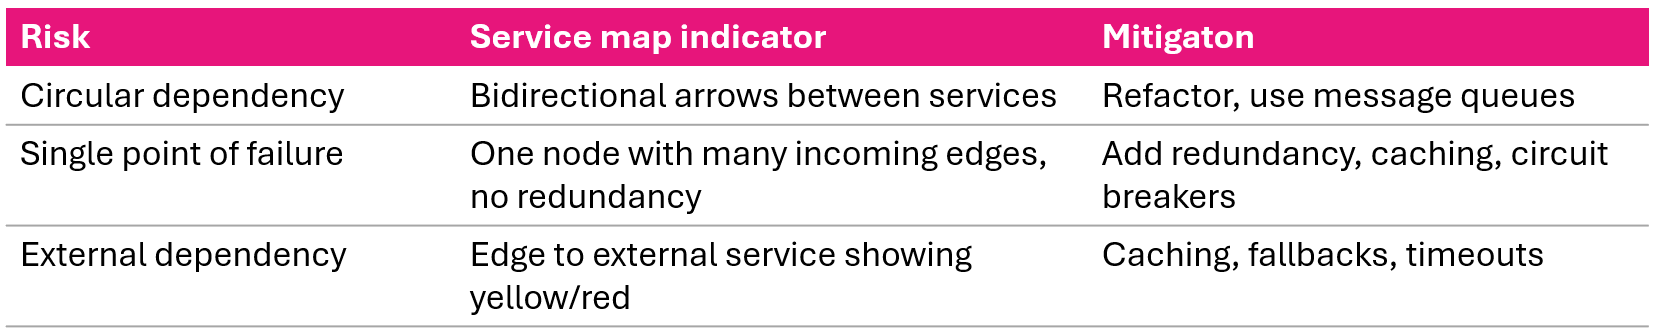
Dependency risks
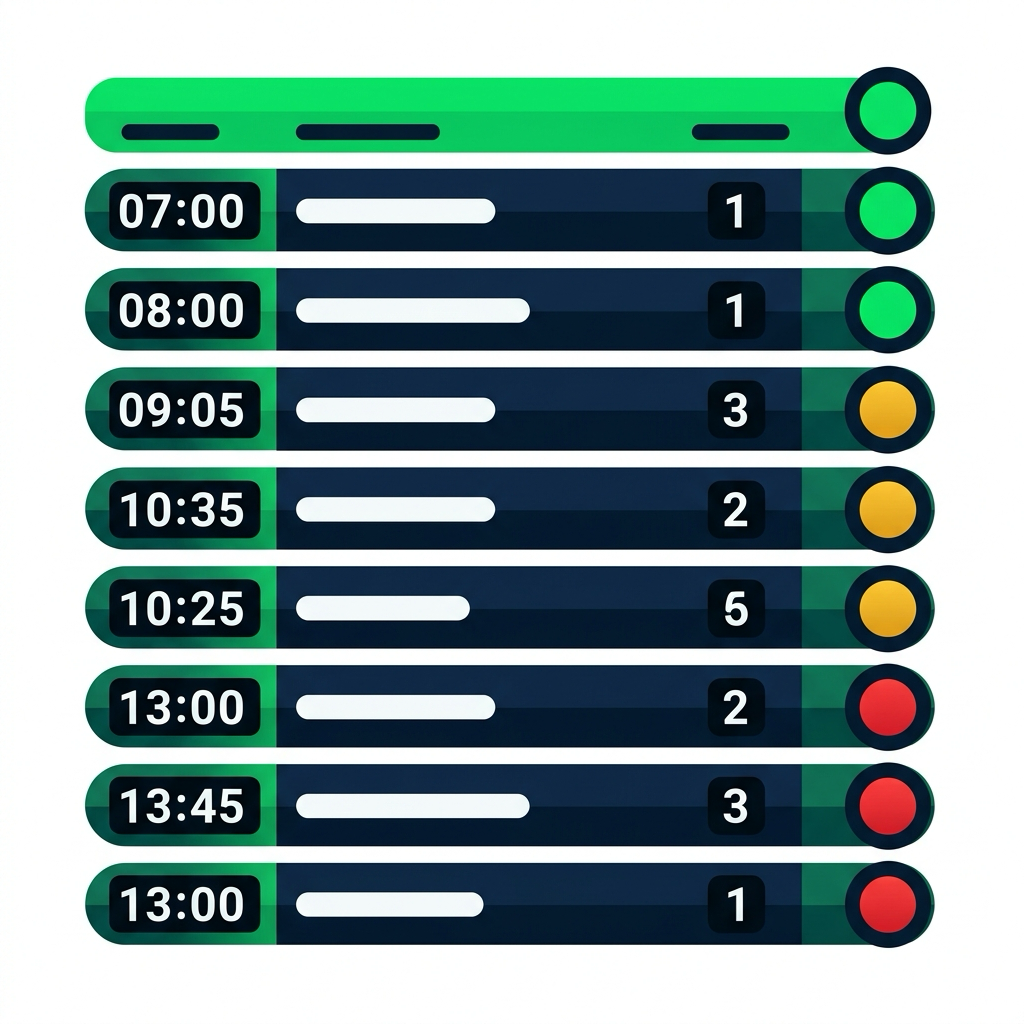
Understanding trace timelines
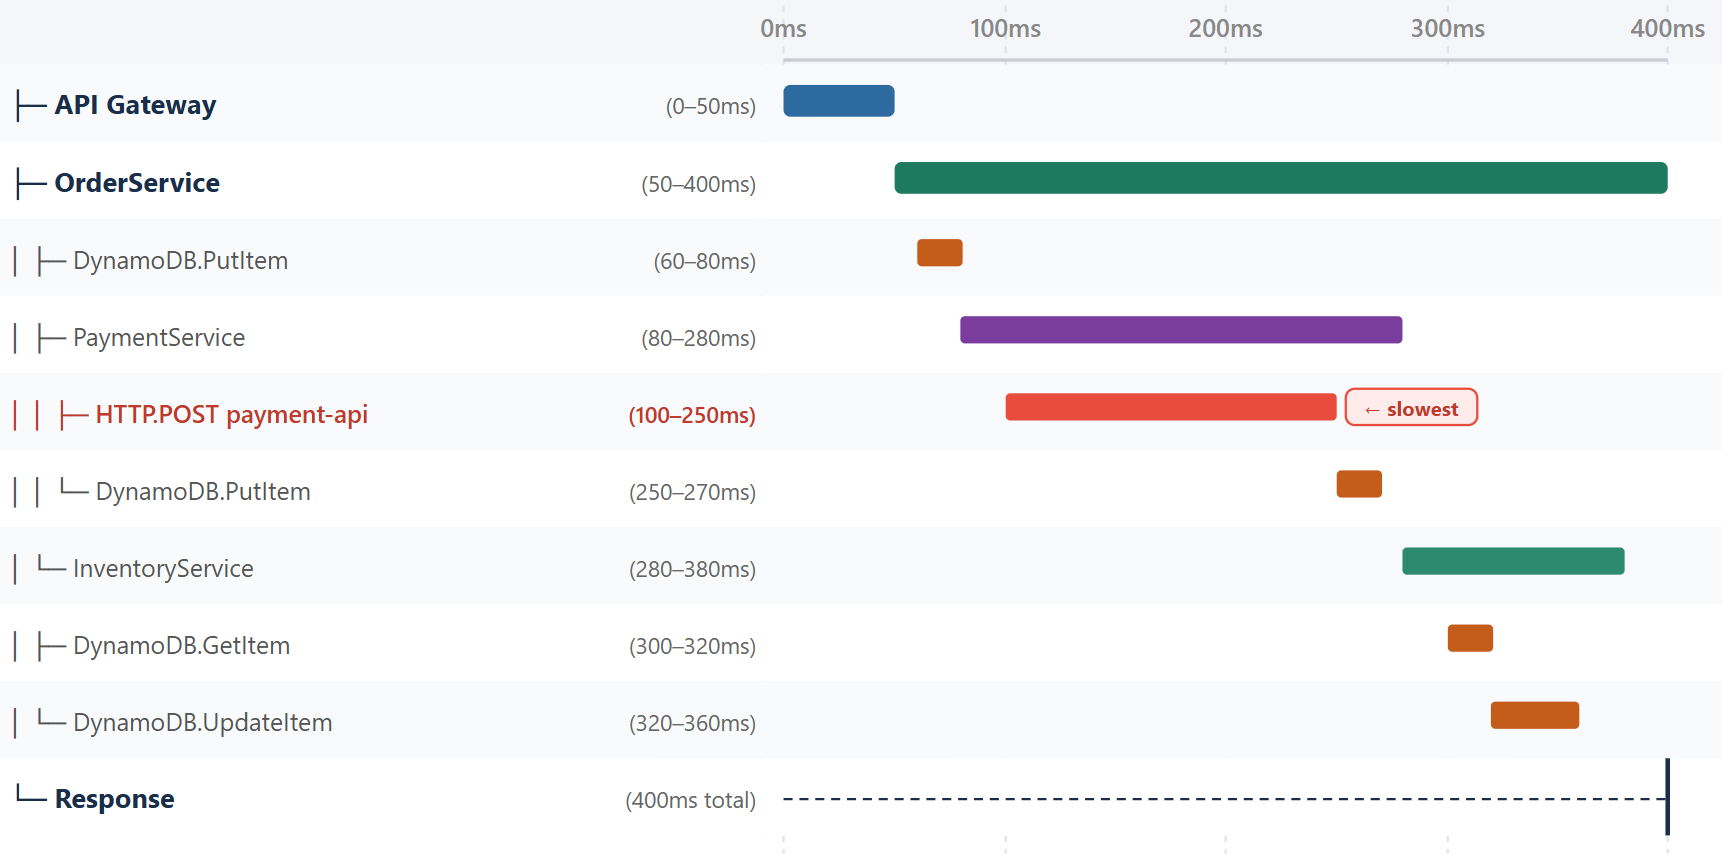
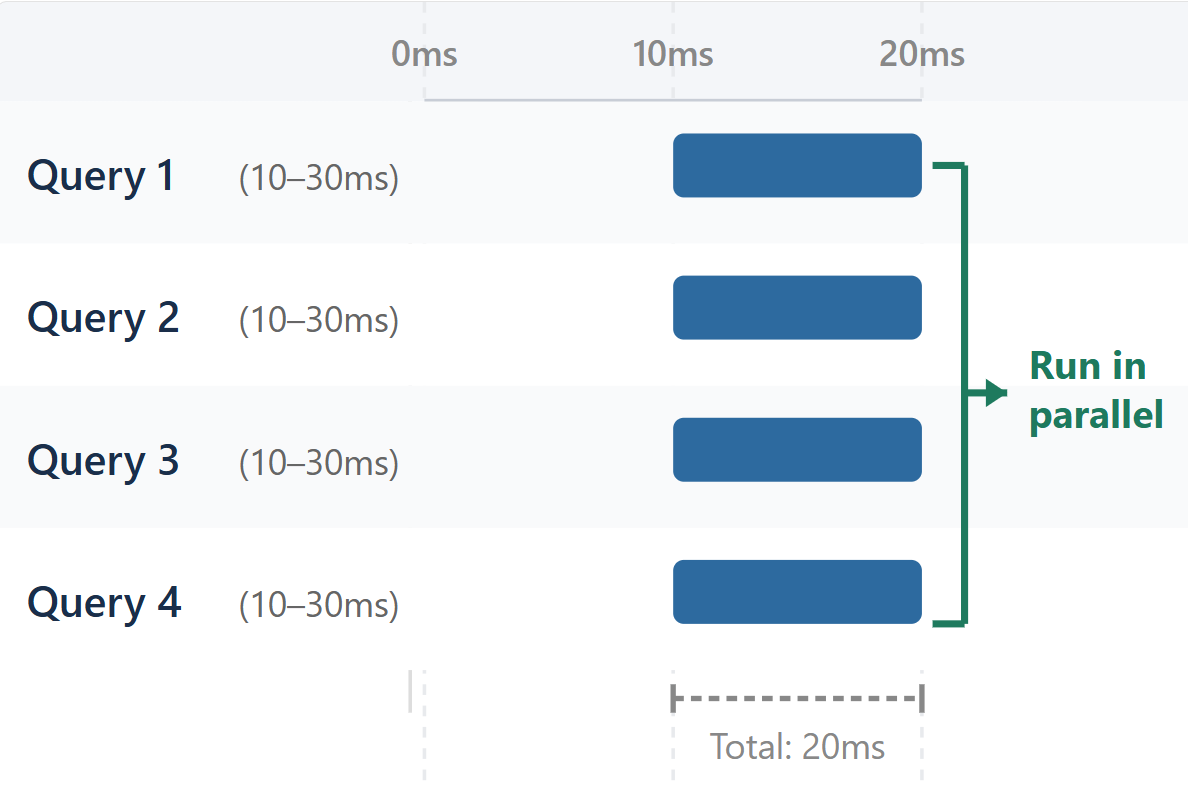
Pattern 1: Sequential bottlenecks
After (parallel - 20ms):
Pattern 3: Cold starts and cascading failures

Lambda Cold Start:
- Cold: 3000ms (2500ms init + 500ms handler)
- Warm: 500ms (handler only)
- Visible as large init segment on first invocation
Fix: provisioned concurrency, optimize initialization
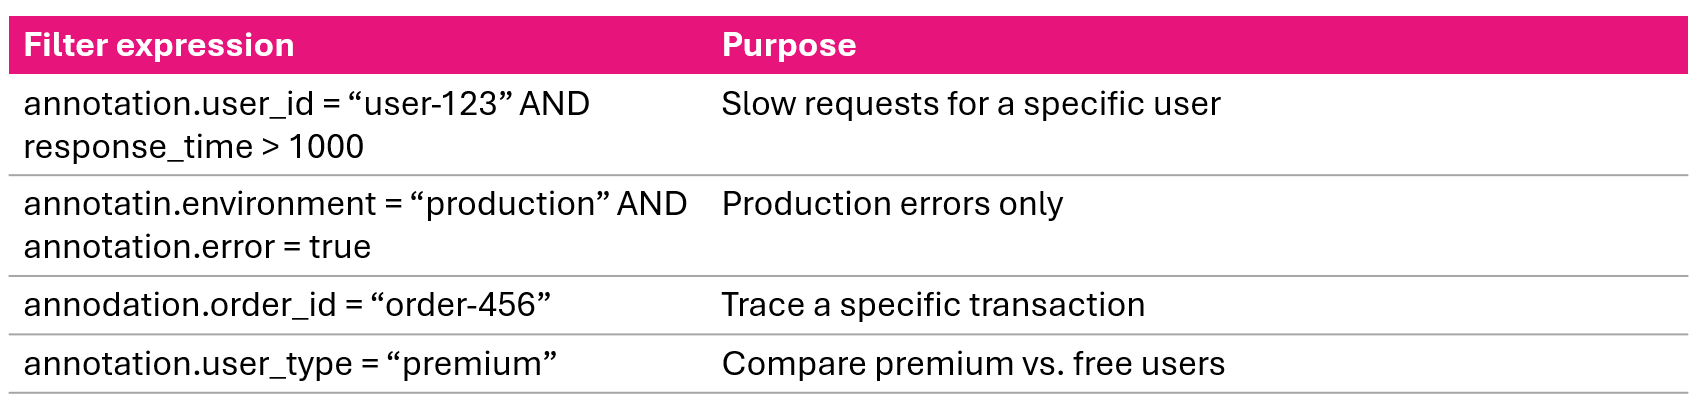
Filtering traces with annotations