CloudWatch metrics

Monitoring and troubleshooting AWS

John Q. Martin

Principal Consultant

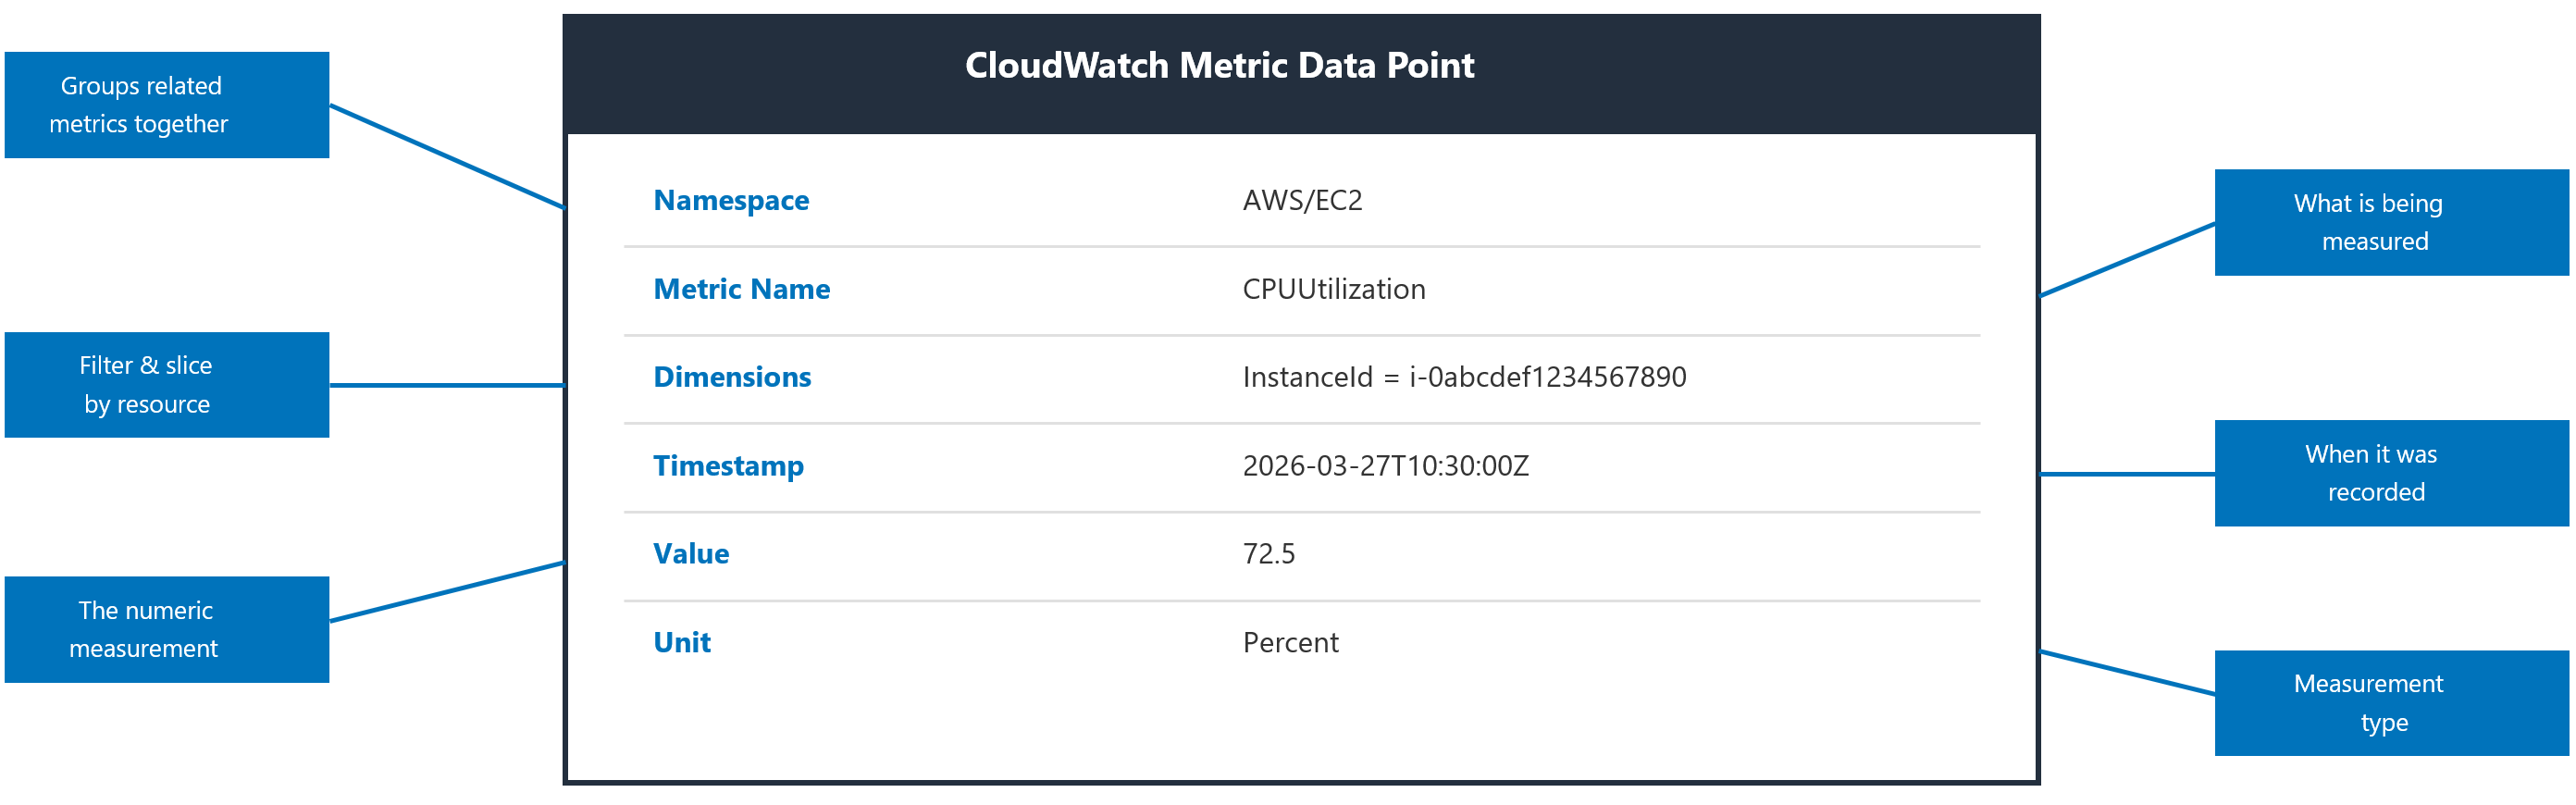
Anatomy of a CloudWatch Metric
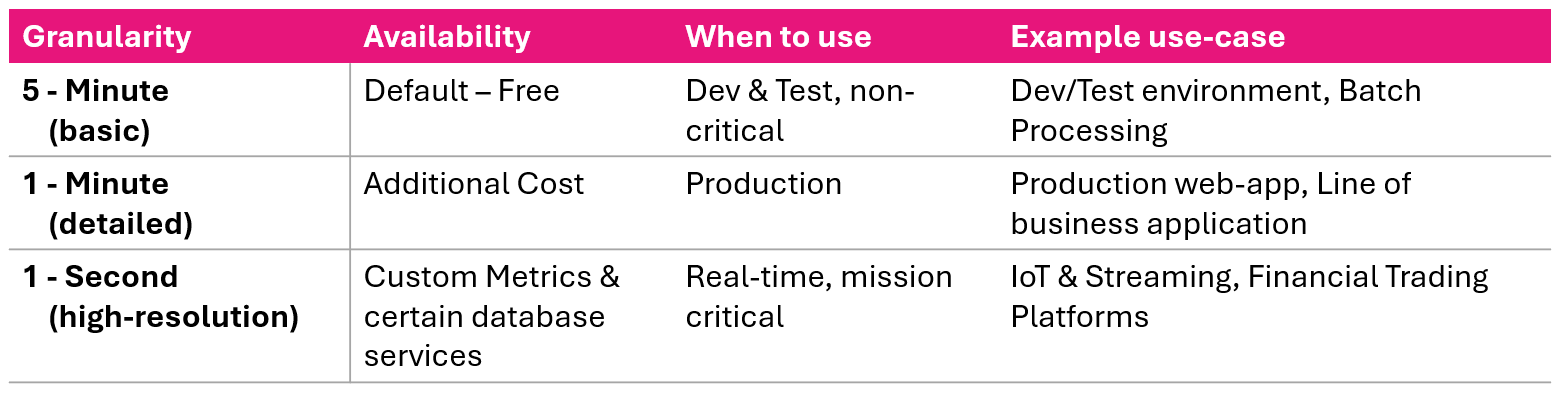
 

Diagram of a CloudWatch metric data point showing namespace, name, dimensions, timestamp, and unit

Monitoring and troubleshooting AWS

Standard vs. custom metrics

Standard

  • Published automatically by AWS services
  • EC2: 5-minute free, 1-minute with detailed monitoring
  • Examples: EC2 CPUUtilization, RDS DatabaseConnections, Lambda Invocations

Custom

  • Measure anything: page loads, orders, cache hit rates
  • Full control of namespace, dimensions, unit, resolution
  • Each namespace, name, and dimension combo is billable
Monitoring and troubleshooting AWS

Metric resolutions

Comparison of CloudWatch metric resolutions from one second to five minutes

  • One-minute for production, five-minute for dev/test
  • One-second only when genuinely needed
  • Standard: automatic and free, but has gaps
  • Custom: full control at a per-metric cost
Monitoring and troubleshooting AWS

Publishing custom metrics

Icon representing the AWS CLI for publishing metrics

  • CLI using put-metric-data for quick testing

Icon for publishing custom metrics using the REST API

  • REST API via HTTP POST for direct integration

Icon representing an Amazon SDK for publishing metrics

  • Amazon SDK

Icon representing the CloudWatch Unified Agent

  • CloudWatch Unified Agent
Monitoring and troubleshooting AWS

Publishing with CLI


aws cloudwatch put-metric-data \
  --namespace "Pipeline/DeployDb" \
  --metric-name "stepDuration" \
  --dimensions Name=Pipeline,Value=ProdApp01 \
  --value 42 \
  --unit "Seconds"


Icon representing the AWS CLI for publishing metrics

  • Instrument anything that can call a CLI
  • Make use of Dimensions
Monitoring and troubleshooting AWS

Publishing with SDK

  C# code sample using the Amazon CloudWatch SDK to publish a custom metric


Icon representing an Amazon SDK for publishing metrics

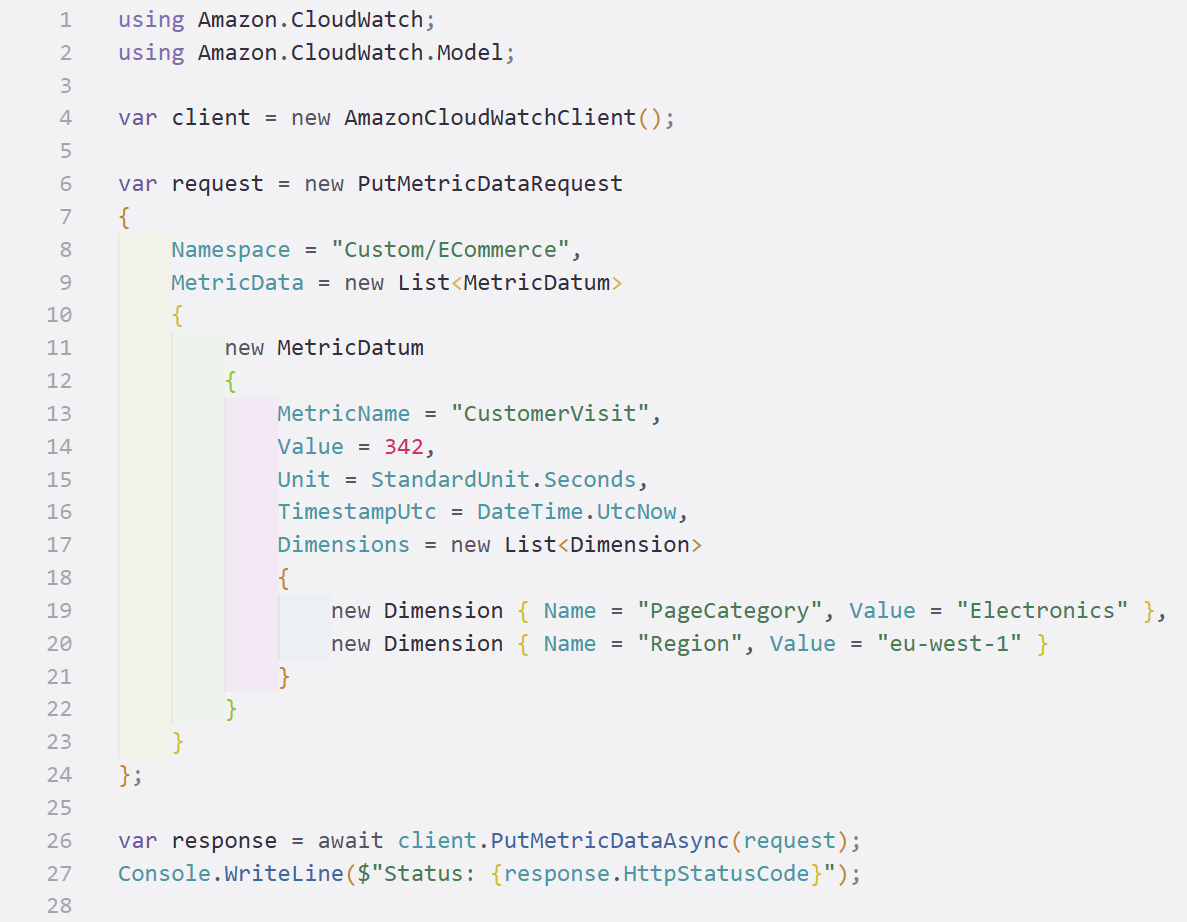
  • SDKs for C#, Java, Go, Rust, and more
  • Publish metrics from application code
  • Dimensions segment a metric across app parts
Monitoring and troubleshooting AWS

Unified agent

JSON configuration file for the CloudWatch Unified Agent defining metrics and collection intervals

Icon representing the CloudWatch Unified Agent

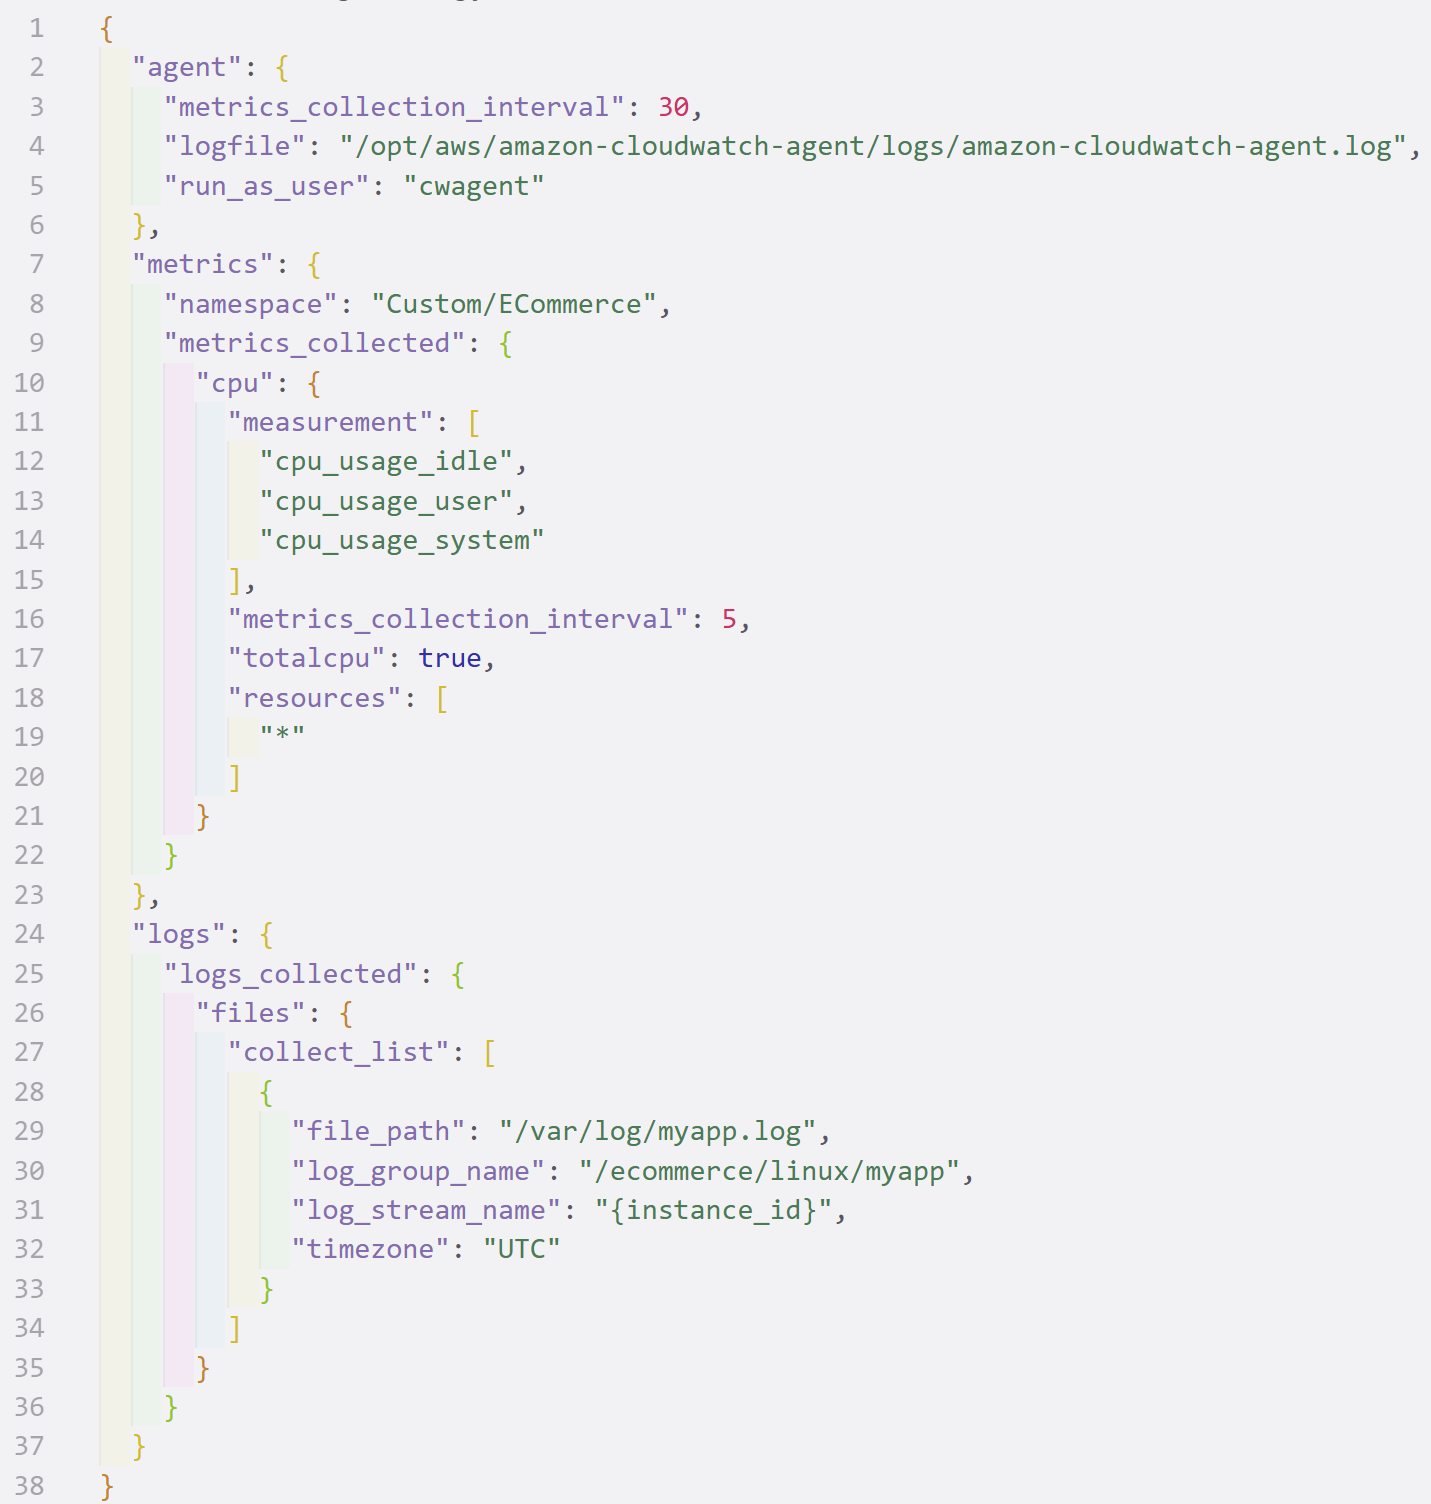
  • Collects OS-level metrics and logs
  • Runs on EC2 instances or containers
  • JSON config sets what to collect
  • Tune collection interval per metric
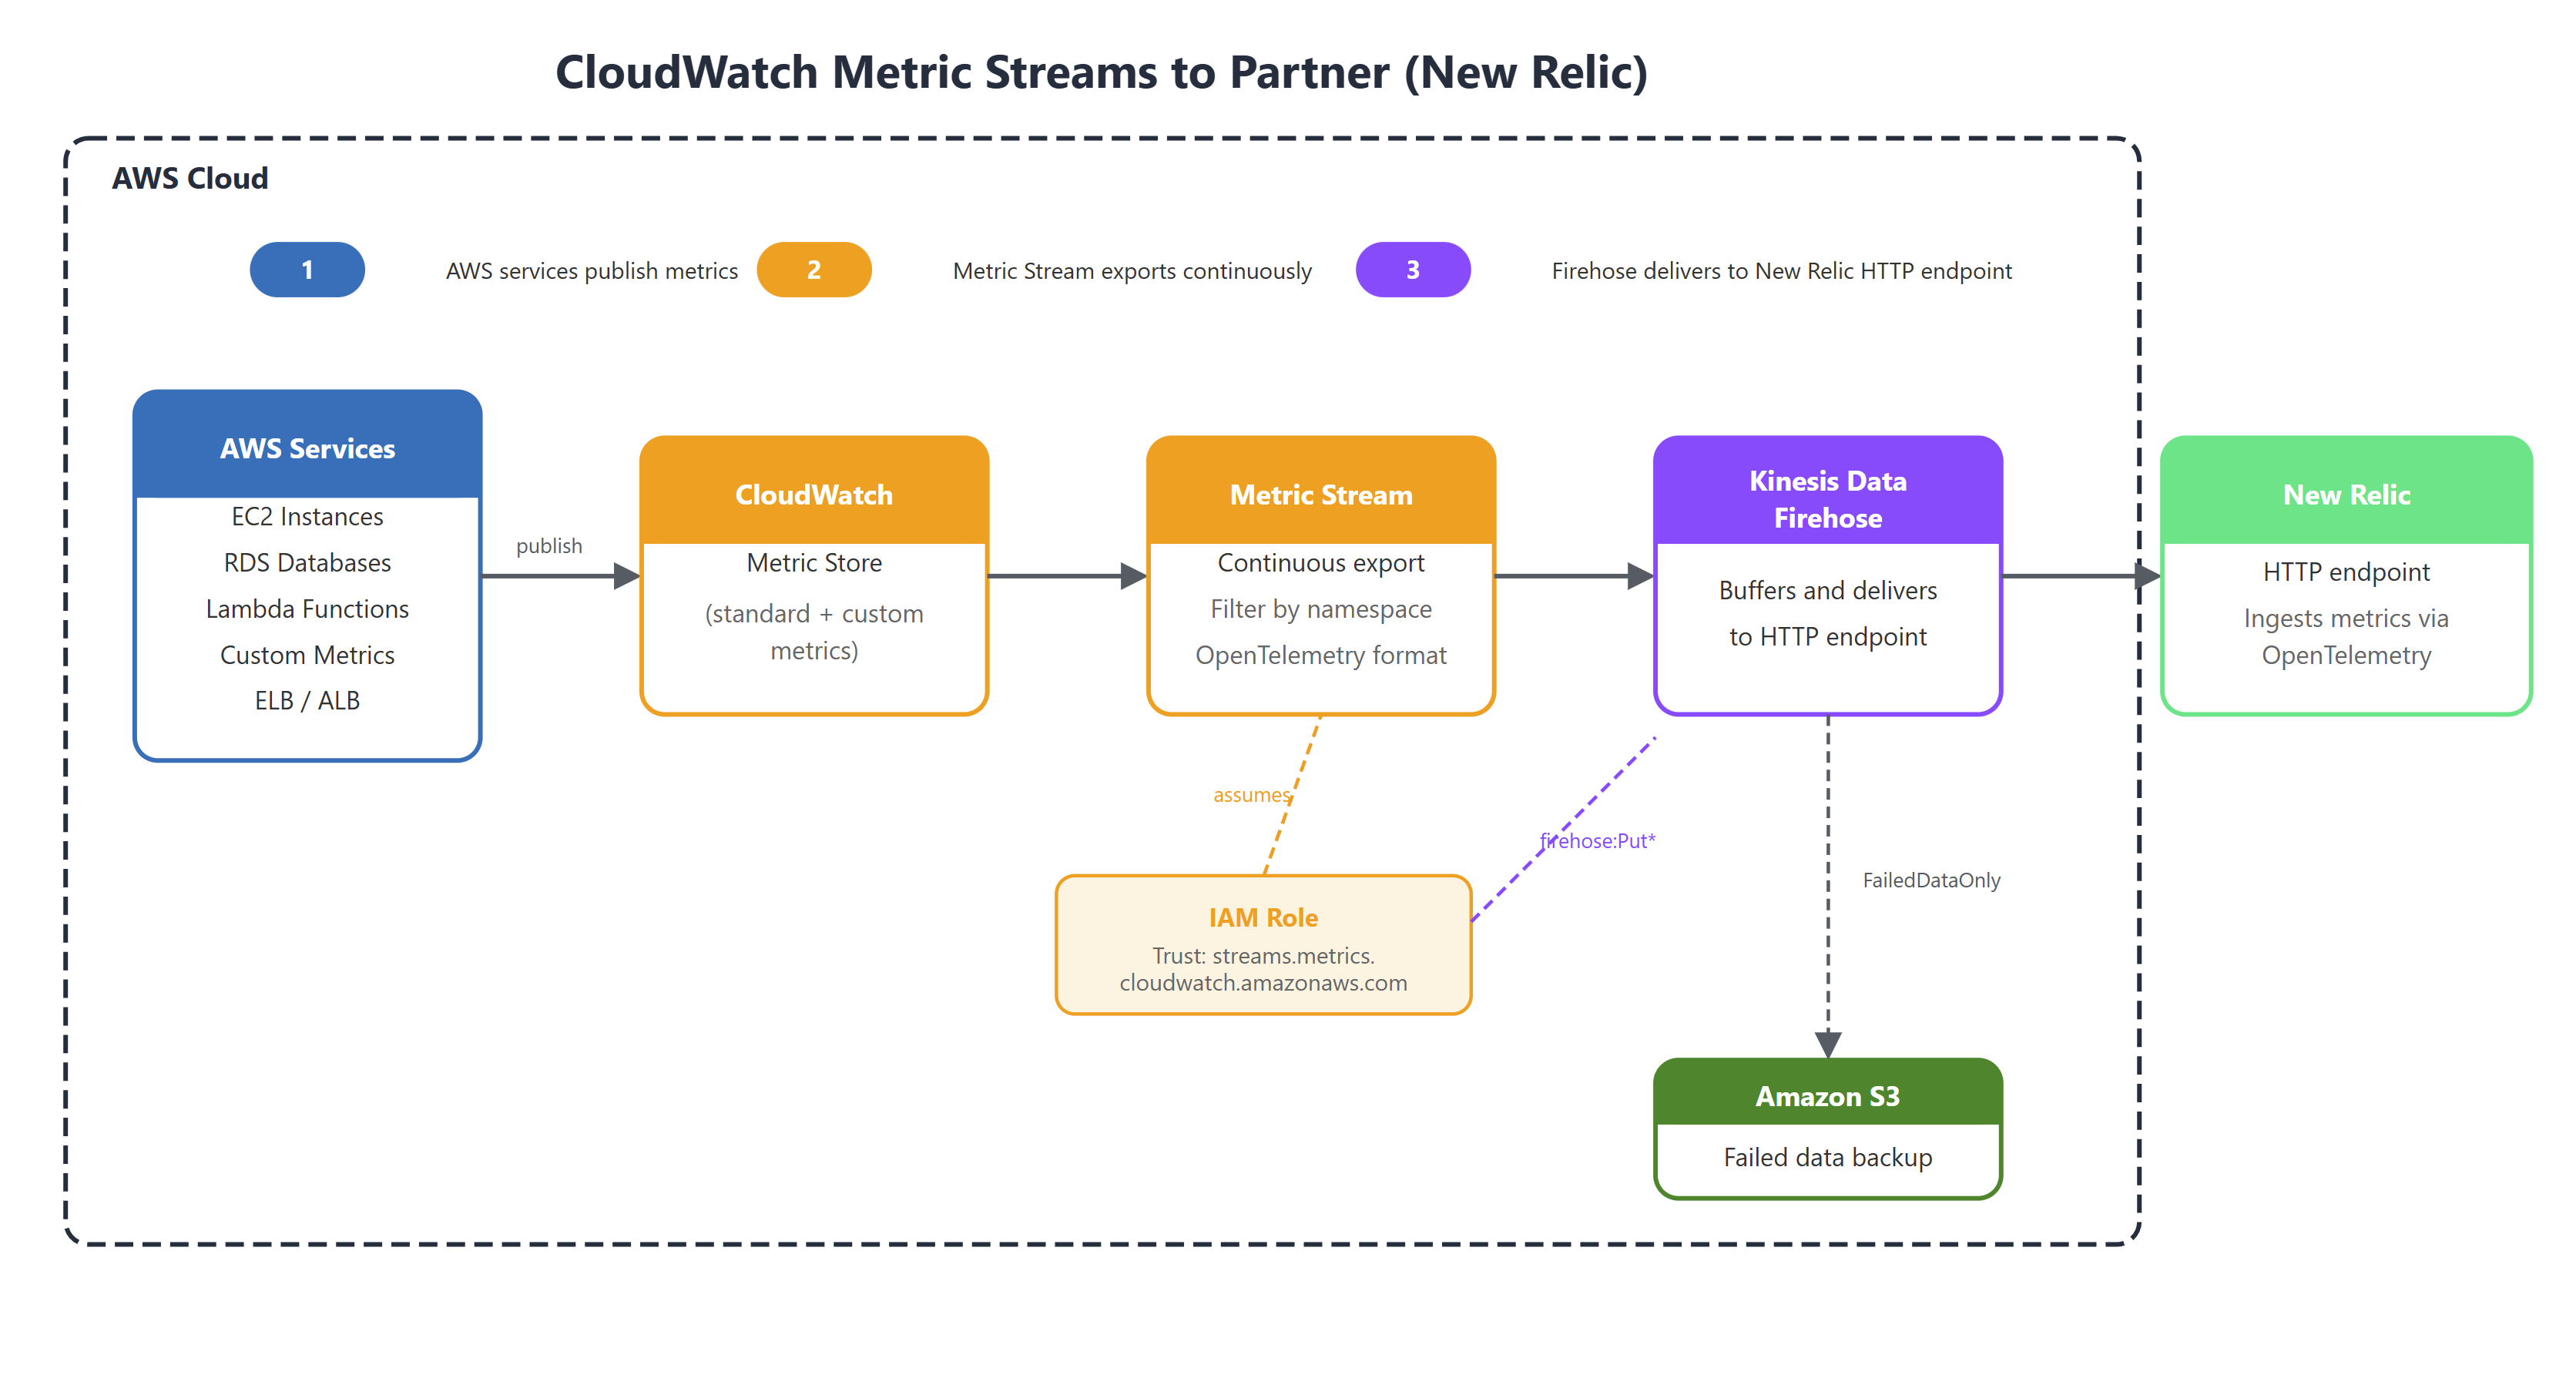
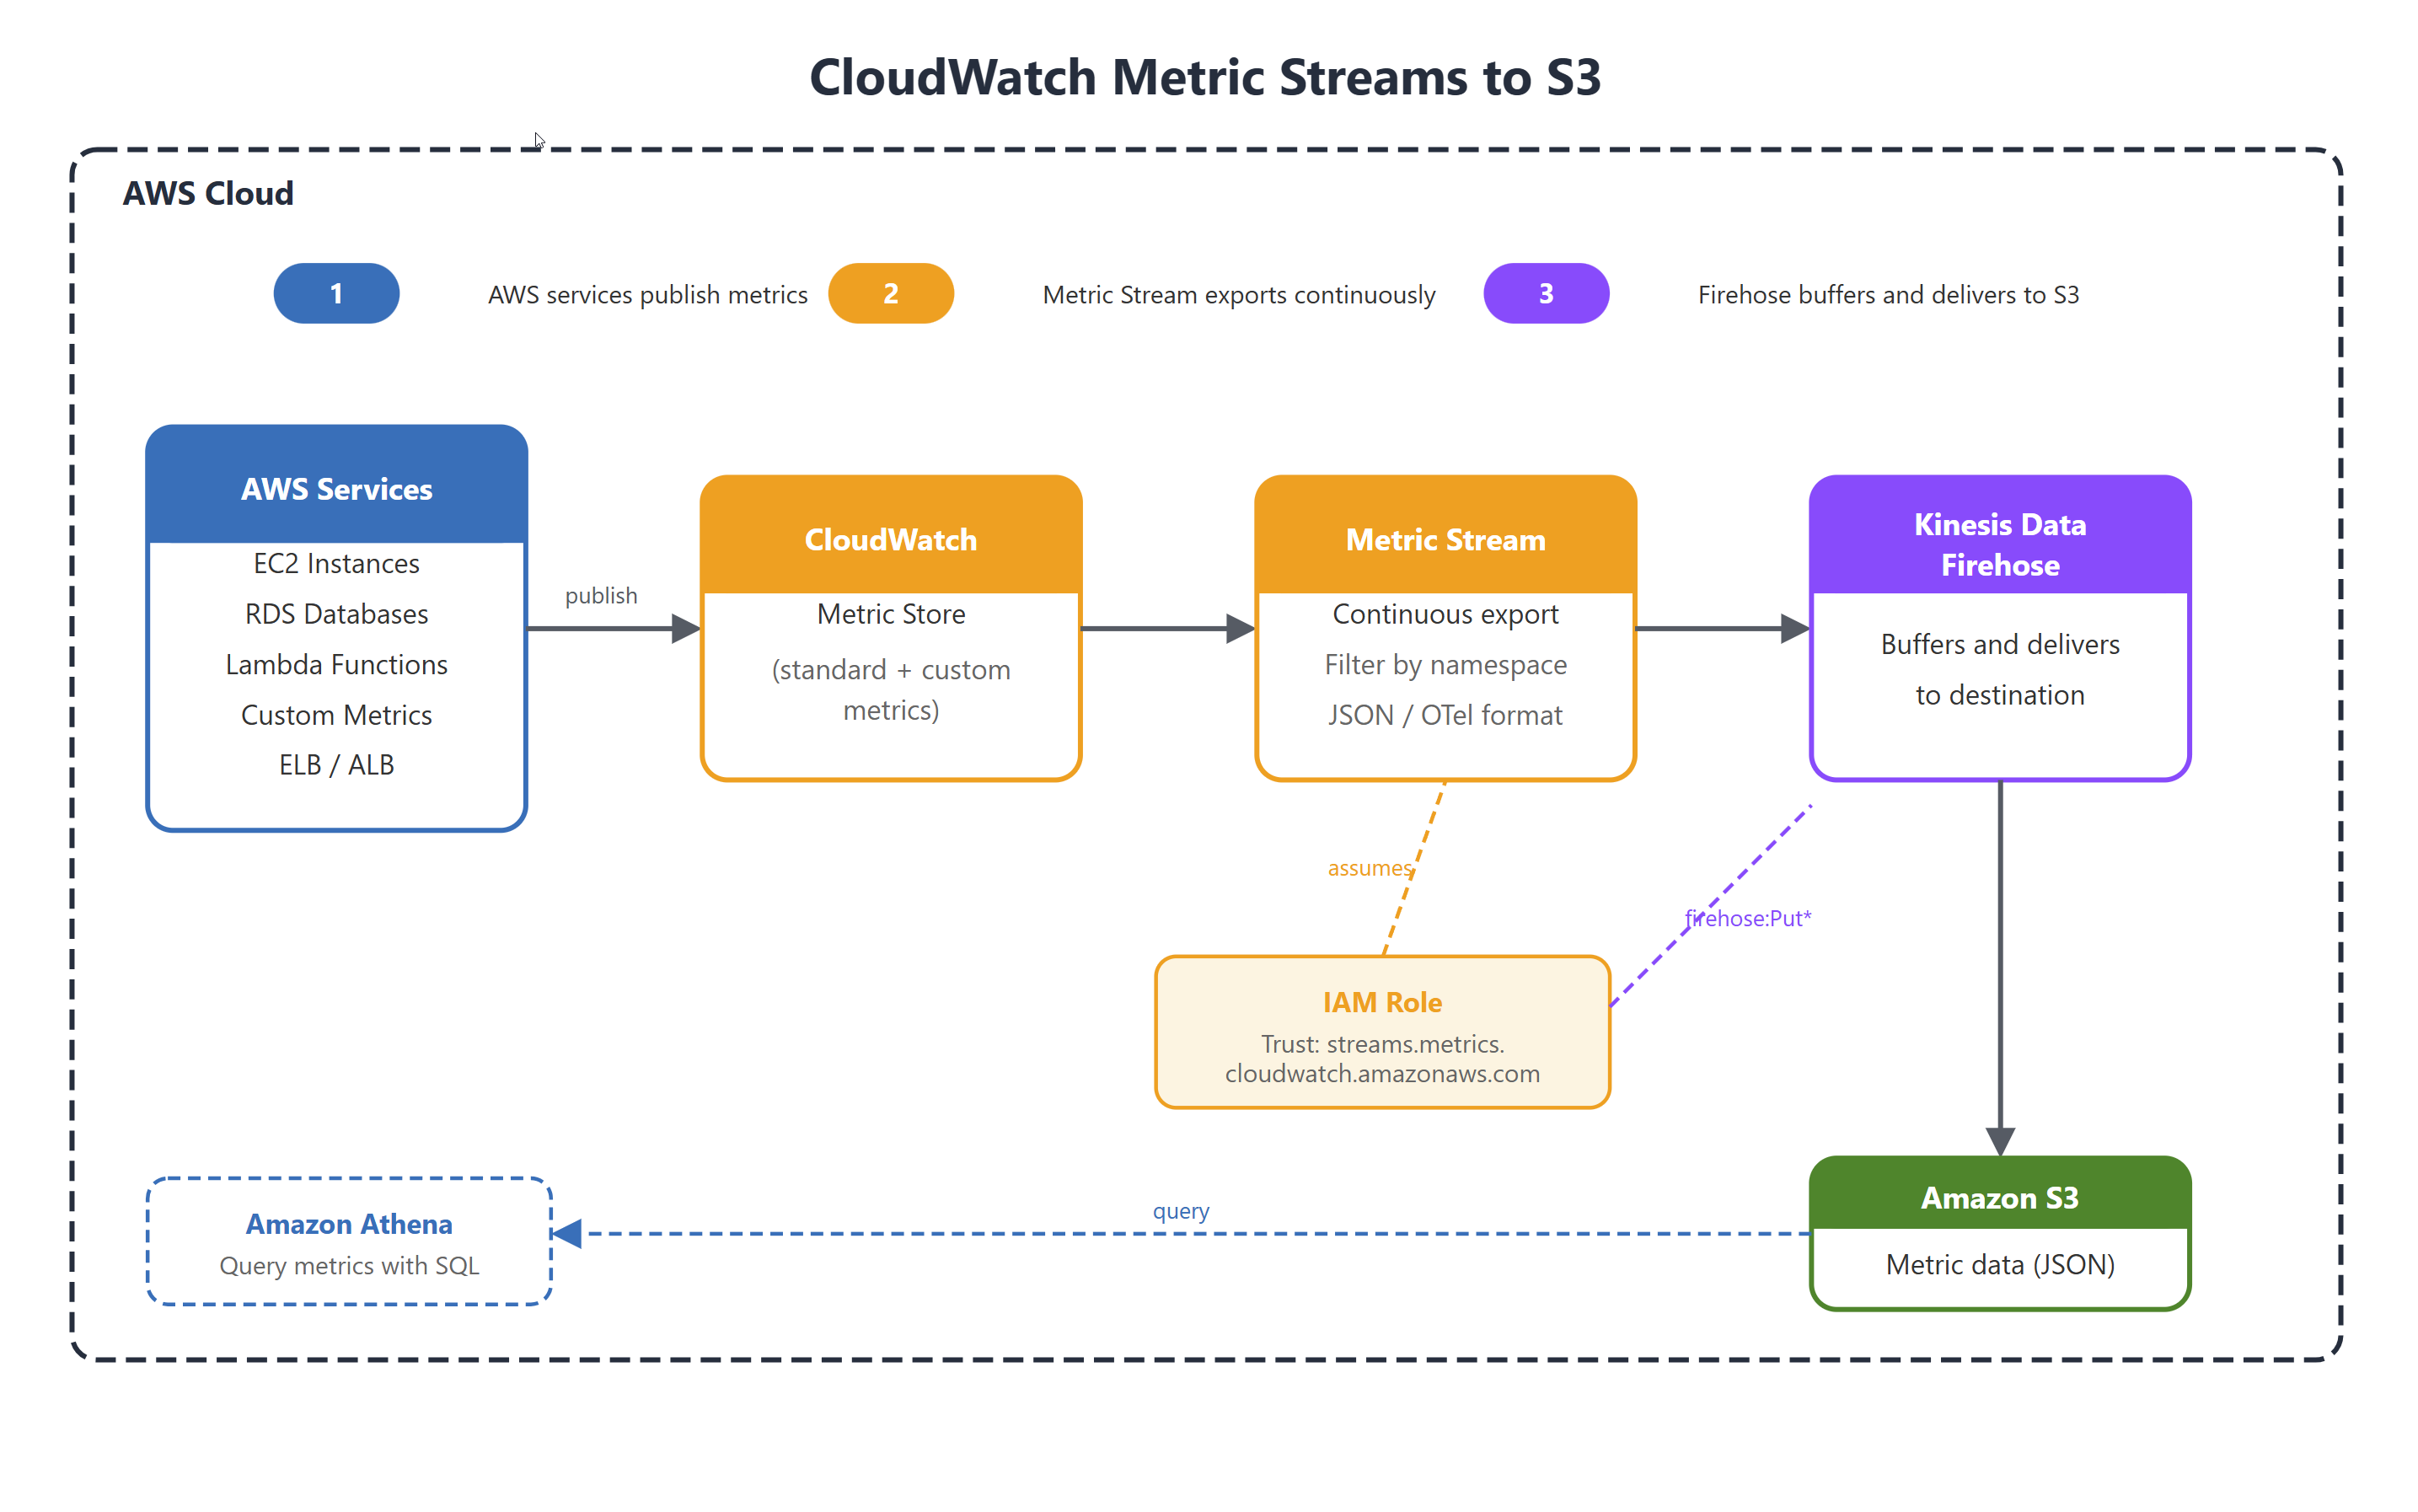
Monitoring and troubleshooting AWS

Embedded Metric Format (EMF)

{
  "_aws": {
    "CloudWatchMetrics": [{
      "Namespace": "MyApp",
      "Dimensions": [["functionName"]],
      "Metrics": [{"Name": "latency", "Unit": "Milliseconds"}]
    }]
  },
  "functionName": "checkout",
  "latency": 56
}


  • Write metrics as structured JSON in your logs
  • CloudWatch extracts the metrics automatically
  • Ideal for Lambda and containers, no extra API call
  • Metrics and logs from a single write
Monitoring and troubleshooting AWS

Metric streams


  • Continuously export data to external targets
  • S3 or partners like New Relic, Datadog
  • Enables richer analytics than CloudWatch alone
  • Single pane of glass for hybrid cloud

Overview diagram of CloudWatch metric streams exporting data to external targets

Monitoring and troubleshooting AWS

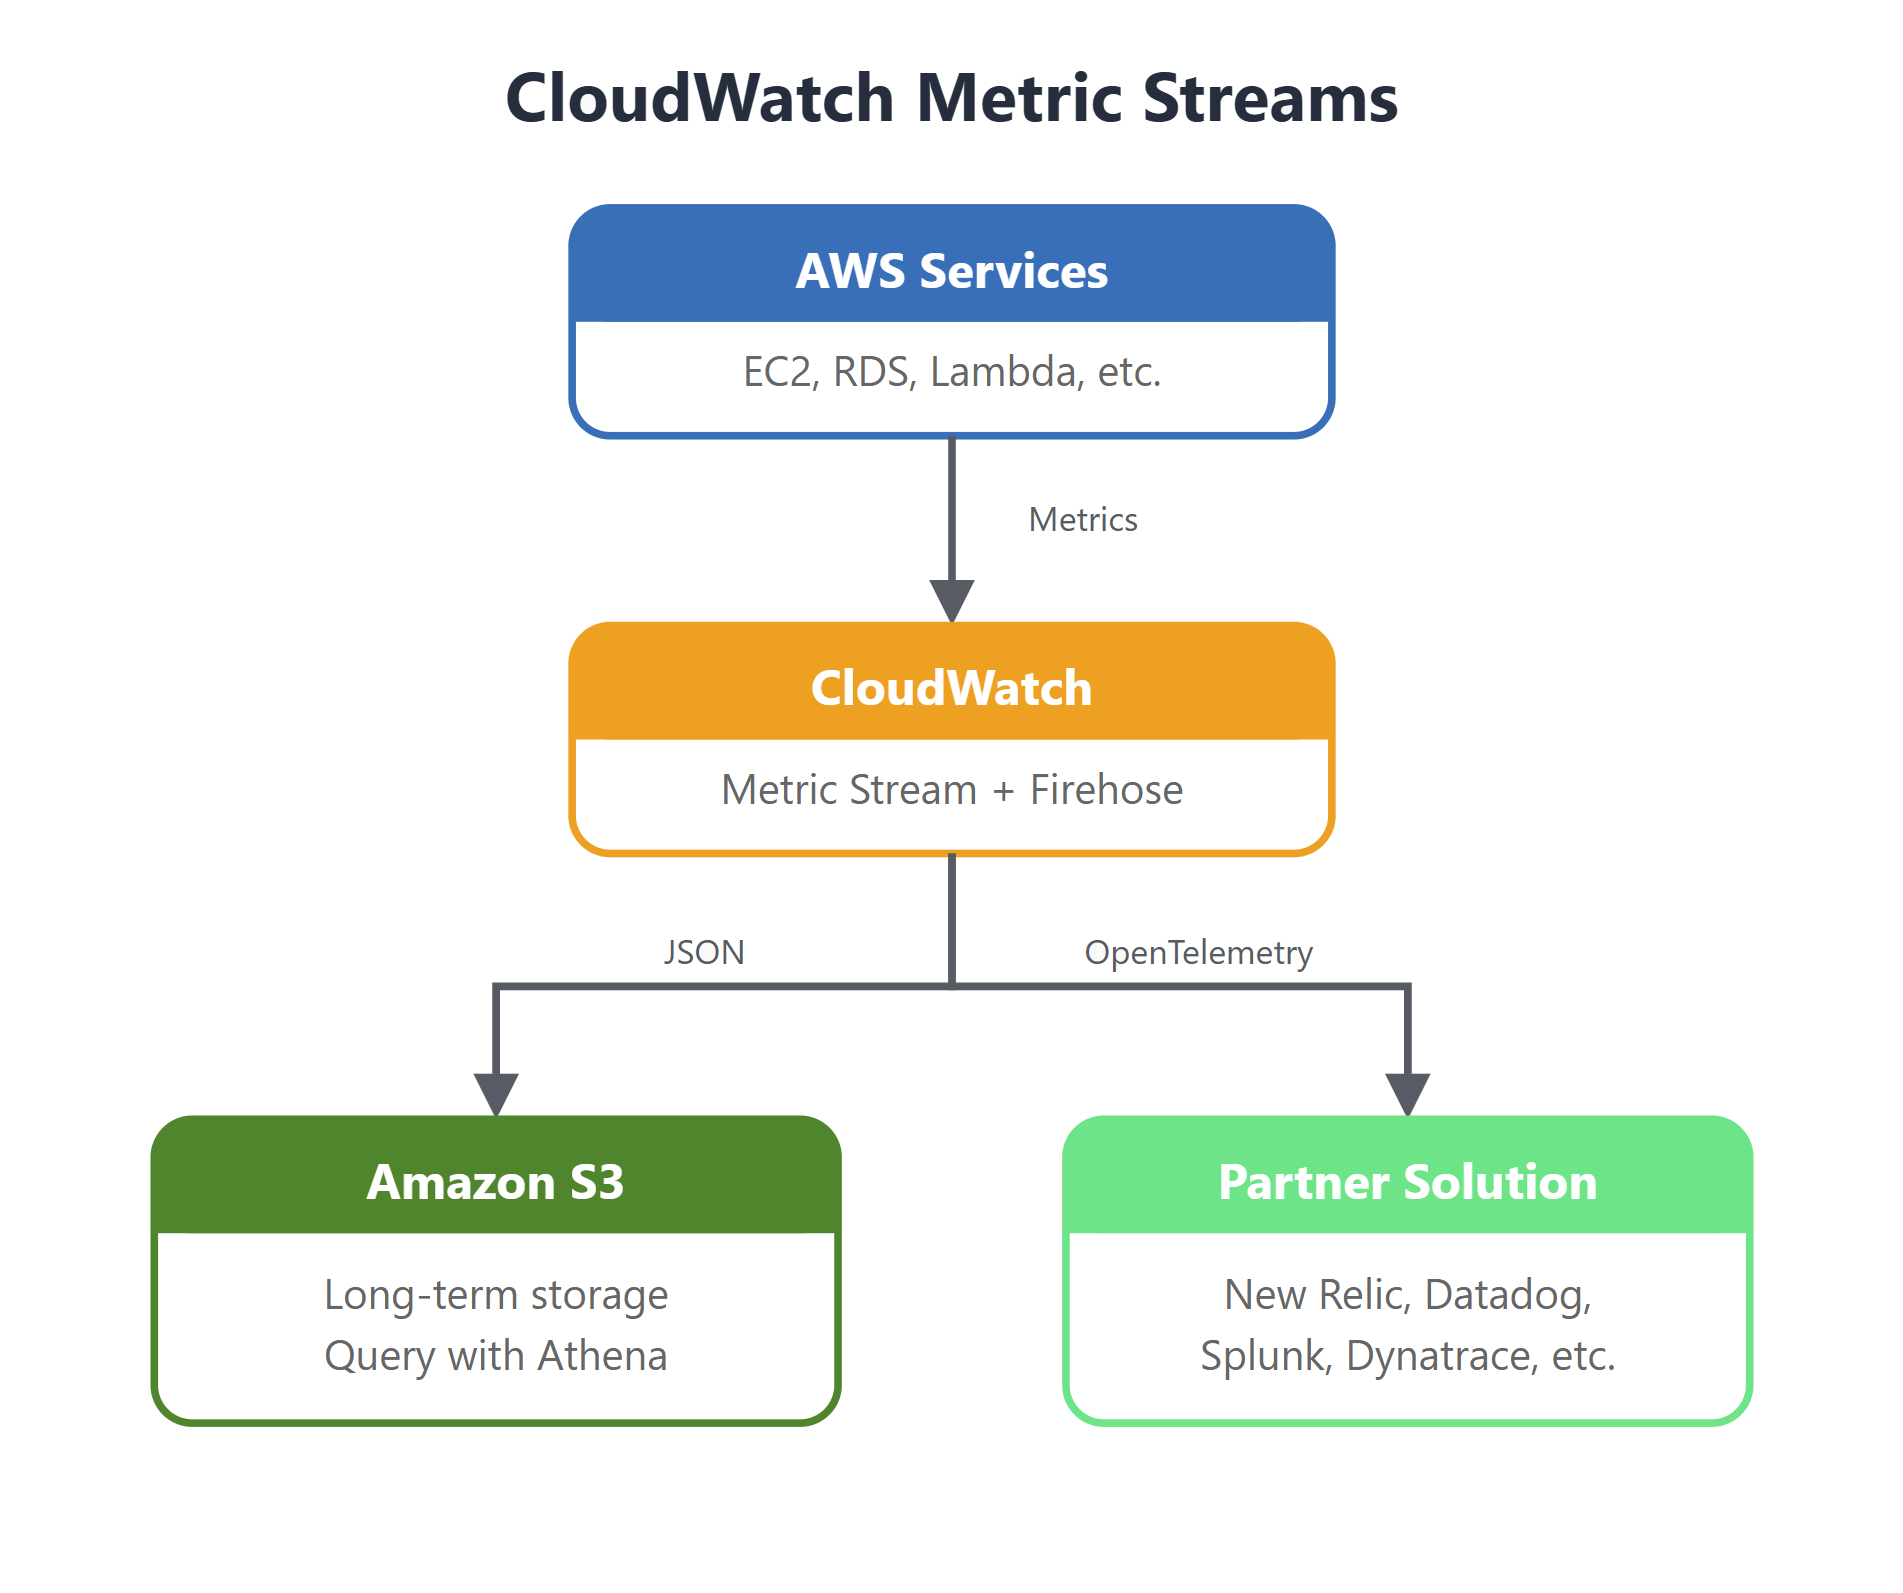
Streaming to Amazon S3

Diagram of metrics streaming from CloudWatch through Kinesis Data Firehose to an S3 bucket

Monitoring and troubleshooting AWS

Streaming to partner solution

Diagram of metrics streaming through Kinesis Firehose to a partner solution endpoint with S3 backup

Monitoring and troubleshooting AWS

Summary

Metrics and Custom Metrics

  • Measure attributes of workloads
  • Custom metrics for your own applications
  • Make use of Dimensions


Resolutions for detection

  • Granularity is important
  • Free Vs. Paid
  • Service dependent

Publishing Custom metrics

  • Instrument processes and applications
  • Dimensions for categorization
  • SDK or CLI over API


Metric streams

  • S3 or Partner solution
  • Custom analytics
  • Single pane of glass
Monitoring and troubleshooting AWS

Let's practice!

Monitoring and troubleshooting AWS

Preparing Video For Download...