CloudWatch alarms and notifications
Monitoring and troubleshooting AWS

John Q. Martin
Principal Consultant
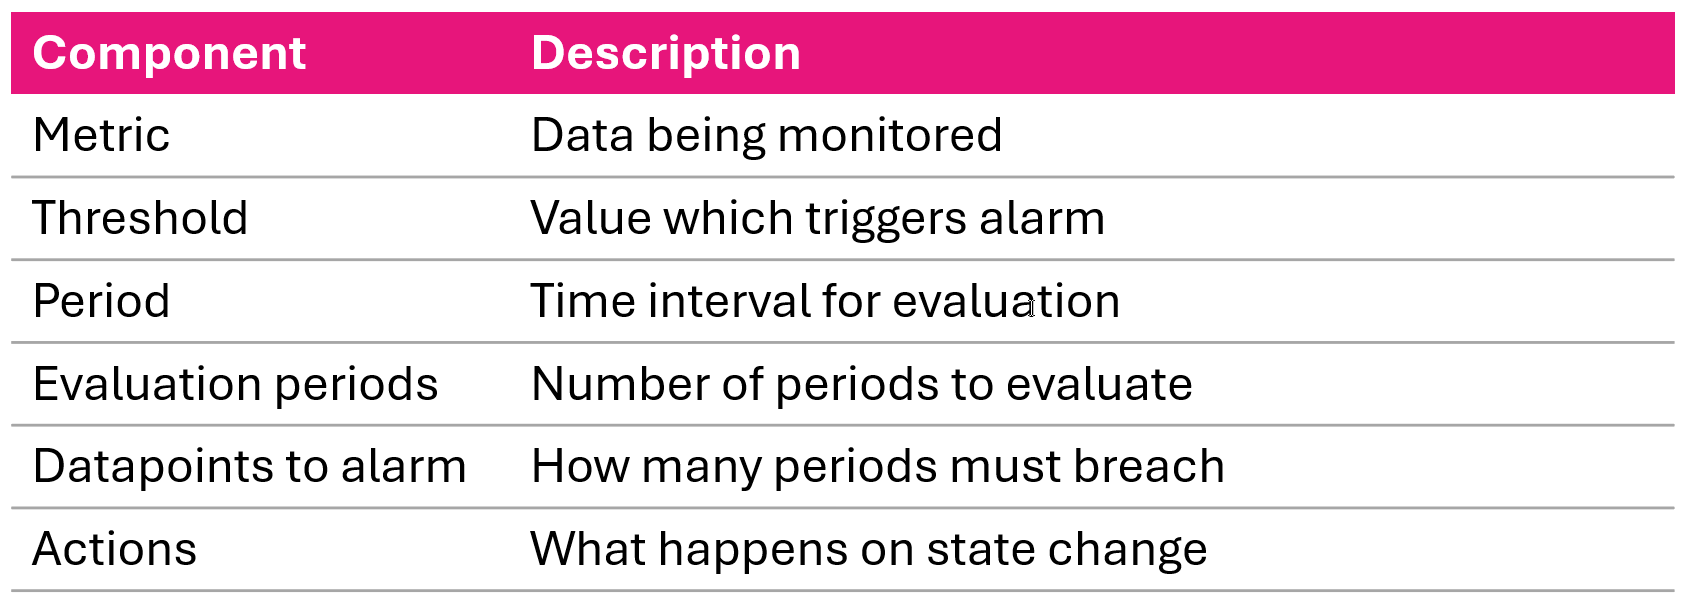
What are CloudWatch Alarms
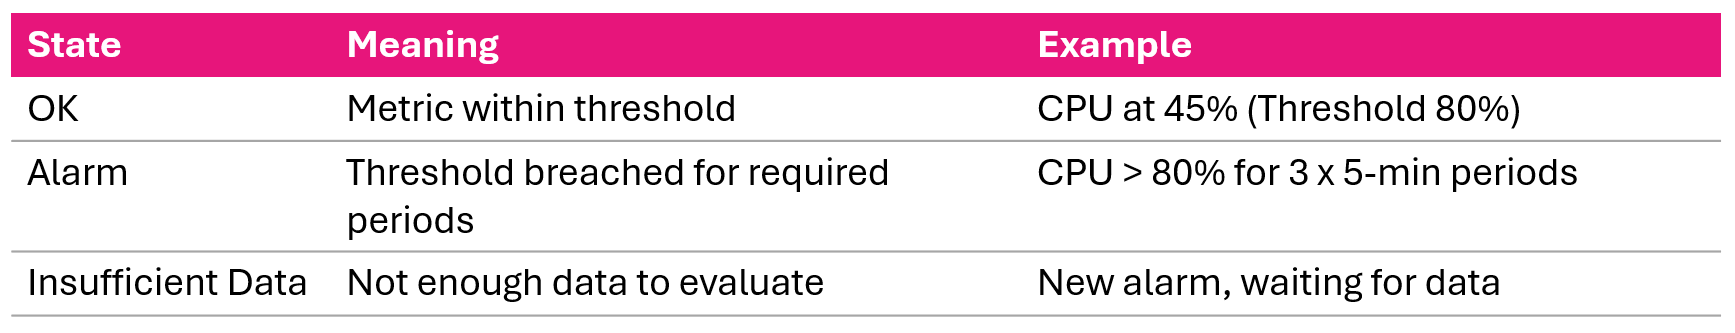
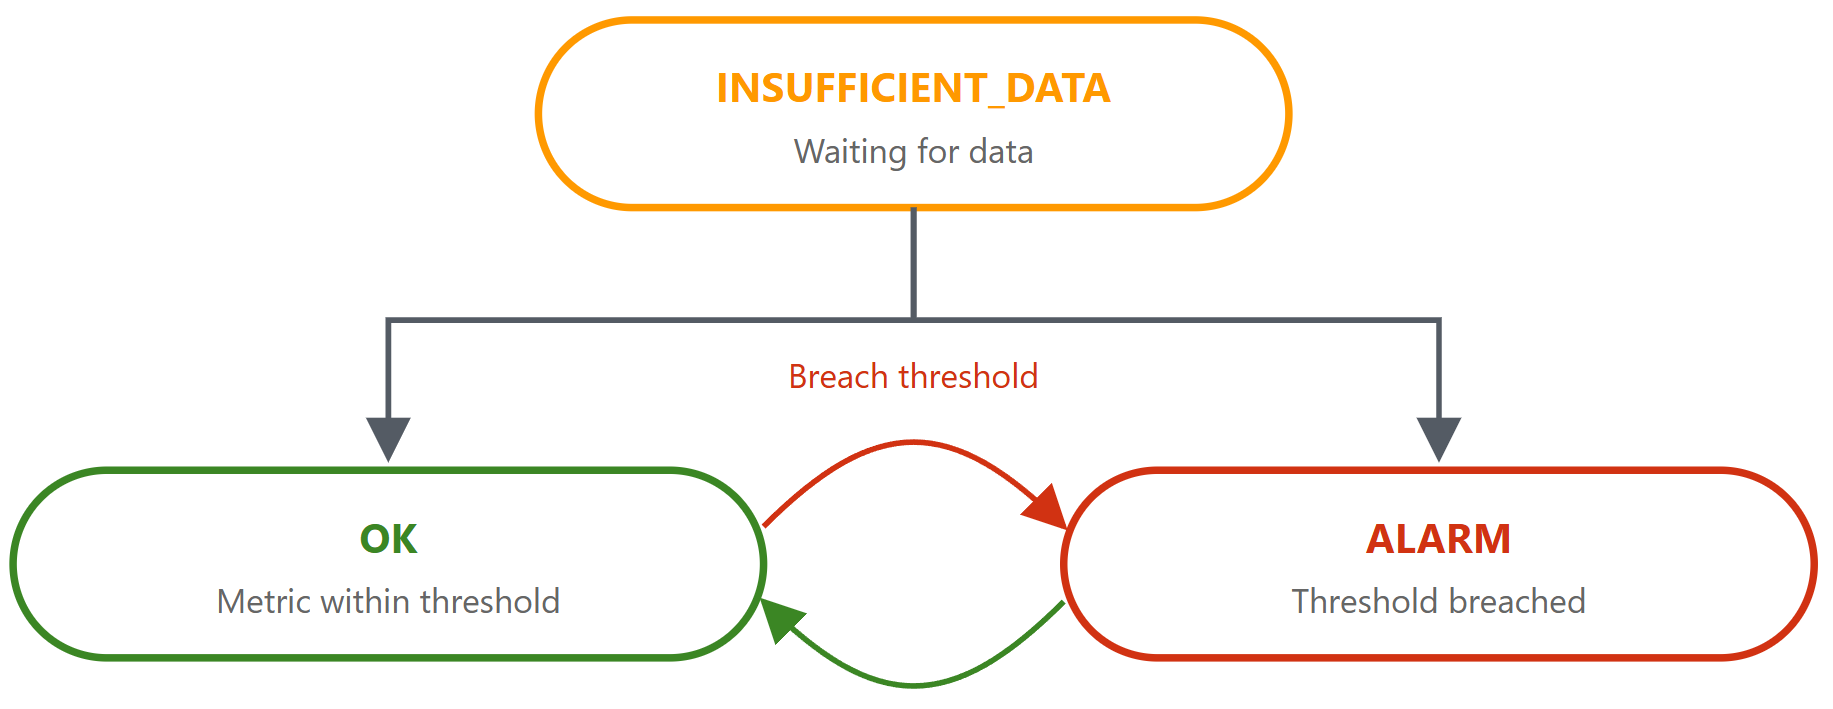
Alarm States
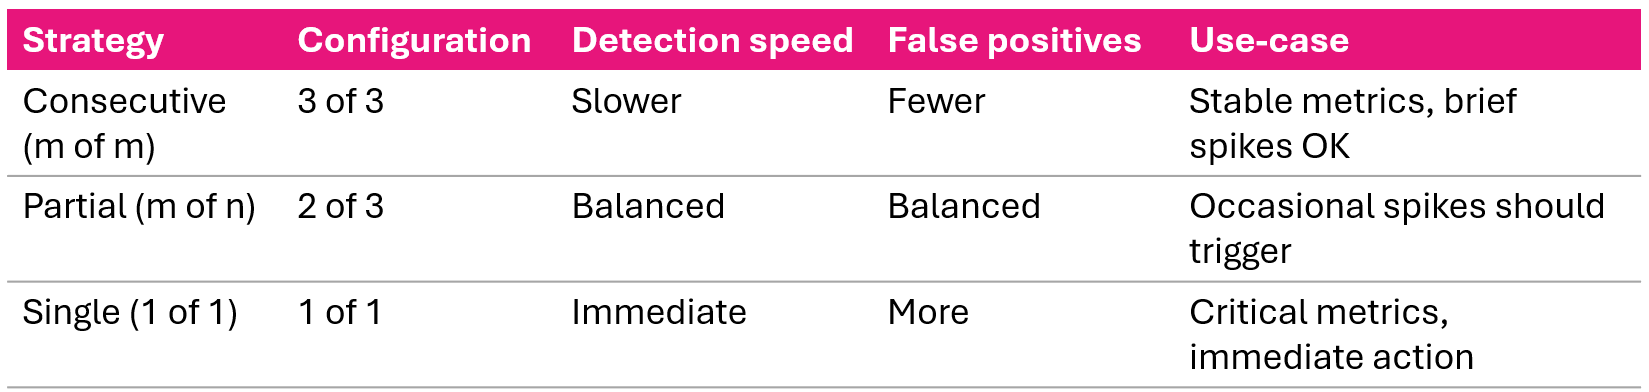
Evaluation strategies
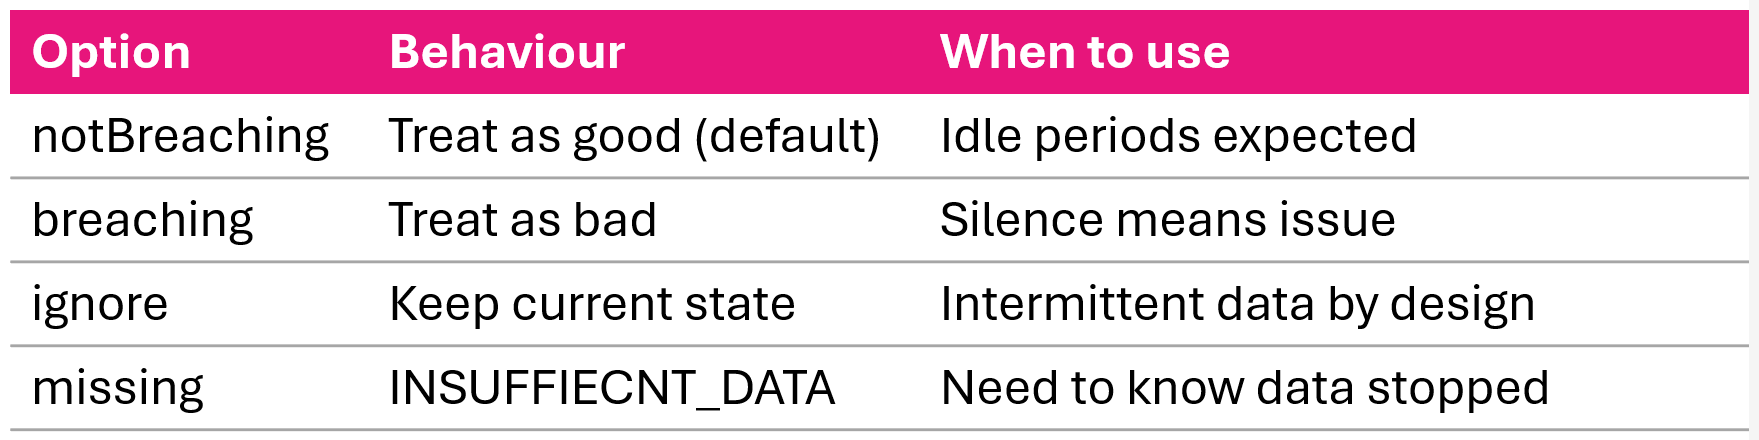
Missing data behavior
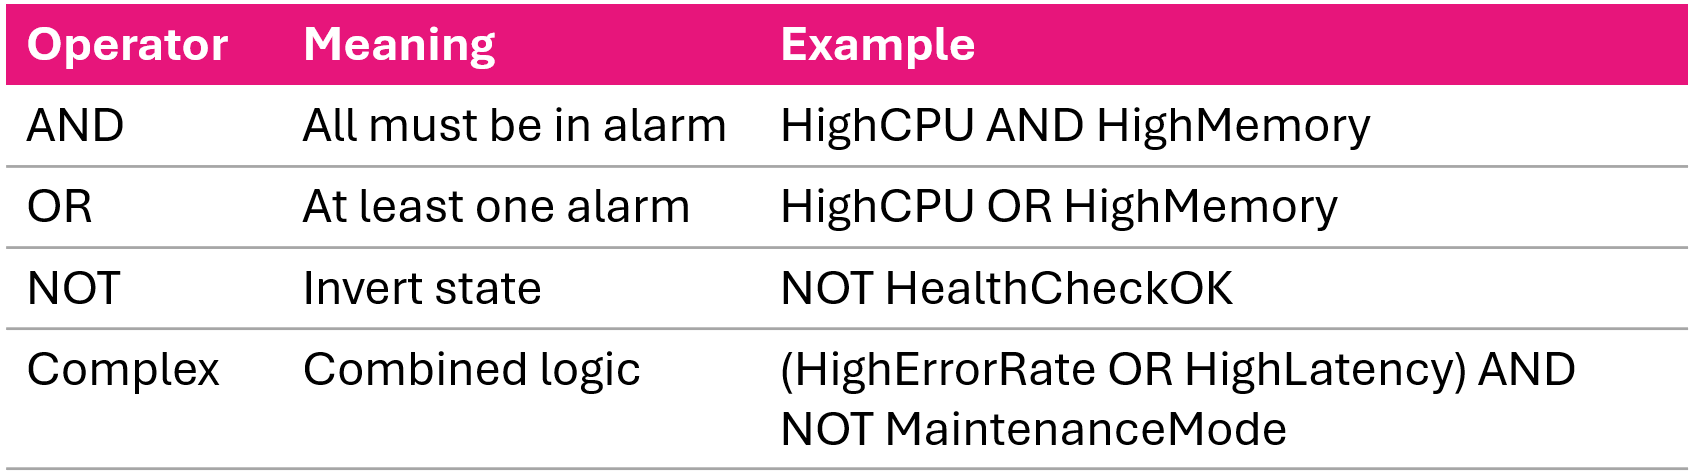
Composite alarms: what and why
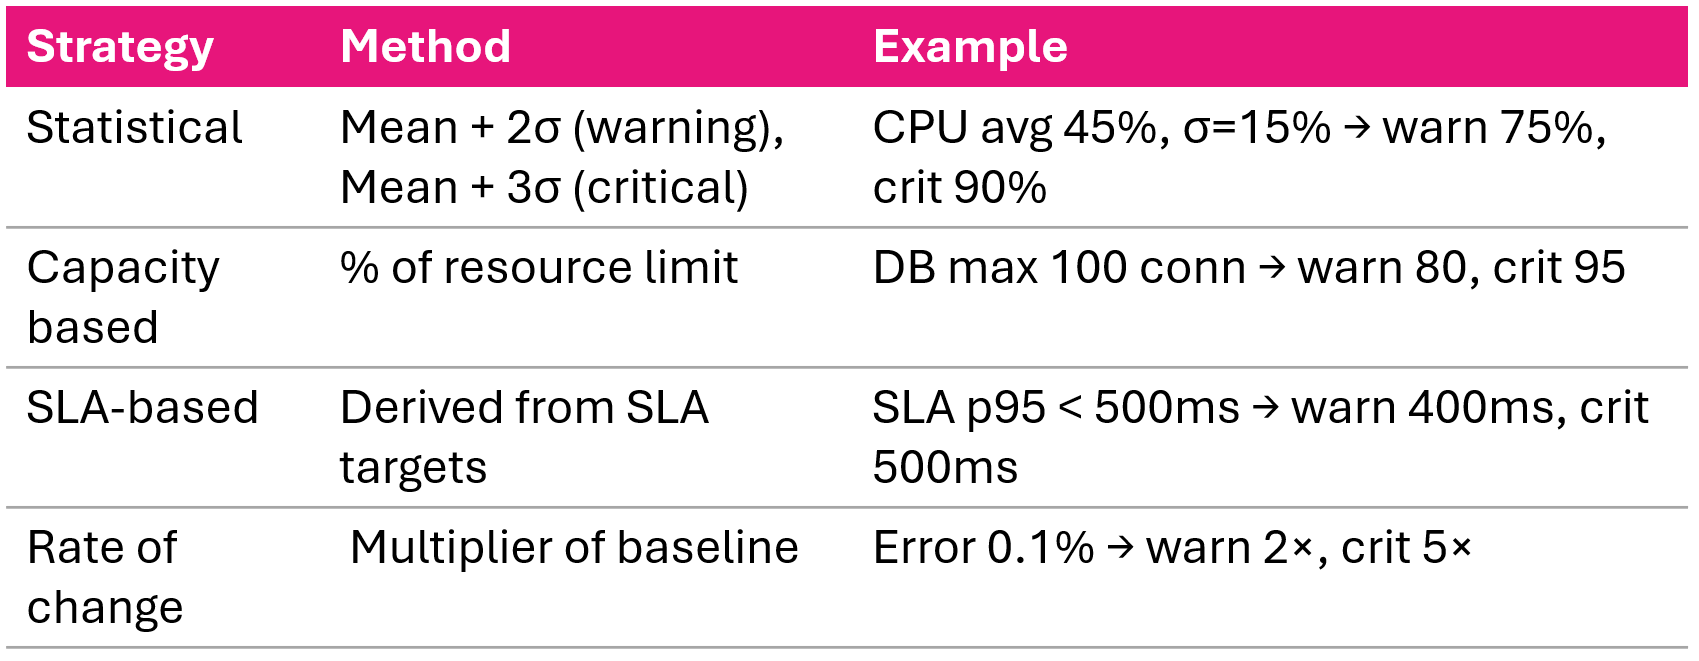
Threshold selection strategy
Multi-tier alarm strategy
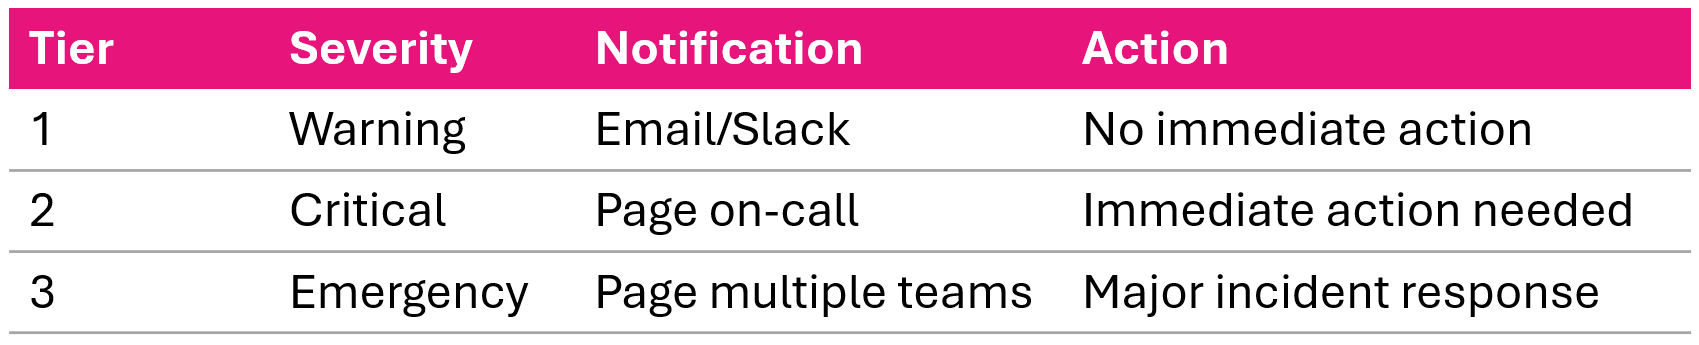
Example: CPU Warning at 75%, Critical at 90%, each with different SNS topics
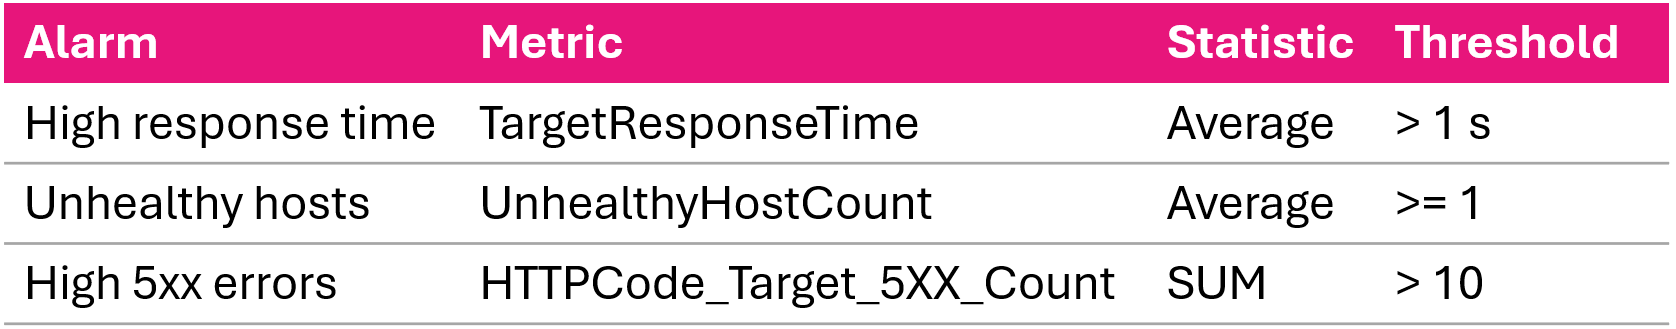
Resource alarms: Lambda and ALB
Lambda alarms
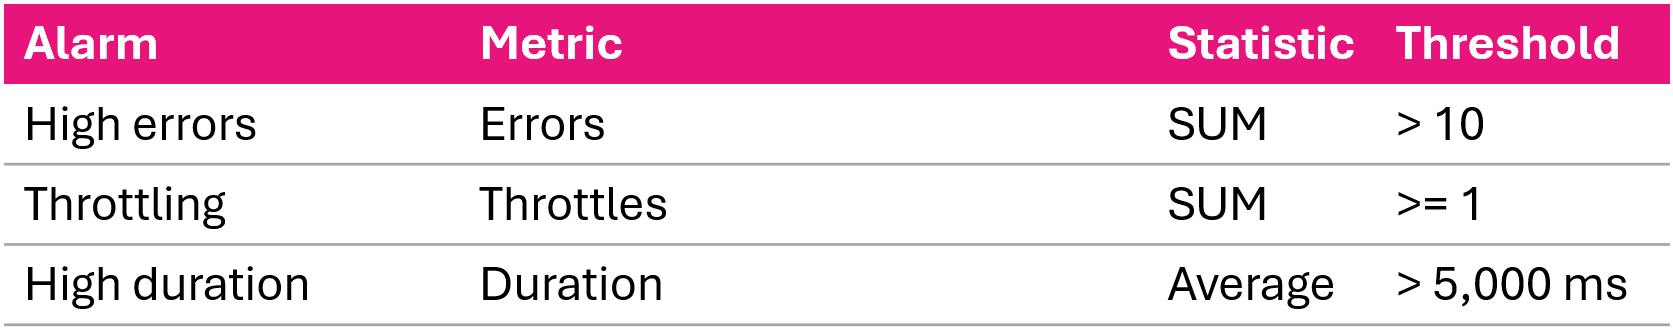
ALB alarms